THE CHANGING LANDSCAPE OF HIGHER EDUCATION - (AND WHAT IT MAY MEAN FOR NCA&T)
←
→
Page content transcription
If your browser does not render page correctly, please read the page content below
THE CHANGING LANDSCAPE
  OF HIGHER EDUCATION
(AND WHAT IT MAY MEAN FOR NCA&T)

                               1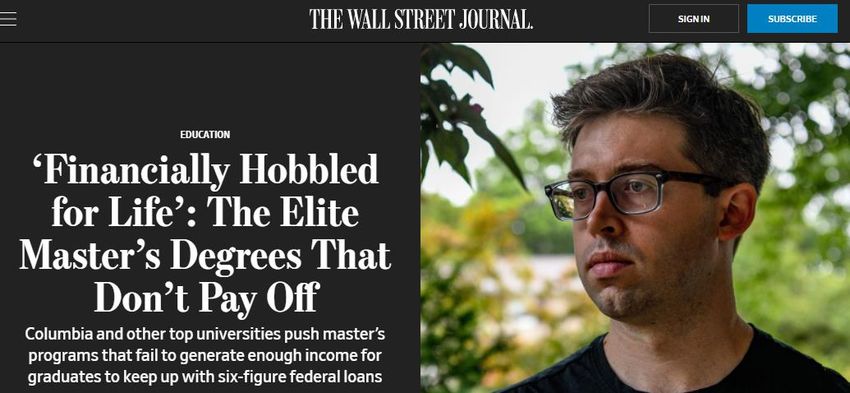
Outline

1.   Context: Three trends shaping higher education
2.   Demographic change in state and region
3.   New markets
4.   New models
5.   Discussion: thriving in a changing world

                                                  2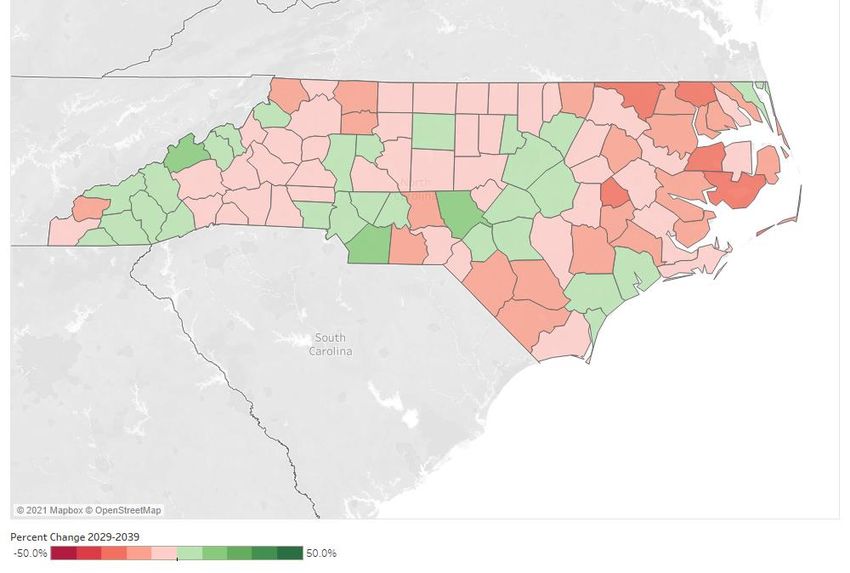
A&T Currently in a Strong Position

                                 Enrollment                                                         Five-year Graduation Rates
                                                                                                             (Any US University)
14,000                                                                        55.0%

                                                                     12,753
13,000                                                                                                                                   50.9%     51.3%
                                                                                                                     50.7%
                                                                              50.0%                                            49.2%
12,000

11,000
                        10,561
                                                                              45.0%
10,000
                                                                                       41.0%
                                                                                                 40.4%
                                                                                                           40.0%
 9,000                                                                        40.0%

 8,000
                                                                              35.0%
 7,000

 6,000
                                                                              30.0%

 5,000
             Fall Fall Fall Fall Fall Fall Fall Fall Fall Fall
            2011 2012 2013 2014 2015 2016 2017 2018 2019 2020                 25.0%
                                                                                      Fall 2009 Fall 2010 Fall 2011 Fall 2012 Fall 2013 Fall 2014 Fall 2015
         Undergraduate Student Count Fall   Graduate Student Count Fall

                                                                                                                                                              3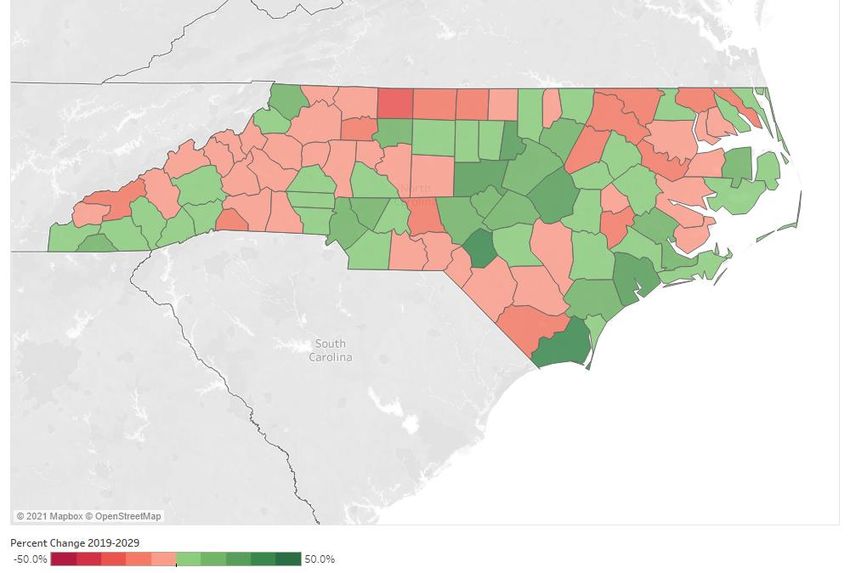
1. QUESTIONS ABOUT
OUR VALUE PROPOSITION

                        4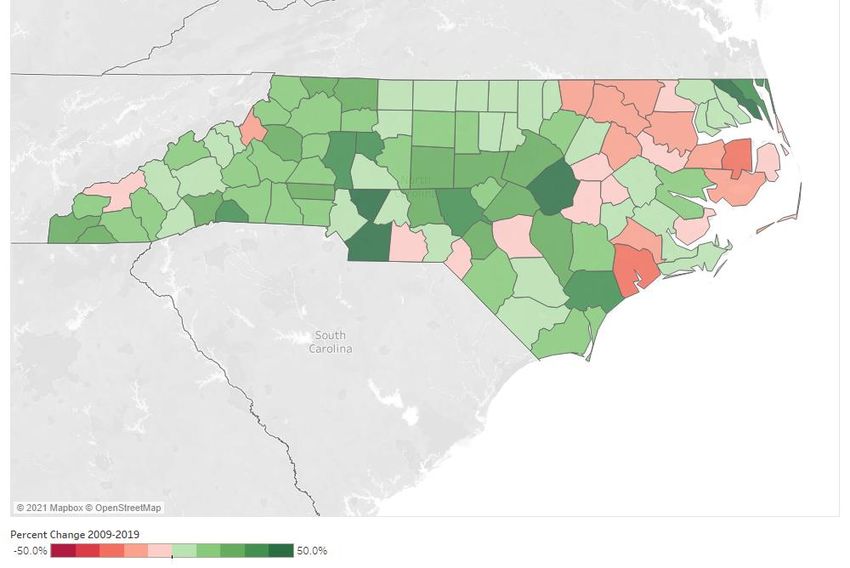
Questions About Our Value Proposition

MarketWatch, November 2017

                                                    5
Greater Transparency Around Value Proposition

                                               College Scorecard, 2021

              Georgetown Center on Education
                                                                         6
              and the Workforce, “Buyer
              Beware,” 2020.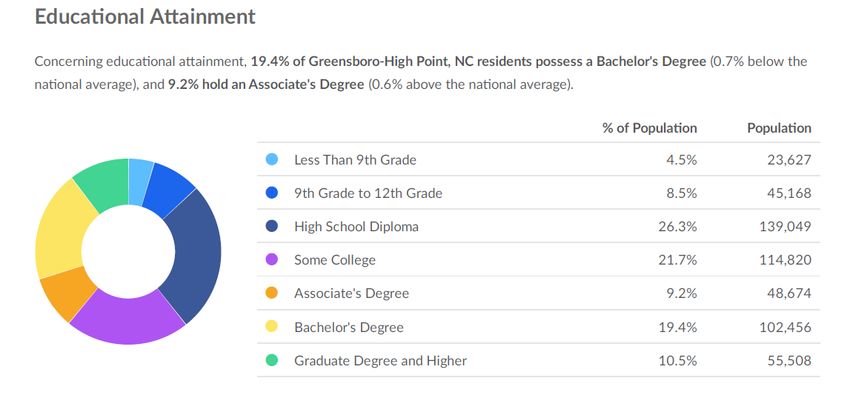
Melissa Korn and Andrea Fuller, July 8, 2021
                                               7
2. NEW COMPETITORS

                     8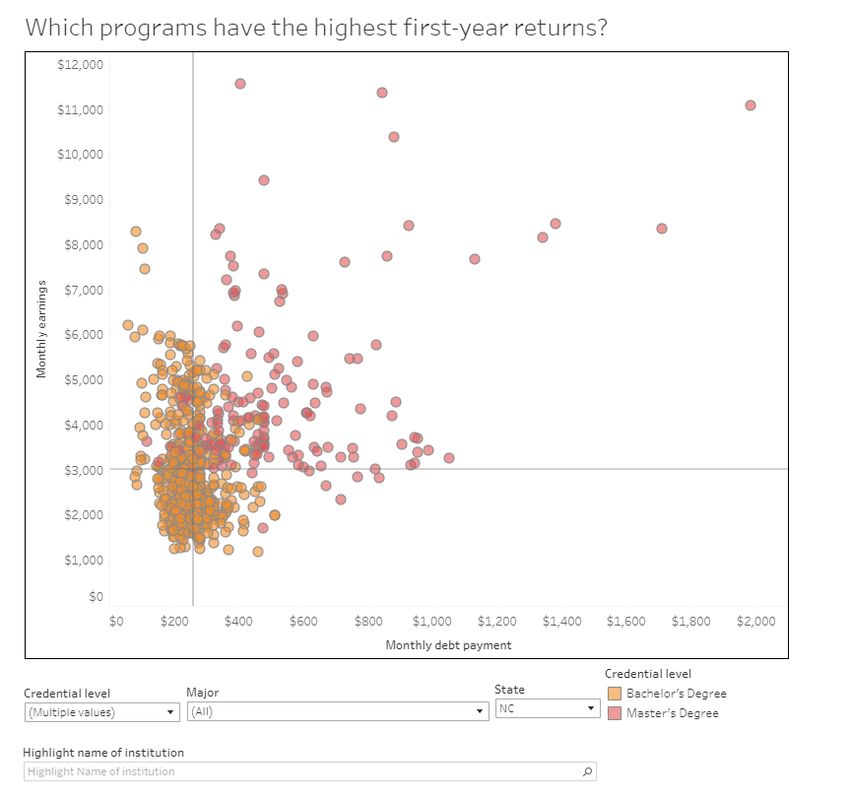
New Competitors

          Gates Bryant, Tyton Partners
          UNC Board of Governors, January 2021   9
New Alternatives

           Gates Bryant, Tyton Partners           10
           UNC Board of Governors, January 2021
3. DEMOGRAPHIC CHANGE
11Demographic Slowdown
Statewide, the rate of growth of 18- to 24-year-olds over the past 10 years was slightly higher
(10.79%) than the predicted rate over the next 10 years (7.89%). However, the growth rate from
2029 to 2039 is predicted to slow dramatically (0.9%).
Number of People in North Carolina 18 to 24 Years Old
1,200,000
1,150,000
1,100,000
1,050,000
1,000,000
950,000
900,000
850,000
800,000
750,000
700,000
2004
2009
2014
2000
2001
2002
2003
2005
2006
2007
2008
2010
2011
2012
2013
2015
2016
2017
2018
2019
2020
2021
2022
2023
2024
2025
2026
2027
2028
2029
2030
2031
2032
2033
2034
2035
2036
2037
2038
2039
Growth in 18–24-year-olds from:
2000-2009 2009 to 2019 2019 to 2029 2029 to 2039
16.0% 10.8% 7.9% 0.9%
12
Source: NC OSBMDemographic Slowdown
North Carolina Public & Private High School Graduates
130,000
120,000
110,000
100,000
90,000
80,000
70,000
60,000
2000
2002
2004
2006
2008
2010
2012
2014
2016
2018
2020
2022
2024
2026
2028
2030
2032
2034
2036
The growth in High School Graduates from:
2000-2007 2007 to 2017 2017 to 2027 2027 to 2037
32.18% 27.54% 1.54% -2.97%
Source: WICHE 13The recent past: Percent change in
18-24 year olds from 2009 to 2019
UNC
Greensboro
UNC
Wilmington
Source: NC OSBMRegional look: Percent Change in 18-24-year-olds
from 2009-2019
Randolph
15The next ten years: Percent change in
18-24 year olds from 2019-2029
UNC
Greensboro
UNC
Wilmington
Source: NC OSBMRegional look: Percent Change in
18-24-year-olds from 2019-2029
17The following ten years: Percent change
in 18-24 year olds from 2029 to 2039
UNC
Greensboro
UNC
Wilmington
Source: NC OSBMRegional look: Percent Change in 18-24-year-
olds from 2029-2039
19~18% of in-state enrollment came from counties where the number of 18-24
year-olds is projected to decline between 2019-2039
Proportion of In-state Students Coming from Counties with Declining
Number of 18-24 Year Olds
Undergrad Grad and Undergrad
ECSU 64.72% ECSU 64.73%
UNCP 42.19% UNCP 40.61%
WCU 27.75% WCU 26.43%
ASU 23.26% ASU 23.58%
ECU 21.99% ECU 21.38%
WSSU 20.34% WSSU 19.97%
UNC SYSTEM 19.03% UNCG 18.28%
UNCG 18.99% UNC SYSTEM 18.04%
FSU 17.36% FSU 16.59%
NCCU 17.08% NCCU 16.26%
NCA&T 16.44% NCA&T 16.19%
UNCW 15.95% UNCW 15.63%
UNC-CH 14.27% UNCA 13.51%
NCSU 13.89% UNCC 12.93%
UNCA 13.56% NCSU 12.63%
UNCC 13.55% UNC-CH 11.93%
UNCA 10.93% UNCSA 11.21%
20UNC is Reliant on Traditional-age Students
Fall 2020 Enrollments by Student Level and Characteristics
250,000
45,698
Grad 12.7% of
10.3% of
200,000 undergrads
undergrad FTE
Part-
21,173 25 or
time 23,604 25 or
Transfer older 18,272
older
57,313
150,000 UG
Under Under
100,000 First- Full-
185,783 25 162,179 25 158,070
Time 128,470 time 164,610
50,000
0
Grad/Undergrad Transfer/First-time Full-Time/Part-time Under 25/25 or Older Under 25/25 or Older (FTE)
21Need to update NCA&T Strengths and enrollment
Strengths: Potential Areas of Focus
• Strong enrollment growth • On-time completion (first-time
reflects strong brand and students)
reputation • Transfer student success
• Large gains in student • Expand online offerings?
success and critical
workforce degrees
• Growth in research portfolio
• National leader in STEM
credentials
22NEW MARKETS
23Projected Employment Growth in NC By
Minimum Education Required for Entry
Minimum Proj. Proj. Percent Annual Average
Education Employment Change Growth Annual
Requirement
Employment, Openings
2028
2028
HS Diploma 3,187,773 62.6% 4.45% 0.44% 423,404
(or equivalent)
Associate's 582,696 11.4% 8.06% 0.78% 60,678
Degree,
postsecondary
Non-degree
award or
some college
Bachelor's 1,112,549 21.8% 10.04% 0.96% 98,640
Degree
Master's 211,141 4.1% 11.38% 1.08% 15,318
Doctoral or
professional
degree
Source: NC Department of Commerce 2018-2028 Long Term Employment Projections
24Job Requirements vs. Educational Attainment
(Greensboro-High Point MSA)
25
EMSI Q2 2021 DatasetEducational Attainment: Greensboro-High Point
MSA
26
EMSI Q2 2021 DatasetEducational Attainment by County
(25 or Older)
Guilford County Forsyth County
Education Level Total % of Total Total Number % of Total
Number in County in Group County
Group Population Population
High School (GED 83,016 15.6% 62,094 16.2%
& Diploma)
Some College, No 74,879 13.9% 52,132 13.6%
Degree
Associate's 27,771 5.2% 20,012 5.2%
Degree
Bachelor's Degree 77,709 14.5% 52,053 13.6%
Graduate Degree 42,647 7.9% 30,929 8.1%
Total County Populations (2019):
Guilford: 537,174
Forsyth: 382,295
Source: NC OSBM Educational Attainment 2019 27Adult Students:
Much Less Likely to Enroll Full-time
Proportion Enrolled Full-Time, By Age
100.0% 95.4% 95.4% 95.4% 95.1% 94.9% 93.9%
90.0%
80.0%
70.0%
60.0% 56.3% 55.1% 54.0% 54.0% 53.4% 51.9%
50.0%
40.0%
30.0%
20.0%
10.0%
0.0%
Fall 2015 Fall 2016 Fall 2017 Fall 2018 Fall 2019 Fall 2020
Under 25 25 and Older
28Adult Students:
Bring in More Transfer Credits
Average Number of Credits Brought in at Transfer
(By Age at Transfer, Fall 2019)
90
80
70
60
50
40
30
20
10
0
ASU ECU ECSU FSU NC A&T NCCU NCSU UNCA UNC-CH UNCC UNCG UNCP UNCW UNCSA WCU WSSU
Under 25 25 and Older
29Adult Students:
Much More Likely to Enroll Exclusively Online/Distance
Undergraduate Enrollment Patterns
(Exclusively Distance, Exclusively Face-to-Face, Blended)
25 or
47.6% 33.6% 18.8%
over
Under
65.0% 31.9%
25
3.1%
0% 10% 20% 30% 40% 50% 60% 70% 80% 90% 100%
Exclusively DE Exclusively F2F Blended
30NEW MODELS
31Reaching Adult Learners
1. Online degree programs
2. Credit for prior learning
3. Year-round, flexible schedules
4. Employer partnerships/Work-based learning
5. “Credential as you Go”
32How We Serve: Online Degree Programs
Total Number of
Total Number of % of Degrees
Programs Exclusively
Degree Programs Exclusively Online
Online
Bachelor’s 908 108 11.8%
Master’s 655 209 31.4%
Doctoral
23 6 26.1%
Professional Practice
Doctoral
206 9 4.4%
Research
System-level 1,792 332 18.5%
Source: UNC System API 33Online Enrollment Varies Across Campuses
Undergrad Distance Education Enrollment Across UNC
(Fall 2019)
UNCSA
UNC-CH
UNCA
ASU
UNCC
NC A&T
WCU
ECSU
NCCU
ECU
NCSU
UNCW
UNCG
UNCP
WSSU
FSU 30.4% 31.2%
0.0% 10.0% 20.0% 30.0% 40.0% 50.0% 60.0% 70.0% 80.0% 90.0% 100.0%
Exclusively DE Both DE and Face-to-Face Exclusively Face-to-Face
34Online learning market for adults
is increasingly competitive
• “Mega-universities”:
o Southern New Hampshire
o Arizona State University
o University of Maryland-
Global Campus
• Acquisitions:
o UMass acquires Brandman
o University of Arizona acquires
Ashford from Zovio
o Purdue Global (Kaplan)
35Online learning market for adults
is increasingly competitive
Online Enrollment of North Carolinians, Fall 2019
Liberty University
Strayer University
East Carolina University
Fayetteville Technical Community College
Wake Technical Community College
Southern New Hampshire University
Western Governors University
Central Piedmont Community College
University of North Carolina at Wilmington
University of Phoenix
American Public University System
Lenoir Community College
North Carolina State University
Guilford Technical Community College
Western Carolina University
Grand Canyon University
Gaston College
Capella University
Nash Community College
Penn Foster College
University of North Carolina at Charlotte
0
1000
2000
3000
4000
5000
6000
7000
8000
36Competition Extends to Online Graduate Programs
Online programs relax constraints on size (and selectivity)
“Micro-credentials”:
• Coursera “MasterTrack®” Certificates and
edX Micro-masters
• Portions of Master’s programs at elite
universities that have been split into
online modules. Students earn a high-
quality university-issued career credential
at a low price in flexible format.
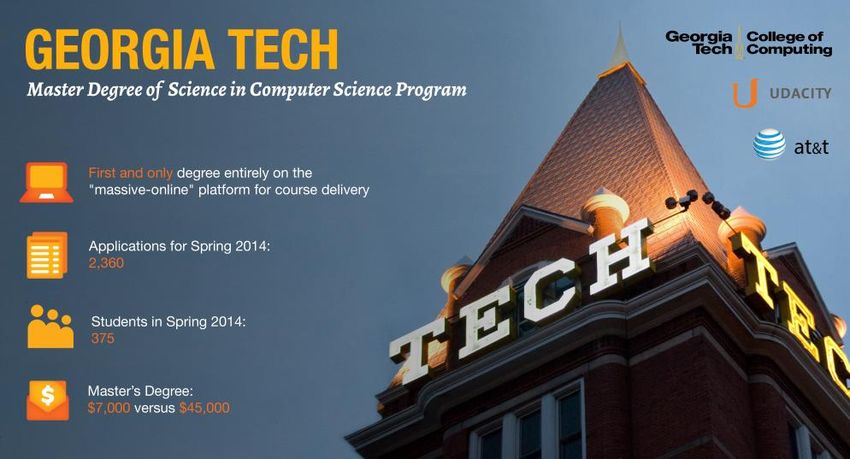
• ~$7,000 online Master’s in computer
science.
• Same curriculum, instructors and
assignments
• 10x as many students served.
37Credit for Prior Learning
• A study by the Council for Adult and Experiential Learning (CAEL)
found that students who received credit for prior learning saved
between two and ten months in time to degree.
• Since 2016, at least 19 states have developed policies that allow
students to earn college credit for skills and knowledge gained
outside the classroom.
• UNC System Efforts:
o Advanced Placement Exams: All UNC System institutions now accept AP scores of 3
or higher, and the System also has credit acceptance policies in place for
International Baccalaureate (IB) and Cambridge programs.
o Credit for Military Training: In collaboration with NCCCS, the UNC System developed
a process to evaluate military training and education for academic credit, including
nursing, allied health, business, English and communications, humanities and foreign
language, and education.
•
38Flexible Schedules
D Term 2021
Term Start Date End of Term
Bachelor of Science in Health Track D February 3 March 16
Administration February Term
Track D March March 24 May 4
Term
Track D May May 5 June 15
Term
Track D June June 23 August 3
“The average Purdue Global military Term
graduate is awarded 54% of the Track D August August 4 Sept. 14
credits needed for an associate’s Term
and 45% of the credits needed for a
bachelor’s.*” Track D Sept. Sept. 22 Nov. 2
Term
Track D Nov. Nov. 3 Dec. 14
Term 39Employer Partnerships
New employer-university partnerships
New organizations that link
employers and universities to
leverage employer tuition
benefits to train employees
40Employer Partnerships
“Nearly 100 degree options
available at ten universities as
part of the brand's debt-free
degree program.”
https://one.walmart.com/content/usone/en_us/company/news/popular-
content/education-articles/unlock-the-future--introducing-live-better-u.html 41
https://newsroom.chipotle.com/2021-04-08-Chipotle-To-Offer-Free-Degrees-In-Agriculture-
Culinary-And-Hospitality-To-Employees“Credential as You Go”
“Certificates First”:
Students pursuing a BA select three certificates to
“build” their degree. Students completing certificates
early-on in their program had higher retention rates.
Microbachelors:
“With MicroBachelors programs, start with the content
that matters most to you, online at your own pace. Earn
a certificate with each one to show off your new
achievement, knowing that you've developed skills that
companies actually hire for. “
Courses transfer to partner universities for credit.
42Questions for Discussion
• What strategies should A&T consider in light of
demographic shifts ahead?
• What does A&T aspire to be known for in 2030?
• What should A&T stop doing (if anything), and what
should A&T expand or create?
• Should A&T aspire to grow online programming? Adult
learners?
• What role for employers?
• How can the System help?
43QUESTIONS? CONNECT www.northcarolina.edu uncsystem @UNC_system @UNC_system
You can also read


