Virginia COVID-19 Surveillance Data Update - February 3, 2022
←
→
Page content transcription
If your browser does not render page correctly, please read the page content below
Virginia
COVID-19 Surveillance Data
         Update

        February 3, 2022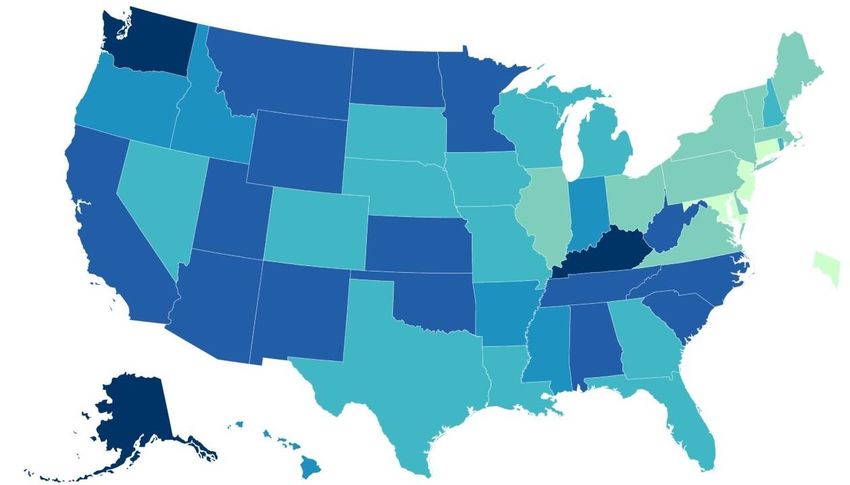
National: Weekly COVID-19 Case Rate
                                                                                                                                     Updated 2/2/22

                                                                                                                             Cases in the Last 7
                  US COVID-19: 7-Day Case Rate per 100,000, by State/Territory                                                    Days
                                                                                                                            Per 100k Population

                                                                                                          Virginia            699.6 (-28.2%)

                                                                                                            U.S.              941.1 (-29.9%)

                                                                                                           Alaska            2,103.5 (-29.6%)

                                                                                                        Washington           1,791.7 (-23.0%)

                                                                                                         Kentucky            1,690.1 (-11.6%)

                                                                                                                   Our Neighbors

                                                                                                           Rates Higher than Virginia
                                                                                                        North Carolina, 1,174.5 (-20.9%)
                                                                                                         West Virginia, 1,367.4 (-24.1%)
                                                                                                          Tennessee 1,361.7 (-22.8%)
                                                                                                          Kentucky, 1,690.1 (-11.6%)

                                                                                                            Rates Lower than Virginia:
                                                                                                       District of Columbia, 331.3 (-23.0%)
                                                                                                            Maryland, 280.6 (-45.8%)

Source CDC COVID Data Tracker Please note rate change comparisons are from the previous week’s data.                                                  2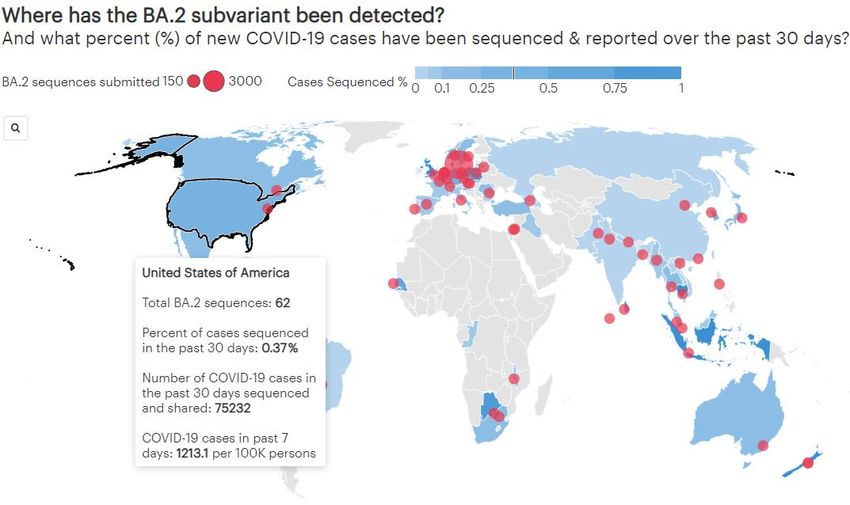
National: Cases, Hospitalizations, and Deaths                         Updated 2/2/22

                                                   Compared to last week, cases
                                                   decreased to 446,355 (7-day
                                                   MA) per day (-35.9%)

                                                   Hospitalizations decreased
                                                   to 17,133 (7-day MA) per day
                                                   (-14.2%)
                                                   Deaths increased to 2,287 (7-
                                                   day MA) per day (+4.6%)

Source: CDC COVID Data Tracker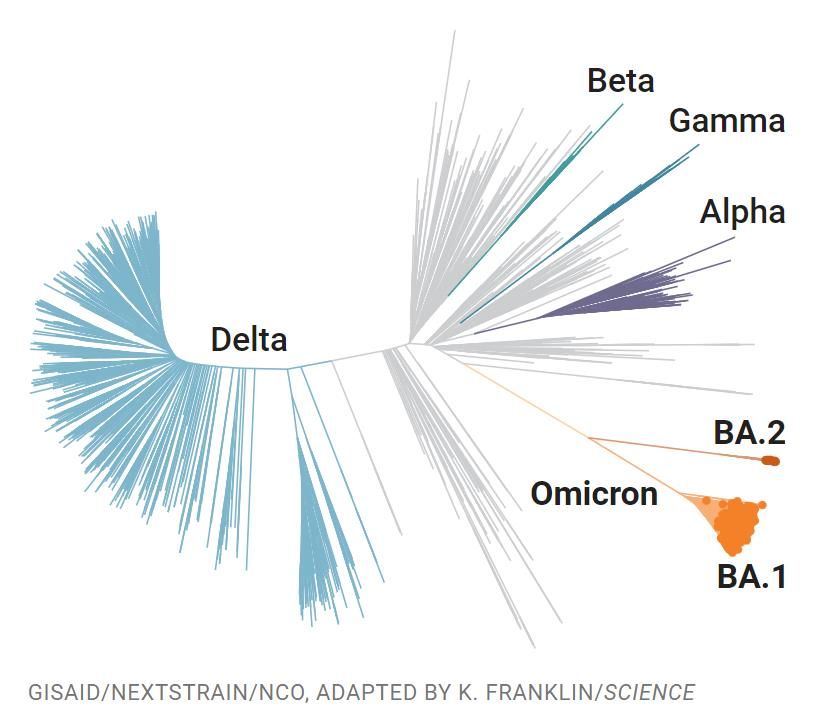
Early U.K. Data Show Similar Vaccine Effectiveness Against Omicron Variant BA.1 and BA.2
    Boosters Make A Substantial Difference                                                                                                                                             Updated 1/31/22

       •      U.K. Health Security Agency measured vaccine effectiveness against symptomatic disease following BA.2 infection in a test-negative
              case control design, as compared to the Omicron BA.1 sub-lineage
       •      Key Takeaway: Vaccine effectiveness against symptomatic disease was similar for BA.1 and BA.2 of Omicron.
       •      After 2 doses, effectiveness was 9% (7-10%) and 13% (26-40%) respectively for BA.1 and BA.2, after 25+ weeks. This increased to
              63% (63-64%) for BA.1 and 70% (58-79%) for BA.2 at 2 weeks following a booster

                 SARS-CoV-2 Evolutionary Tree

Source: COVID-19 vaccine surveillance report - week 4 (publishing.service.gov.uk); Sudden rise of more transmissible form of Omicron catches scientists by surprise | Science | AAAS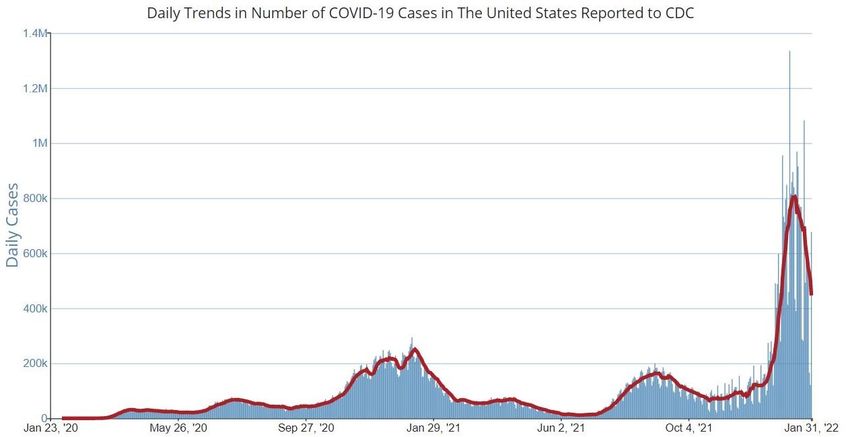
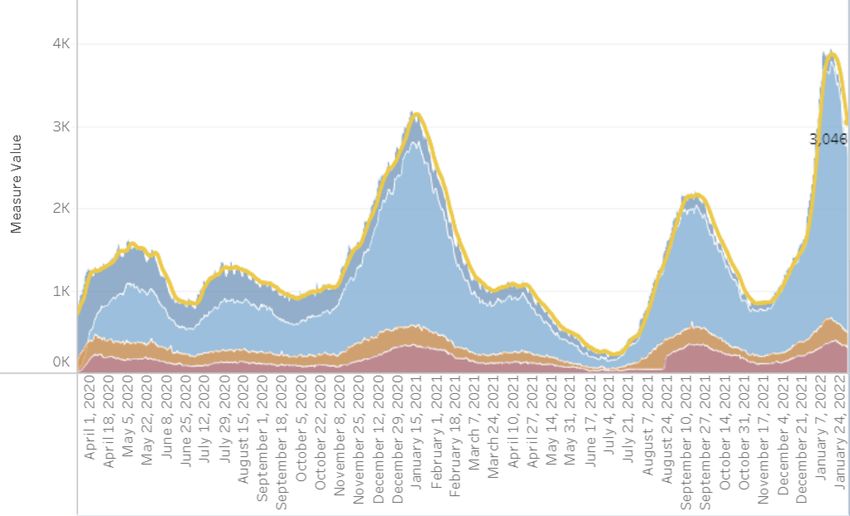
Virginia: Cases, Hospitalizations, and Deaths                                                                                                                            Updated 2/2/22

           Cases by Date of Symptom Onset, Past 13 weeks                                                       Compared to last week, cases decreased to
                                                                                                               7,895 (7-day MA) from 11,891 per day (-33.6%)
                                                                                                               Hospitalizations decreased to 3,046 per day
                                                                                                               (-17.6%)
                                                                                                               Deaths decreased to 43 per day (-48%)

                                                                                                              Cases by Date Reported, All Reporting Timeline

                                                    Gray shaded area illness may not have been reported yet

VDH Death's trend is based upon Date of Death (as of 1/29)
Source: Cases – Coronavirus (virginia.gov), Cases and Deaths - Coronavirus (virginia.gov), VHHA Hospitalizations – Coronavirus (virginia.gov), Data represent a 7-day moving average         5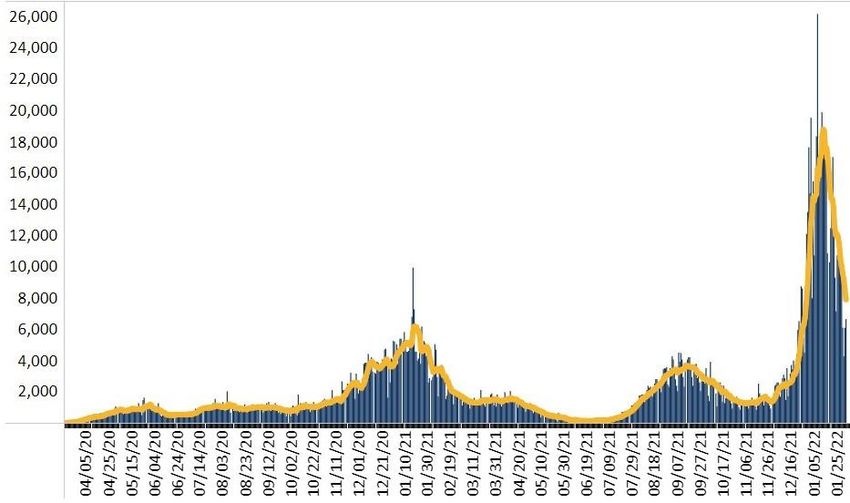
Virginia Hospitalization Trends                                                                                 Updated 2/2/22

                                                   COVID-19 in Virginia Hospitals

                                                                                    •   Compared to last week
                                                                                        hospitalizations decreased to
                                                                                        3,046 (7-day MA) from 3,639 (-16%)

                                                                                    •   Compared to last week. ICU
                                                                                        hospitalizations have decreased to
                                                                                        506 from 588 (-14%)

                                                                                    •   321 patients are currently on
                                                                                        ventilator support (-11%)

Source: VHHA Hospitalizations - Coronavirus (virginia.gov)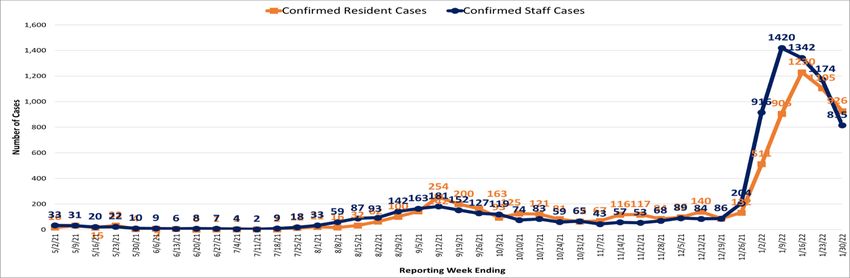
COVID-19 Burden in Virginia LTCFs                                                                                                          Questions can be directed to: hai@vdh.virginia.gov                                                  Updated 2/1/2022

Key Trends                                                                                                                                  Number and Region of LTCF COVID-19 Outbreaks by Date VDH
                                                                                                                                            Notified
• There were 220 LTCF COVID-19 outbreaks reported in the past 30 days: 70 in Eastern,
  46 in Central, 45 in Northwest, 33 in Northern, and 26 in Southwest (see figure top right).
• The number of reported staff cases has declined in the past couple of weeks. The
  number of reported resident cases has continued to decline from the previous reporting
  week (see figure bottom right).
   • For the reporting week ending January 30, 2022, 926 resident and 815 staff cases
     were reported to NHSN. Data for this reporting week are preliminary.
• For reporting week ending January 23, 2022, data reported by 283 nursing homes
  showed 89% of residents were fully vaccinated; data reported by 283 nursing homes
  showed 91% of staff were fully vaccinated (see figures bottom left).
   • Of the nursing home residents eligible to receive an additional dose or booster, 74%
     have received an additional dose or booster of COVID-19 vaccine.
   • Of the nursing home healthcare personnel eligible to receive an additional dose or
     booster, 42% have received an additional dose or booster of COVID-19 vaccine.
                                                                                                                                             Outbreaks reported from nursing homes, assisted living facilities, and multicare facilities to VDH with a confirmed or suspected
                                                                                                                                             etiologic agent of SARS-CoV-2. Data are from the Virginia Outbreak Surveillance System as of 01/31/2022 and are subject to change.
      COVID-19 Booster Vaccination in Virginia Nursing Homes
                  Nursing Home Residents                                                             Nursing Home Staff
                                                                                                                                            Nursing Home Resident and Staff COVID-19 Cases

Data were reported by 286 Virginia nursing homes into the National Healthcare Safety Network (NHSN) as of 2/01/2022 and are subject to
change, including booster eligibility per updated vaccine guidance. In Virginia, 283 nursing homes reported resident vaccination data for
reporting week ending 1/23/2022; 283 nursing homes reported staff vaccination data for reporting week ending 1/23/2022. For staff type
definitions, refer to NHSN Table of Instructions.                                                                                            Data are from NHSN as of 2/01/2022 and are subject to change. For reporting information,
                                                                                                                                             please refer to the NHSN data collection forms: residents, staff.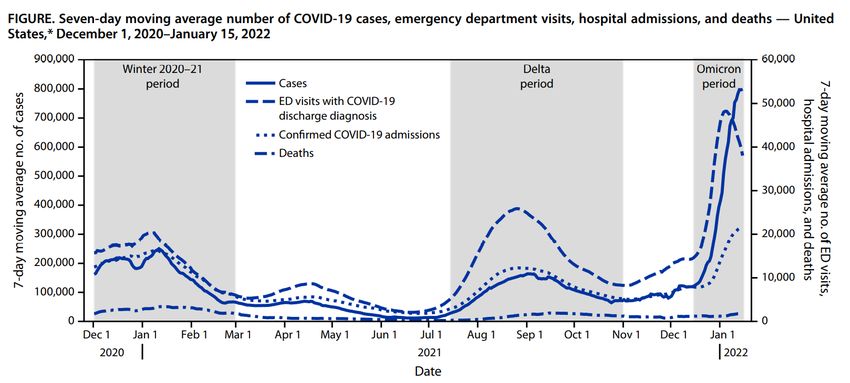
Virginia: Regional Metric Summary                                                                                                                         Updated 2/1/22

                                                                                     Metrics date: 1/30/2022

                                       Central                    Eastern              Far Southwest           Near Southwest      Northern              Northwest

     New cases per
     100k within the                1,049.8                       713.4                   1,489.6                  945.6             513.0                 824.0
     last 7 days

     % Positivity 7-day
     moving average                    25.9%                      32.3%                    39.5%                   32.1%             15.5%                 27.7%

     COVID-like ED visits
     rate per 100k                     24.0                        18.5                        35.0                 28.4               7.8                  18.2

                                                                                                        Symbol   Trend
                              Burden          Level 0   Level 1    Level 2   Level 3    Level 4                                 Please note: the methods used this
                                                                                                                 Increasing     week have changed slightly; data is now
                              New Cases        100

                              % Positivity       10                     Decreasing     compared from Sunday to Sunday
                              CLI ED Visits      6                                    instead of Wednesday to Wednesday
                                                                                                                 Fluctuating

Source: Region Metrics – Coronavirus
*Data represents a 7-day moving average, trends compared to 1 week ago comparing end of week totals from Sunday to Sunday                                                     8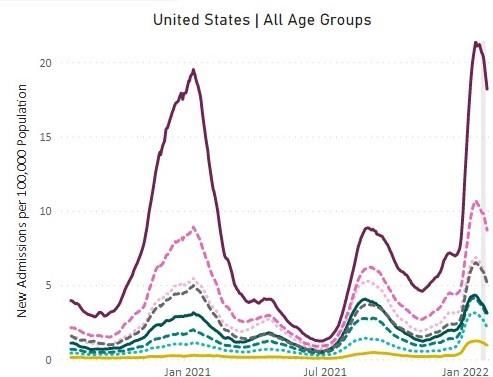
Literature Review: Comparing Omicron and Delta Time Periods                                                                                                  Updated 1/31/22

 Trends in Disease Severity and Health Care Utilization During the Early Omicron Variant Period Compared with Previous SARS-CoV-2 High Transmission Periods -
 United States, December 2020–January 2022| CDC: January 28, 2022
 Summary: A study analyzing disease severity of Omicron compared to other high transmission periods by evaluating severity indicators: length of stay, ICU admissions, and
 death.
 Key Findings: COVID-19 disease severity appears to be lower during the Omicron period than during previous periods of high transmission; deaths, ICU bed use, and
 ventilation were lower during Omicron than previous periods. However, there was a significantly higher volume of ED visits and hospitalizations (3.4x – 7.2x higher)
 during Omicron, which caused a strain on the US health care system.

 Effectiveness of a Third Dose of mRNA Vaccines Against COVID-19–Associated Emergency Department and Urgent Care Encounters and Hospitalizations Among Adults
 During Periods of Delta and Omicron Variant Predominance August 2021–January 2022 | CDC: January 28, 2022
 Summary: A study evaluating effectiveness of a booster dose of mRNA against ED visits and hospitalizations among adults during the Delta and Omicron waves.
 Key Findings: During both Delta- and Omicron-predominant periods, receipt of a third vaccine dose was highly effective at preventing COVID-19–associated emergency
 department and urgent care encounters by 94% for Delta and 82% for Omicron as well as preventing COVID-19–associated hospitalizations by 94% for Delta and 90% for
 Omicron respectively.
Virginia: Vaccination by Age Groups                                                                          Updated 2/2/22

     Virginia Vaccination by Age
     ✓ 74.3% (+0.5%) of the Eligible (5+) Population and 70.0% (+2.8%) of the Total Population are Fully Vaccinated
     ✓ 54.4% of the Eligible Population and 30.3% (+2.3%) of Total Population Vaccinated with 3rd Dose/Booster
     ✓ 39.2% (+11%) of the Total Population is “Up-to-Date” with their Vaccinations
     ✓ 89.7% (+0.3%) of the Adult (18+) Population and 54.0% (+1.7%) of 5 to 17 year olds Vaccinated with at Least
       One Dose
     • Green percent represents percent increase from two weeks prior

Source: COVID-19 in Virginia: Vaccine Summary, Keep Virginia Safe Tournament | Metaculus                                10
Virginia: Vaccine Demand by Dose Number Updated 2/2/22
First Dose, Second Dose, and Booster Administrations Have Decreased
• Over the past 2 weeks, Third Dose/Booster Administrations have decreased by nearly 80%
• First and Second Dose Administrations have plateaued at an all-time-low
Federal doses not included in this number
Source: COVID-19 Vaccine Summary – Coronavirus (virginia.gov) 11Virginia: Vaccination by Race/Ethnicity and Age Updated 2/2/22
Source: COVID-19 Vaccine Summary – Coronavirus (virginia.gov)
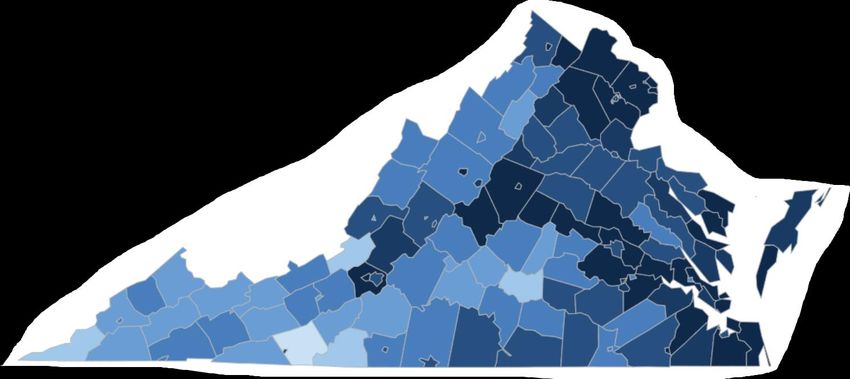
12Virginia: Vaccination across the Commonwealth by Geography Updated 2/2/22
Percent of the Total Population with at Least One Dose by First Dose Vaccination Rate by
Locality Region for Total Population
1st Dose
Region Name
Vaccination
Central 68.2%
Eastern 72.3%
Northern 82.5%
Northwest 65.3%
Southwest 57.3%
• 6 out of 133 Localities have a
first dose vaccination rate
below 50%
• 36 out of 133 Localities have a
first dose vaccination rate
2013 SRHP Isserman Classification 5 to 11 12 to 17 16 to 17 18 to 30 31 to 50 51 to 64 65+ Grand Total above 70%
Mixed Urban 41% 72% 76% 74% 73% 85% 85% 65%
Urban 38% 74% 80% 67% 78% 86% 92% 75% • There is a disparity across
Mixed Rural 25% 52% 58% 58% 64% 75% 81% 61% Urban and Rural areas by Age
Rural 17% 44% 49% 52% 58% 71% 90% 75% Groups, with Rural
Grand Total 34% 66% 71% 65% 72% 82% 88% 72% Adolescents the Lowest
Federal doses not included in this number Vaccinated group
Source: COVID-19 Vaccine Summary – Coronavirus (virginia.gov) 13Virginia and Neighbors: Vaccination Rates Updated 2/2/22
At Least One Dose
> 80%
70-79.9% At Least One Fully
60-69.9% Dose* Vaccinated*
50-59.9% Nationwide 75.4% (+0.4%) 63.8% (+1.3%)
0.1-49.9% D.C. 93.3% (+2.2%) 70.1% (+1.9%)
0%
Kentucky 64.7% (+1.7%) 55.7% (+1.3%)
Maryland 83.7% (+1.6%) 72.7% (+1.4%)
North Carolina 80.9% (+2.1%) 58.5% (+1.6%)
Tennessee 60.7% (+1.7%) 52.8% (+1.5%)
Virginia** 83.2% (+3.0%) 70.6% (+2.3%)
West Virginia 63.6% (+1.3%) 56.2% (+1.1%)
*Total population, includes out-of-state
vaccinations
**Differs from previous slide because all
vaccination sources (e.g., federal) are included
*** Green percent represents percent increase
from one weeks prior
Source: https://covid.cdc.gov/covid-data-tracker/#vaccinations
14You can also read


