The World Atlas of Last Interglacial Shorelines (version 1.0)
←
→
Page content transcription
If your browser does not render page correctly, please read the page content below
Earth Syst. Sci. Data, 15, 1–23, 2023
https://doi.org/10.5194/essd-15-1-2023
© Author(s) 2023. This work is distributed under
the Creative Commons Attribution 4.0 License.
The World Atlas of Last Interglacial
Shorelines (version 1.0)
Alessio Rovere1,2 , Deirdre D. Ryan3 , Matteo Vacchi3,4 , Andrea Dutton5 , Alexander R. Simms6 , and
Colin V. Murray-Wallace7
1 DAIS, Ca’ Foscari University of Venice, Venice, Italy
2 MARUM, Center for Marine Environmental Sciences, University of Bremen, Bremen, Germany
3 Department of Earth Sciences, University of Pisa, Pisa, Italy
4 CIRSEC – Centro Interdipartimentale di Ricerca per lo Studio degli Effetti del Cambiamento climatico
dell’Università di Pisa, Pisa, Italy
5 Department of Geoscience, University of Wisconsin-Madison, Madison, Wisconsin, USA
6 Department of Earth Science, University of California Santa Barbara, Santa Barbara, California, USA
7 School of Earth, Atmospheric and Life Sciences, University of Wollongong, Wollongong, NSW, Australia
Correspondence: Alessio Rovere (alessio.rovere@unive.it)
Received: 8 June 2022 – Discussion started: 21 June 2022
Revised: 27 November 2022 – Accepted: 1 December 2022 – Published: 3 January 2023
Abstract. This paper presents version 1.0 of the World Atlas of Last Interglacial Shorelines (WALIS), a global
database of sea-level proxies and samples dated to marine isotope stage 5 (∼ 80 to 130 ka). The database
includes a series of datasets compiled in the framework of a special issue published in this journal (https:
//essd.copernicus.org/articles/special_issue1055.html, last access: 15 December 2022). This paper collates the
individual contributions (archived in a Zenodo community at https://zenodo.org/communities/walis_database/,
last access: 15 December 2022) into an open-access, standalone database (Rovere et al., 2022, https://doi.org/
10.5281/zenodo.7348242). The release of WALIS 1.0 includes complete documentation and scripts to down-
load, analyze, and visualize the data (https://alerovere.github.io/WALIS/, last access: 15 December 2022). The
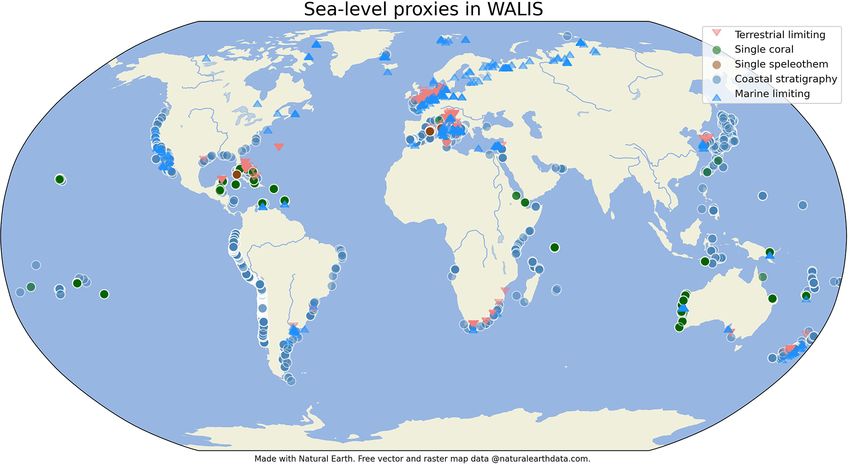
database contains 4545 sea-level proxies (e.g., marine terraces or fossil beach deposits), 4110 dated samples
(e.g., corals dated with U-series), and 280 other time constraints (e.g., biostratigraphic constraints or tephra
layers) interconnected with several tables containing accessory data and metadata. By creating a centralized
database of sea-level proxy data for the Last Interglacial, the WALIS database will be a valuable resource to
the broader paleoclimate community to facilitate data–model integration and intercomparisons, assessments of
sea-level reconstructions between different studies and different regions, as well as comparisons between past
sea-level history and other paleoclimate proxy data.
1 Introduction evolved into a standalone discipline at the crossroads be-
tween geomorphology (measurement and interpretation of
The survey, interpretation, and dating of sea-level index sea-level proxies, e.g., Shennan, 1982), geochemistry (dating
points is an essential tool to assess long-term relative sea- of sea-level proxies, e.g., De Vries and Barendsen, 1954),
level (RSL) changes resulting from the interplay between geophysics (modeling vertical land motions following ice
land motion and global mean sea-level changes. Since the melting, e.g., Peltier, 1974; Farrell and Clark, 1976), and
end of the 18th century, scientists have systematically ob- structural geology (understanding the vertical displacement
served and measured archeological and geological evidence of shoreline features through time, e.g., Chappell et al.,
of RSL changes (Celsius, 1743; Issel, 1883; Forbes, 1829). 1996).
In the 20th century, the observation of past sea-level changes
Published by Copernicus Publications.
2                                              A. Rovere et al.: The World Atlas of Last Interglacial Shorelines (version 1.0)

   The growing knowledge on geological sea-level proxies in       interpreted from sea-level index points corrected for post-
different regions and the emergence of new and more refined       depositional displacement was higher than today. Sea-level
scientific questions on past RSL changes (see overviews           estimates for MIS 5e range from 1 to 5 m (Dyer et al., 2021)
by Murray-Wallace and Woodroffe, 2014, and Gehrels and            to 6–9 m higher than today (Dutton and Lambeck, 2012; Dut-
Shennan, 2015) presents a need to standardize how geolog-         ton et al., 2015). Last Interglacial global mean sea-level esti-
ical sea-level information is both collected and stored. An-      mates have been used as benchmarks for ice models project-
swers to such need were first introduced in a seminal paper       ing future sea-level changes in the face of global warming
by Shennan (1982) and, only a few years later, were explicit      (DeConto et al., 2021). Gilford et al. (2020) highlighted that
in the volume Sea-level research: A manual for the collec-        improving field measurements of MIS 5e sea levels might
tion and evaluation of data (Van de Plassche, 1986). After        help improve the accuracy of future sea-level projections.
these efforts, approaches to standardize Holocene sea-level          Hundreds of studies since the early 1900s have described
proxies were widely accepted by the community working on          the stratigraphy, elevation, and age of Last Interglacial RSL
paleo sea-level changes and have recently been summarized         proxies at thousands of locations. The present undertaking
in an update of the 1986 manual (Shennan et al., 2015).           within this special issue presents a global database report-
   The community working on past RSL changes has often            ing geological sea-level proxies formed during MIS 5. We
organized itself around projects supported by the IGCP (In-       named the database World Atlas of Last Interglacial Shore-
ternational Geoscience Programme, formerly International          lines (WALIS). The name is meant as an homage to the World
Geological Correlation Programme) or focus groups sup-            Atlas of Holocene sea-level changes by Pirazzoli (1991),
ported by the International Union for Quaternary Research         which was the first attempt at making a global compilation
(INQUA). One such group, the “PALeo constraints on SEA            of paleo sea-level data. The database was built by collating
level rise” (PALSEA), founded and currently co-funded by          the individual contributions in the WALIS special issue (pub-
PAGES (Past Global Changes), has contributed to advancing         lished in this journal) into a unique database (WALIS 1.0,
the state of the art on paleo ice sheets and sea levels (Rovere   i.e., version 1.0). Here, we describe the database structure
and Dutton, 2021) in the last decade. Results from PALSEA         and associated tools (e.g., interface for inserting data, analy-
have laid the foundations for improvements in the standard-       sis, and visualization tools). We also summarize the contents
ization of paleo sea-level data encouraging the creation of       of WALIS 1.0 and the main limitations of the database in its
global sea-level databases compiled by experts following          present form.
standardized approaches (Düsterhus et al., 2016). The first
multi-proxy global sea-level database stemming from these
efforts compiled published sea-level index points formed af-      2   Relationship with previous compilations
ter the Last Glacial Maximum (20 ka to present) and pre-
sented as part of a special issue in the journal Quaternary       WALIS is not the first attempt to collect MIS 5 sea-level
Science Reviews (Khan et al., 2019). This standardized com-       index points into a coherent database. Databases compiling
pilation of Holocene sea-level proxies includes data reviewed     single studies of MIS 5 sea-level proxies exist for several re-
by 30 studies (see Table 1 of Khan et al., 2019). It presents     gions and were built to summarize single studies in regional
a total of 5290 sea-level indicators distributed across the       databases (e.g., Ferranti et al., 2006; Ota and Omura, 1991;
globe. The structure used by the database was built upon          Muhs et al., 2003, 2002). These include the work done over
the concepts already explored within a database template that     several decades in one region, nation, or wide geographic
was already widely employed in Holocene sea-level studies         area, often reporting the results of earlier work that are hard
(e.g., Engelhart and Horton, 2012), stemming directly from        to retrieve in digital format. In addition, regional compila-
the early efforts of sea-level data standardization by Shen-      tions are usually done by geoscientists with direct expertise
nan (1982) and Van de Plassche (1986).                            on at least some of the sites reported, which increases the
   While studies of RSL changes for periods older than the        confidence that the data have been screened and standard-
Holocene have a long tradition (De Lamothe, 1911; Issel,          ized with a certain degree of knowledge of local geological
1914; Blanc, 1936), the standardization of reporting for sea-     contexts. In the WALIS ESSD special issue, we tried to main-
level proxies older than 20 ka into databases has lagged. One     tain this advantage by soliciting regional compilations from
significant period of former sea-level changes is the Last In-    authors with direct expertise on each area addressed in the
terglacial (MIS 5, ca. 130–80 ka). The warmest peak of this       database or with expertise with a particular type of indicator
interglacial, MIS 5e (ca. 128–116 ka), is commonly consid-        (e.g., coral sea-level proxies or speleothems) or dating tech-
ered a useful (however imperfect) analog for a future warmer      nique (e.g., U-series).
climate. During MIS 5e, the Earth was slightly warmer than           Within the existing literature, several global databases pre-
pre-industrial time (with global mean atmospheric tempera-        date WALIS 1.0. One of the most comprehensive in terms
tures 1–2 ◦ C above pre-industrial, McKay et al., 2011), prob-    of the sheer number of data points was assembled by Pe-
ably as a consequence of greater insolation at high lati-         doja et al. (2011), later updated by Pedoja et al. (2014). In
tudes. In such a warmer climate, the global mean sea level        parallel, the works of Dutton and Lambeck (2012), Medina-

Earth Syst. Sci. Data, 15, 1–23, 2023                                                 https://doi.org/10.5194/essd-15-1-2023
A. Rovere et al.: The World Atlas of Last Interglacial Shorelines (version 1.0) 3
Elizalde (2013), and Hibbert et al. (2016) contain global alization, data download, and documentation tools (see Fig. 1
compilations of Quaternary U-series data and associated for a schematic representation and Table 1 for links to re-
RSL information. Similarly, scientists working on amino sources). WALIS was structured around the four key types of
acid racemization dating have worked towards a database scientists interacting with a database, described by Düster-
of dated samples compiled within a standardized framework hus et al. (2016). Data creators are scientists who produce
(Wehmiller and Pellerito, 2015). Finally, a global compila- new data, such as sea-level proxies or radiometric dates, and
tion of deposits dated with luminescence exists (Lamothe, publish them in research outputs (e.g., peer-reviewed arti-
2016); however, the published version contains relatively cles or PhD theses). Data compilers review these outputs
little metadata (e.g., region of occurrence, luminescence and include the data in the standardized WALIS format. For
method, sedimentary facies, age, and reference). WALIS 1.0, data compilers are the authors of review pa-
These databases were used as a starting point for WALIS pers included in the ESSD special issue (with a few excep-
1.0. In particular, all the references cited by Pedoja et tions discussed in Sect. 4 “Database contents”). In some in-
al. (2014) were initially added to the “References” table and stances, a data creator may coincide with the data compiler.
subsequently updated and implemented with new ones by the End users do not contribute data but may query and analyze
data compilers working on regional databases within the spe- the database for their research. Database administrators en-
cial issue. Hibbert et al. (2016) were the foundation upon sure that data entered by data compilers meet the minimum
which the U-series coral compilation was done (Chutchar- standards and manage the platform’s administration, includ-
avan and Dutton, 2021a). The global compendium of MIS ing fixing bugs and updates. For WALIS 1.0, the database
5a and MIS 5c data (Thompson and Creveling, 2021b) is administrators are the authors of this paper.
based on an expansion of a previous compilation that was Data compilers can sign up to the interface, which is pub-
included in the form of a table in Creveling et al. (2017). licly available and free of charge (Table 1). The data required
Data from some of the regional databases mentioned above to sign up are a user-selected username and password (the
(e.g., Ferranti et al., 2006; Ota and Omura, 1991) have been latter is encrypted in the private database and deleted in the
re-evaluated and inserted into the WALIS structure (Cerrone public version), a valid email address, name, surname, insti-
et al., 2021b; Tam and Yokoyama, 2021), most often cross- tution, and country. The data compiler must accept a privacy
checking information with the original studies (when avail- policy (that was built with the Privacy Policy Generator of
able). the German Association for Data Protection). Generally, ev-
The key difference between previous compilations and ery WALIS table contains a “Public” field of type integer.
WALIS is that the latter is structured as a relational database For every new data point inserted in WALIS, this field is set
with links between records in different tables. Previously to “0”, which means that the record is not publicly visible and
published databases have, in general, a more straightforward can only be seen, edited, and deleted by the user who inserted
structure than WALIS. For example, the databases of Pe- it. Exceptions to this rule are tables containing positioning
doja et al. (2014) and Ferranti et al. (2006) contain sev- and elevation measurement methods and bibliographic refer-
eral fields describing sea-level index points, including some ences (Fig. 2). Data inserted in these tables are immediately
columns dedicated to the dating methods used and the asso- public and can be seen by all data compilers (and they can
ciated age(s). However, no detailed information is available be deleted only by Admin) to ensure that standard metadata
on the ages themselves (e.g., the minimum fields considered (e.g., survey methods) can be used at large and are not dupli-
necessary to describe a U-series age, as discussed in Dutton cated in the database.
et al., 2017). In WALIS, such data are presented in a ded- All data inserted by a data compiler are embedded within a
icated table and linked to the table containing sea-level in- private MySQL database. This database can be accessed only
formation. Conversely, the fields to describe U-series ages by the administrators, who periodically revise the non-public
are present in the global compilation of coral sea-level in- records and contact the data compiler to inquire whether it
dex points by Hibbert et al. (2016). Instead, those related to is possible to make them public. Upon agreement, the data
sea-level stratigraphic details are limited. Instead, these fields compiler is invited to upload their data to the WALIS Com-
are in WALIS in the “RSL Stratigraphy” table. As described munity in Zenodo (or any other open-access repository) un-
below, all tables in WALIS are linked with one-to-many or der a Creative Commons Attribution (CC BY) license. Alter-
many-to-many relationships. natively, the data compiler is requested to consent to pub-
lish the data in WALIS under this license. At this stage,
public fields are changed to “1” and can only be edited or
3 The WALIS data platform deleted by submitting a data modification or deletion request
to the database administrators via the database interface so
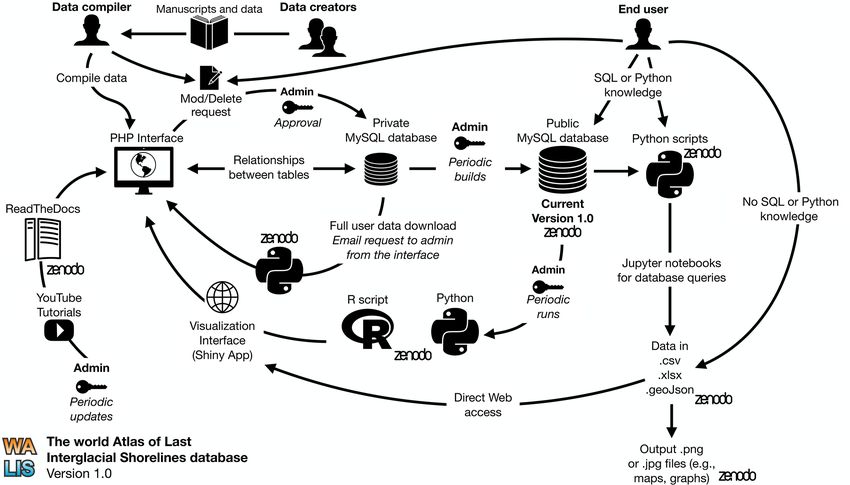
Overall, the WALIS database was built alongside a data plat- that post-publication changes are tracked in future WALIS
form with the same name. Critical parts of the data platform versions.
are two MySQL databases (one private and one public), a All data where the public field is set to “1” are periodically
PHP (Hypertext Preprocessor) interface, and a series of visu- migrated to the public MySQL database, where a general
https://doi.org/10.5194/essd-15-1-2023 Earth Syst. Sci. Data, 15, 1–23, 2023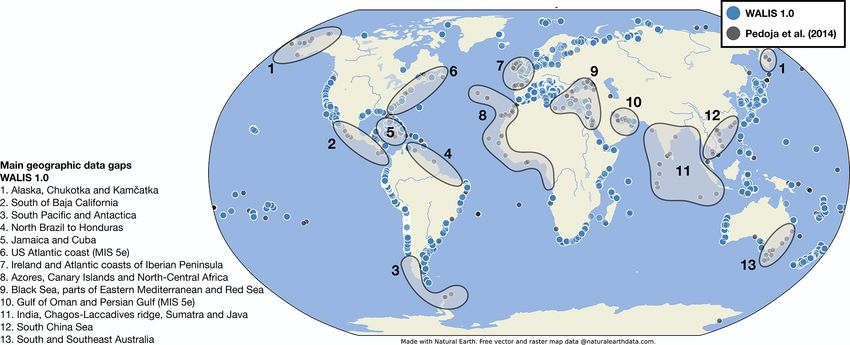
4                                              A. Rovere et al.: The World Atlas of Last Interglacial Shorelines (version 1.0)

user is granted “SELECT” rights. End users can download           technique can be applied to many sites. However, each RSL
this database or perform SQL queries directly on the public       stratigraphy record can be associated with only one elevation
online version (Table 1). For end users familiar with Python,     measurement technique. The relationship between the RSL
a series of Jupyter notebooks can perform simple database         stratigraphy and any table containing dated samples (e.g.,
queries (Table 1). These scripts are also available in GitHub,    amino acid racemization, electron spin resonance, and U-
where they can be forked (i.e., copied and modified without       series) is an example of a many-to-many relationship. Multi-
affecting the original repository) and commented on by any-       ple dated samples can characterize one RSL stratigraphy data
one with a GitHub account. For end users who do not wish          point (e.g., replicates of the same dated material or different
to use SQL or Python, the database is available for download      samples within the same stratigraphic layer).
as a multi-sheet spreadsheet, comma-separated text files, or         It is also possible, under certain conditions, that a single
GeoJson files (Table 1).                                          dated sample can be used within various RSL stratigraphy
   A combination of Python and R scripts is then run period-      records. This can happen when different sites containing sea-
ically by the database administrators on the public MySQL         level index points correlate with a single stratigraphic unit
database. These scripts summarize the data and compile an         dated elsewhere with, for example, U-series. In such cases,
R ShinyApp for data visualization and download (Garzón            the WALIS structure allows connecting one or more sea-level
and Rovere, 2022). Database administrators also update the        index points with one stratigraphic unit but also with one or
database documentation (Rovere et al., 2020) and a series of      more radiometric ages that have been used to assign an age
video tutorials to guide data compilation. The documentation      to that unit. The distance between the sea-level proxy and
files are included in a ReadTheDocs website and are avail-        the closest dated sample is calculated and stored in a column
able via GitHub. Users may either fork the original documen-      of the exported spreadsheet. This kind of many-to-many re-
tation (written in markup language) or suggest improvements       lationship between sea-level proxies and dated samples al-
via the GitHub “issues” function.                                 lows retaining not only the age information for a given sea-
                                                                  level proxy but also information about how that age has been
3.1   The WALIS database
                                                                  established. This is a crucial difference with previous Last
                                                                  Interglacial sea-level databases (Hibbert et al., 2016; Pedoja
WALIS is built as a series of tables embedded in a MySQL          et al., 2014; Ferranti et al., 2006). The relationship between
database. The central concept is that the description of a sin-   samples and sea-level proxies in these databases is always
gle sea-level index point must include data and metadata de-      one-to-one.
scribing its stratigraphy and relationship with the former sea       The links between database tables are shown in Fig. 3.
level and must be tied to a series of tables reporting on dated   One key aspect of WALIS is that the links are not defined in
samples and details on how both samples and index points          MySQL but are managed in the PHP interface. Taking the ex-
have been measured. The techniques used to measure eleva-         amples of the one-to-many and many-to-many relationships
tion (including the vertical datum) and geographic position-      described above, in the RSL stratigraphy, there is an eleva-
ing must relate to sea-level index points and dated samples.      tion measurement technique type integer field, which is filled
Also, studies reporting details on each site, sample, or tech-    via the PHP interface with the corresponding ID in the Ele-
nique used must be referenced where necessary (Fig. 2). The       vation measurement techniques table. Similarly, in the RSL
WALIS database structure (i.e., the mandatory or optional         stratigraphy table, there is a U-series type varchar field (i.e.,
columns that need to be filled when describing a given en-        an indeterminate string length data type) that, upon selection
tity) was drafted by several scientists (coordinated by the au-   in the PHP interface, is filled with the corresponding ID(s) in
thors of this paper), including experts on different subfields    the U-series table as comma-separated values. Unique con-
(e.g., geomorphology, stratigraphy, dating techniques, earth      straints and orphans are managed via the PHP interface, and
modeling). A complete list of tables, fields and associated       all relationships are coded into the Python scripts used to ex-
descriptors is available via the project documentation (Ro-       tract the data (Fig. 1). While we recognize that this makes
vere et al., 2020). An overview of the database in terms of       WALIS an “unorthodox” database from the SQL standpoint,
the number of fields and records contained in each table is       we have found that this is the most effective way to man-
shown in Fig. 2.                                                  age the inter-table relationships’ complexity without affect-
   WALIS has a complex structure, with a series of one-to-        ing the interface’s usability.
many and many-to-many links between tables (Fig. 3). One
example of a one-to-many relationship is the one between the      3.2   The WALIS interface (version 1.8.0)
tables “RSL stratigraphy” (containing the stratigraphic de-
scriptions of sea-level index points) and “Elevation measure-     The interface to the MySQL database was built in PHP 7.3
ment technique” (including details on the techniques used to      using Scriptcase, a rapid application development software.
measure site or sample elevation). Each record in the ele-        The main components of the interface (current version: 1.8.0)
vation measurement technique table can be associated with         are shown in Fig. 4. On the left side, a menu allows navigat-
many RSL stratigraphy data points, as the same measuring          ing the different pages of the application. Windows for data

Earth Syst. Sci. Data, 15, 1–23, 2023                                                  https://doi.org/10.5194/essd-15-1-2023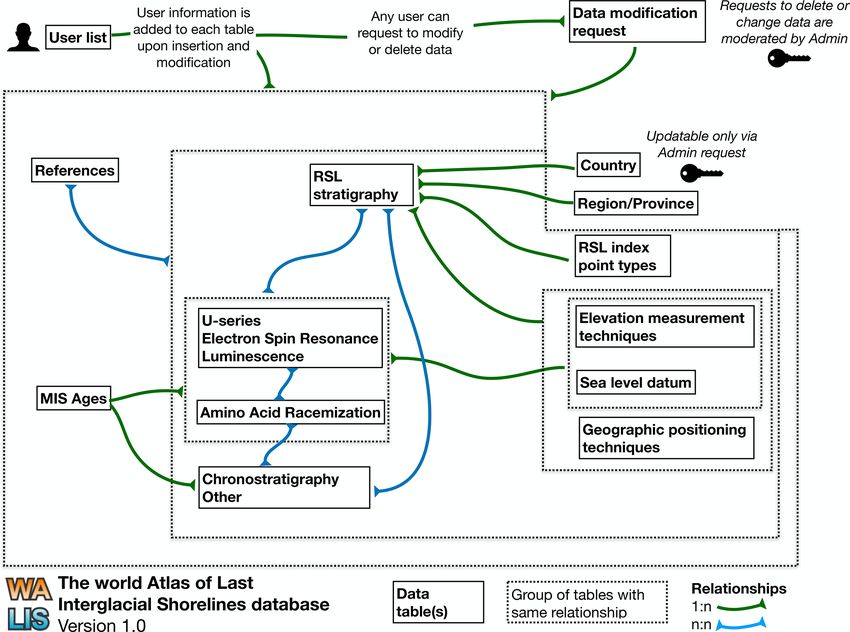
A. Rovere et al.: The World Atlas of Last Interglacial Shorelines (version 1.0)                                                              5

Figure 1. Overview of the WALIS platform, which includes the private and public instances of the database, the PHP data interface, and
scripts in R and Python to query and visualize the data. The “Zenodo” logo indicates that the scripts/data are available in Zenodo (see Table 1
for links).

Figure 2. Summary of the number of columns in each table and the number of records (rows) per table in WALIS 1.0. Photo by Alessio Ro-
vere (2019). Location: Boca Cortalein, Curaçao. In the picture: geologist Ciro Cerrone measuring the elevation of a Pleistocene beach deposit
using real-time kinematic GNSS.

insertion can be browsed in a tab space in the central part               3.3   Data visualization (version 2.0)
of the application. Below the tab space is the main window,
where the active tab is shown. The data insertion is done in-
                                                                          To ensure rapid access to the data in WALIS, we also pre-
side the active tabs in the main window, where a data com-
                                                                          pared a map interface that allows end users to browse the
piler can find the fields to fill and help tips to guide the com-
                                                                          contents of the database (Garzón and Rovere, 2022). This vi-
pilation of the database.
                                                                          sualization interface is built with the R package Shiny and
                                                                          uses a simplified database version exported via a Python
                                                                          script (Table 1). The interface’s main page allows an end user
                                                                          to select data from different filters or geographic queries. The

https://doi.org/10.5194/essd-15-1-2023                                                            Earth Syst. Sci. Data, 15, 1–23, 2023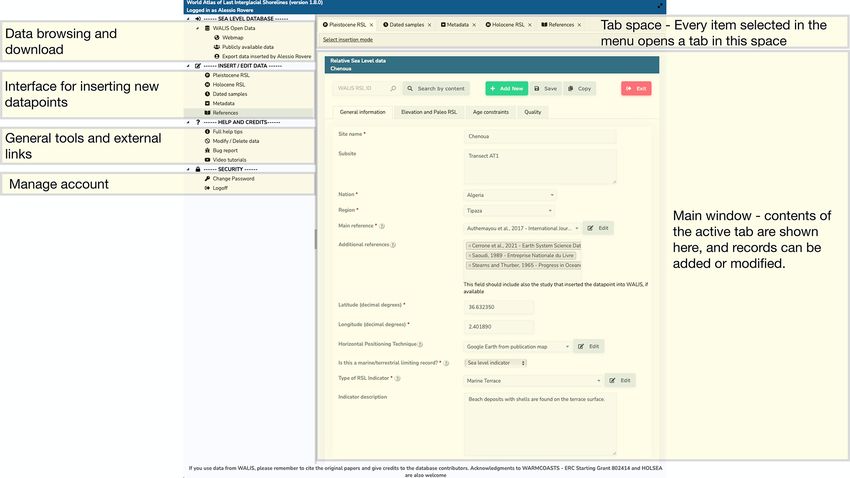
6                                                   A. Rovere et al.: The World Atlas of Last Interglacial Shorelines (version 1.0)

Figure 3. Database structure for WALIS. Note that the relationships among tables are managed via the PHP interface and are, therefore, not
included in the database. Also not included in this scheme are the tables to report Holocene data, which are still in beta testing.

Figure 4. Annotated screenshot of the WALIS PHP interface, version 1.8.0.

Earth Syst. Sci. Data, 15, 1–23, 2023                                                            https://doi.org/10.5194/essd-15-1-2023
A. Rovere et al.: The World Atlas of Last Interglacial Shorelines (version 1.0)                                                  7

chosen data on the first page can be browsed and downloaded         4.1   Sea-level and age data points
in CSV format on the second page of the interface (Fig. 5).
On the third page of the visualization interface, it is possi-      WALIS 1.0 includes 4545 sea-level proxies (Fig. 6). The pa-
ble to run a script implementing a Monte Carlo elaboration          pers listed in Table 2 contain data and metadata standard-
that allows plotting a probability density distribution of RSL      ized from 2130 references, spanning more than one cen-
in space and time, as indicated by the selected indicators. It      tury of published scientific literature. The sea-level proxies
is also possible to download the results of the Monte Carlo         in WALIS 1.0 consist of 3311 sea-level index points from
elaboration for further analysis or plot outside the interface.     coastal sites (containing, for example, fossil beach deposits
Within the visualization interface, it is possible to apply dif-    or marine terraces), for which it is possible to identify a re-
ferent filters to the selected data.                                lationship with the paleo sea level via the “indicative mean-
                                                                    ing” (Shennan et al., 2015). Other points indicate that paleo
3.4    Query and plotting scripts                                   sea level was above (“marine limiting” points, n = 285) or
                                                                    below (“terrestrial limiting” points, n = 410) the measured
With the release of WALIS 1.0, we prepared a repository             stratigraphy. Examples of marine limiting points are fossil
that includes several Python scripts that can be executed           subtidal sands, while terrestrial limiting points are, for ex-
via Jupyter notebooks. The scripts allow querying WALIS             ample, fossil dunes. The database also contains 463 sea-level
by selecting data compilers by name or geographic bound-            index points from fossil corals (most of them compiled by
aries. Then, they connect records via one-to-one and many-          Chutcharavan and Dutton, 2021a), which can be correlated
to-many links and associate database column names with for-         to paleo sea level when there is enough information on paleo
matted labels. After these scripts are run, it is possible to ex-   water depth given. In WALIS are also included 76 phreatic
port the queried data in different formats (CSV, XLSX, Geo-         overgrowths on speleothems, which are a particular morpho-
Json) or make exploratory plots, such as maps or histograms         type of cave deposits formed in association with paleo sea
for various fields (Table 1).                                       level (Dumitru et al., 2021).
                                                                        Each sea-level index point is associated with one or more
3.5    Documentation                                                dated samples or with non-radiometric chronological con-
                                                                    straints, such as, for example, biostratigraphic markers. In
The documentation associated with WALIS is maintained in
                                                                    total, WALIS 1.0 includes 4110 dated samples. These in-
GitHub and served via a ReadTheDocs web page built with
                                                                    clude corals, cave deposits, mollusks, or oolites dated via
Sphinx (Brandl, 2021). The documentation contains details
                                                                    U-series (n = 2717). Upon selecting the material dated by
on the main tables of WALIS and a description for each field
                                                                    U-series techniques, the interface requests the compiler to
of the database, with guidelines on which values or details
                                                                    fill in different fields specific to the material chosen. WALIS
are expected to be included by the data compiler. Via the
                                                                    1.0 also contains a relevant number of samples dated with lu-
ReadTheDocs page, the documentation may be searched and
                                                                    minescence (n = 597), amino acid racemization (n = 583),
exported as a PDF file.
                                                                    and electron spin resonance (n = 213). Additional chrono-
                                                                    logical constraints include 120 chronostratigraphic or bios-
4     Database contents                                             tratigraphic records (e.g., pollen zones) and 160 age deter-
                                                                    minations of “other” type. Examples of the latter are tephra
The data included in WALIS 1.0 were compiled primarily              layers or finite radiocarbon ages, or ages inferred to be be-
within the ESSD special issue (Table 2). Some of the papers         yond the range of the radiocarbon method. Each sea-level
in the special issue have a global scope, such as those collect-    proxy must be correlated with at least one chronological con-
ing data for U-series on corals, speleothems, and MIS 5c/5a         straint. There is no upper limit on the number of chronolog-
(Chutcharavan and Dutton, 2021a; Dumitru et al., 2021;              ical constraints associated with a single sea-level proxy. The
Thompson and Creveling, 2021b, respectively). Most papers           choice of how to calculate final-age uncertainties for a sea-
are instead focused on specific regions. Two manuscripts for        level proxy associated with several chronological constraints
which data are available in WALIS 1.0 are only available as         is left to the end user. However, in the data visualization in-
preprints (see Table 2). At the same time, data from one pa-        terface, we propose an approach where each age within the
per published outside the special issue were submitted by the       same sea-level proxy is sampled using a Monte Carlo method
lead author to WALIS (Steidle et al., 2021). In one case (not       within a random or uniform distribution (depending on the
shown in Table 2), the WALIS U-series structure was used to         type of constraint), and a synthetic age is calculated by com-
report on Last Interglacial coral and speleothem ages in the        bining the samples available for the proxy.
Mediterranean Sea, adding more samples to those currently               In the interface, it is also possible to select minimum or
in WALIS for that region (Pasquetti et al., 2021). These data       maximum ages, indicating if a sea-level proxy is older or
were not compiled via the interface; therefore, they are not        younger than a given sample. This option may be chosen
included in WALIS 1.0. They will be included in the subse-          when, for example, only infinite radiocarbon ages are avail-
quent versions of WALIS.                                            able as an age constraint for a beach deposit, indicating thus

https://doi.org/10.5194/essd-15-1-2023                                                    Earth Syst. Sci. Data, 15, 1–23, 2023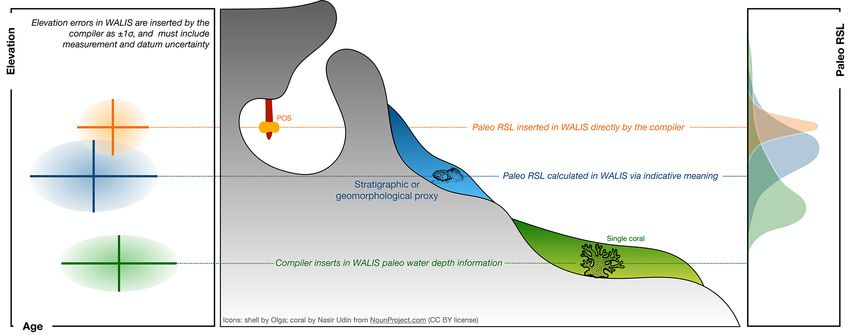
8                                                  A. Rovere et al.: The World Atlas of Last Interglacial Shorelines (version 1.0)

Figure 5. Screenshots of the three pages of the WALIS data visualization, version 2.0. The tool is available at https://warmcoasts.shinyapps.
io/WALIS_Visualization/ (last access: 15 December 2022).

Earth Syst. Sci. Data, 15, 1–23, 2023                                                          https://doi.org/10.5194/essd-15-1-2023
A. Rovere et al.: The World Atlas of Last Interglacial Shorelines (version 1.0)                                                                         9

Table 1. Main resources associated with WALIS, with repositories on GitHub and the direct link to the application (if available). NA – not
available.

      Citation                        Description                                GitHub page                          Direct link
                                      PHP database interface                     NA                                   https://warmcoasts.eu/
                                                                                                                      world-atlas.html∗
      Rovere et al. (2022)            Repository with Python scripts to per-     https://alerovere.github.io/
                                      form queries, download data, or make       WALIS/∗
                                      typical plots. It also contains the com-
                                      plete database in different formats
      Rovere et al. (2020)            Description of the database tables and     https://github.com/Alerovere/        https://walis-help.readthedocs.
                                      fields, with help for the compilation of   WALIS_Help.git∗                      io/∗
                                      WALIS
      Garzón and                      R code for the visualization interface     https://github.com/Alerovere/        https://warmcoasts.shinyapps.
      Rovere (2022)                                                              WALIS_Visualization∗                 io/WALIS_Visualization/∗
   ∗ Last access: 15 December 2022.

Figure 6. Location of sea-level proxies included in WALIS 1.0, divided by category. The code used to create this image is available from
Rovere et al. (2022). Map made with Natural Earth, background from https://www.naturalearthdata.com (last access: 15 December 2022).

that the deposit is older than 50–60 ka, but it is impossible to                  atically map the inner margin of marine terraces along the
assign a radiometric age. In summary, in WALIS 1.0, there                         Pacific coasts of South America, reporting 1953 marine ter-
are nine possible combinations (Fig. 7) to define a sea-level                     races, representing more than 80 % of the data points of this
proxy (sea-level index point, marine or terrestrial limiting)                     kind in WALIS (and 43 % of the data points in WALIS 1.0).
and its associated age (older/younger than, or with defined                       Biological indicators (i.e., single corals or coral reef terraces)
age).                                                                             and limiting points (marine or terrestrial) contain relatively
                                                                                  fewer records. The lowest occurrences in the database are
                                                                                  indicators of depositional origin. This category includes sev-
4.2    Types of sea-level proxies                                                 eral proxies, ranging from widely defined fossil beach de-
In WALIS 1.0, paleo sea levels are interpreted from 30 dif-                       posits and beach rocks (Mauz et al., 2015), to beach ridges
ferent types of sea-level indicators. In Fig. 8, we group                         (Otvos, 2000) or lagoonal deposits.
them into four general categories. In the current version, the
most represented category is geomorphological sea-level in-                       4.3    Elevation metadata
dicators (such as marine terraces, shoreline angles, or tidal
notches). The high number of records for this category is                         Data and metadata on elevation measurement and the verti-
driven by the data from Freisleben et al. (2020). They used                       cal datum used are essential to describe a sea-level proxy,
a tool called TerraceM (Jara-Muñoz et al., 2016) to system-                       as they affect the uncertainties associated with paleo RSL.

https://doi.org/10.5194/essd-15-1-2023                                                                          Earth Syst. Sci. Data, 15, 1–23, 2023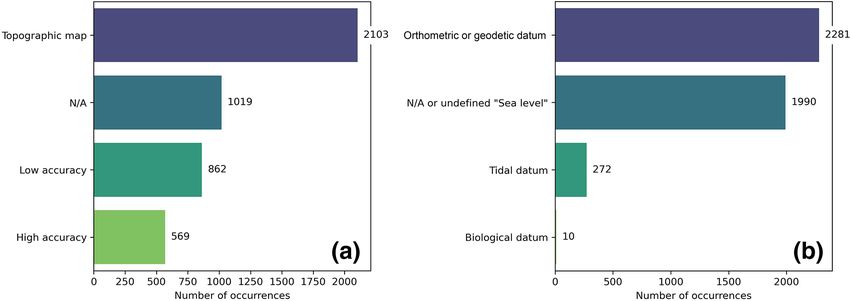
10                                                             A. Rovere et al.: The World Atlas of Last Interglacial Shorelines (version 1.0)

Table 2. List of papers describing data compiled in WALIS format and associated datasets.

         Area                                               Citation                                                Dataset
         Global (U-series on corals)                        Chutcharavan and Dutton (2021a)                         Chutcharavan and Dutton (2021b)
         Global (U-series on speleothems)                   Dumitru et al. (2021)                                   Dumitru et al. (2020)
         Global (MIS 5c and MIS 5a)                         Thompson and Creveling (2021b)                          Thompson and Creveling (2021a)
         Bahamas, Florida, Turks and Caicos                 Dutton et al. (2021)                                    Dutton et al. (2021)
         Gulf of Mexico                                     Simms (2021)                                            Simms (2020)
         Southwestern Atlantic                              Rubio-Sandoval et al. (2021a)                           Rubio-Sandoval et al. (2021b)
         Pacific coast of North America                     Muhs (2022)                                             Muhs et al. (2021a)
         Southeast South America                            Gowan et al. (2021)                                     Gowan et al. (2020)
         Pacific coast of South America                     Freisleben et al. (2021)                                Freisleben et al. (2020)
         Japan                                              Tam and Yokoyama (2021)                                 Tam and Yokoyama (2020)
         Southeast Asia                                     Maxwell et al. (2021a)                                  Maxwell et al. (2021b)
         Korean Peninsula                                   Ryang et al. (2022)                                     Ryang and Simms (2021)
         Tropical Pacific islands                           Hallmann et al. (2021)                                  Hallmann and Camoin (2020)
         New Zealand                                        Ryan et al. (2021)                                      Ryan et al. (2020)
         East Africa and West Indian Ocean                  Boyden et al. (2021b)                                   Boyden et al. (2021a)
         Southern Africa                                    Cooper and Green (2021)                                 Cooper and Green (2020)
         West Mediterranean                                 Cerrone et al. (2021b)                                  Cerrone et al. (2021a)
         Glaciated Northern Hemisphere                      Dalton et al. (2022)                                    Dalton et al. (2021)
         Northwest Europe                                   Cohen et al. (2022)                                     Cohen et al. (2021)
         Eastern Mediterranean1                             Mauz and Elmejdoub (2021)1 ; Mauz et                    Mauz (2020); Sivan and Galili (2020);
                                                            al. (2020)1                                             Zomeni (2021)
         Yucatan (Mexico) cave deposits2                    Steidle et al. (2021)                                   Included in WALIS 1.0 with no regional
                                                                                                                    datasets published
       1 Preprints, not peer reviewed. 2 Data from this paper are available within version 1.0 of the global database but are not included in the ESSD special issue and
       are not uploaded in Zenodo as a regional dataset.

For this reason, WALIS includes two tables containing infor-                                the literature to discern how the elevation of a sea-level proxy
mation on elevation measurement methods and vertical da-                                    was initially measured.
tums used to report the elevation of samples and sea-level                                     Looking at broad categories of vertical datums to which
proxies in the field. Each sea-level proxy and each sample                                  elevation measurements have been attributed (Fig. 9), a large
in WALIS 1.0 must relate to one record in these two tables.                                 number of data referred to either orthometric or geodetic da-
Looking at broad categories of elevation measurement tech-                                  tums. The high frequency of the latter is driven by the large
niques (Fig. 9), it is evident that only a fraction of sea-level                            number of terraces reported by Freisleben et al. (2021), who
proxies in WALIS 1.0 have been measured with techniques                                     referred their measurements to the global EGM08 geoid. If
with sub-meter (or better) vertical accuracy (e.g., differen-                               this source is excluded, the vertical datum for most records in
tial GNSS or total station). Elevations for almost half of the                              WALIS is either not reported or referred generally to “mean
sea-level proxies in WALIS 1.0 were gathered from digital                                   sea level” with no further specifications. Only a small frac-
elevation models or topographic maps. This high percentage                                  tion of data are referred to a tidal datum, and very few data
is driven by the 1953 marine terraces measured on digital el-                               points were referred to a vertical biological datum (e.g., the
evation models by Freisleben et al. (2021). Also, elevation                                 height of living coral microatolls).
measurement methods are often labeled in WALIS as “not
reported”, meaning that there was insufficient information in

Earth Syst. Sci. Data, 15, 1–23, 2023                                                                                   https://doi.org/10.5194/essd-15-1-2023
A. Rovere et al.: The World Atlas of Last Interglacial Shorelines (version 1.0) 11
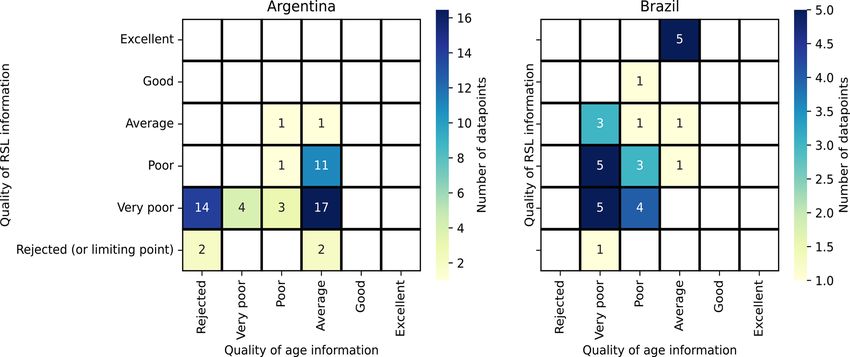
4.4 Relative sea-level estimates from WALIS data 5.1 Data quality
As shown above, in Fig. 8, sea-level proxies in WALIS 1.0 In several tables within WALIS, there are fields to help end
can be divided into four broad categories. However, there are users understand the quality of the data. In this context, qual-
differences in how relative sea-level (RSL) information is in- ity does not necessarily refer to accuracy or precision but is a
serted in the WALIS interface for three common types of in- subjective measure that can reflect, for example, more infor-
dex points: stratigraphic (including geomorphological prox- mation associated with the data point that leads it to be con-
ies), speleothems, or corals (Fig. 10). For any sea-level index sidered more robust. In the RSL from stratigraphy table, data
point, regardless of the type, the WALIS interface requests compilers were asked to score, on a scale from 0 to 5, the age
as mandatory information the elevation of the proxy and the and RSL information quality of each data point inserted. A
associated 2σ error, which should also include datum uncer- general guide on how to score the records was given by Ro-
tainty. vere et al. (2020) and is here reported in Table 3. However,
Regarding RSL index points from stratigraphy, the WALIS its use was not strictly enforced within the WALIS special
interface calculates paleo RSL from the upper and lower lim- issue. Although the guidelines are designed to facilitate ob-
its of occurrence of the proxy in modern analogs, which are jective data analysis, we recognize there is still potential for
requested as mandatory fields. Using the concept of indica- subjective interpretation.
tive meaning (Shennan, 1982; Shennan et al., 2015) and as- For studies following this suggested ranking scale, com-
sociated formulas (Rovere et al., 2016), the interface calcu- paring quality scores among areas is possible. Examples are
lates paleo RSL and 2σ uncertainties, which are then saved the records of Argentina (Gowan et al., 2020) and Brazil
in the database. In the case of sea-level index points from (Rubio-Sandoval et al., 2021a), shown in Fig. 11. Compar-
speleothems, in WALIS 1.0 represented by phreatic over- ing the scores in these two datasets shows that, on average,
growth on speleothems (POS), the compiler is required to in- records in Argentina have slightly higher age quality than
sert the values of paleo RSL and associated ±1σ uncertainty. those in Brazil. However, the RSL information for some sites
In the case of sea-level index points from single corals, the in Brazil reaches the “excellent” score, which is not achieved
WALIS interface requests the insertion of upper, lower, and by any record in Argentina. Ideally, those sites might be tar-
modal depth range of occurrence of living specimens. For geted to gauge whether it may be possible to improve their
corals, the interface does not calculate paleo RSL. However, age control.
in the code used to prepare data for the ShinyApp interface Samples dated with radiometric techniques have a manda-
(Rovere et al., 2022), we include scripts to compute a gamma tory field where data compilers indicate whether the data
distribution from the upper and lower limits of occurrence of point is “accepted” or “rejected”. The rationale of this field
corals used as index points (shown in Fig. 10), an approach is to allow the data compiler to insert samples rejected by
similar to that proposed by Hibbert et al. (2016). original authors and retain unsuccessful dating attempts for
future reference. Such fields were expanded in the U-series
5 Principal limitations of WALIS 1.0 ages on corals template thanks to the input by Chutchara-
van and Dutton (2021a). These authors proposed inserting
An essential aspect of any database is the assessment of limi- fields in the database to report different screening protocols
tations in its structure and in the data it contains. The WALIS applied to existing ages. Investigating whether U-series ap-
structure was agreed upon by a pool of scientists who are ex- proach on corals might also be used for other radiometric dat-
perts in different regions and dating techniques. It was also ing techniques represents potential ground for future WALIS
modified as needed during the compilation of version 1.0, versions.
following the suggestions of data compilers. Within the in-
terface, there is the possibility to report “bugs” or recommen- 5.2 Geographic gaps
dations to the administrators, helping future developments
of the WALIS interface and database structure. The data in- In compiling data for WALIS 1.0, the aim was to include
cluded in WALIS 1.0 underwent peer review together with as many sites as possible globally, including all relevant in-
the associated papers, and most data contained in WALIS formation related to sea-level proxies and associated dating
1.0 have been subject to peer review via their original pub- methods. While we achieved both goals, comparing the data
lication. However, errors or inaccuracies may be present in included in WALIS 1.0 with the sites reported in the exten-
WALIS 1.0. For this reason, the interface allows data compil- sive review by Pedoja et al. (2014), it is possible to high-
ers and end users to indicate issues with specific data points. light areas where Last Interglacial sea-level proxies might be
Correcting the problems identified in this way will likely lead present but are not available in the WALIS standard format.
to future WALIS versions, allowing the tracking of changes These areas are shown in Fig. 12 and are discussed below,
and sharing credit with new contributors. together with relevant or most recent works, which may be
used as a starting point for the inclusion of these areas in the
subsequent versions of WALIS.
https://doi.org/10.5194/essd-15-1-2023 Earth Syst. Sci. Data, 15, 1–23, 202312 A. Rovere et al.: The World Atlas of Last Interglacial Shorelines (version 1.0)
Table 3. Quality scores as suggested by the WALIS guidelines (verbatim from Rovere et al., 2020, originally published under the CC-BY
2.0 license). Scores vary from 0 (rejected) to 5 (excellent).
Quality of RSL data Score Quality of age constraints
Elevation precisely measured, referred to a clear datum and 5 Very narrow age range, e.g., few kiloyears, that allows
RSL indicator with a very narrow indicative range. Final RSL the attribution to a specific timing within a substage of
uncertainty is submetric MIS 5 (e.g., 117 ± 2 ka)
Elevation precisely measured, referred to a clear datum and 4 Narrow age range, allowing the attribution to a specific
RSL indicator with a narrow indicative range. Final RSL un- substage of MIS 5 (e.g., MIS 5e)
certainty is between 1 and 2 m
Uncertainties in elevation, datum, or indicative range sum up to 3 The RSL data point can be attributed only to a generic
a value between 2 and 3 m interglacial (e.g., MIS 5)
Final paleo RSL uncertainty is higher than 3 m 2 Only partial information or minimum age constraints
are available
Elevation and/or indicative range must be regarded as very 1 Different age constraints point to different interglacials
uncertain due to poor measurement/description/RSL indicator
quality
There is not enough information to accept the record as a valid 0 Not enough information to attribute the RSL data point
RSL indicator (e.g., marine or terrestrial limiting) to any Pleistocene interglacial.
Figure 8. Percentage of occurrence in WALIS of main categories
of sea-level proxies. The code used to create this image is available
from Rovere et al. (2022).
Starting from the northernmost part of the North Ameri-
can continent, the areas not included in WALIS 1.0 include
the Last Interglacial shorelines reported in Alaska along the
coasts of the Lisburne and Seward peninsulas, the latter in-
cluding the Nome coastal plain where sea-level records left
by several sea-level highstands have been reported (Brigham-
Grette and Hopkins, 1995; Goodfriend et al., 1996). On the
Figure 7. Nine possible combinations of sea-level proxies and age Russian side of the Bering Strait, in the Chukotka Penin-
determination types in WALIS 1.0. The number on the bottom of
sula, the Last Interglacial sequences are reported by Khim
each type indicates its frequency within the database.
et al. (2001) and Brigham-Grette et al. (2001). South of this
area, Quaternary marine and coastal sequences were also re-
Earth Syst. Sci. Data, 15, 1–23, 2023 https://doi.org/10.5194/essd-15-1-2023A. Rovere et al.: The World Atlas of Last Interglacial Shorelines (version 1.0) 13 Figure 9. Elevation measurement methods (a) and vertical datums (b) associated with sea-level proxies in WALIS. The code used to create this image is available from Rovere et al. (2022). Figure 10. Three types of index points in WALIS 1.0 and associated elevation (left) and paleo RSL information (right). The figure represents the ideal case of three index points formed at the same time (overlapping ages within error bars), surveyed at different elevations but resulting in a coherent paleo RSL history (overlapping paleo RSL) once interpretation of proxies is included. POS is phreatic overgrowth on speleothems. ported on the eastern side of the Kamčatka Peninsula (Pedoja during the Last Glacial Maximum, which has likely eroded et al., 2013). most, if not all, Last Interglacial coastal sections in this Another data gap in WALIS 1.0 is evident on the Pa- area. Going southwards, surfaces of marine origin, likely of cific coasts of North and Central America. Potential sites Pleistocene age, are reported on the South Shetland Islands in this area (including the Mexican states south of Sonora (Navas et al., 2006; López-Martínez et al., 2016) but not in- and the Pacific coast of Central America) are discussed in cluded in WALIS 1.0. It is unclear whether the chronological Muhs (2022), who highlights that some studies on these lo- constraints on those landforms are robust enough to be in- cations are present but do not contain enough details to be serted in WALIS. inserted in WALIS. We also emphasize that WALIS 1.0 does On the western coasts of the Central Atlantic, another vast not include the data reported by a recent paper detailing the area with a substantial lack of records in WALIS 1.0 in- marine terraces of Santa Cruz Island, California, which ap- cludes the shores of northern Brazil, French Guiana, Suri- peared in the literature during the compilation of the atlas name, Guyana, Venezuela, and the Caribbean Sea coasts of (Muhs et al., 2021b). Colombia, Panama, Costa Rica, Nicaragua, and Honduras. There are virtually no Last Interglacial shorelines along Rubio-Sandoval et al. (2021a) discuss potential sites in this the South American Pacific coasts extending south of 75◦ S vast area. However, studies with enough metadata are miss- latitude. The absence of such features in this vast area is ing, except offshore Colombia, on the San Andrés and Prov- probably due to the presence of the Patagonian ice sheet idencia Islands. Regarding the Caribbean Sea, WALIS 1.0 https://doi.org/10.5194/essd-15-1-2023 Earth Syst. Sci. Data, 15, 1–23, 2023
14                                                 A. Rovere et al.: The World Atlas of Last Interglacial Shorelines (version 1.0)

Figure 11. Heatmap summarizing the quality of age and RSL information for data in Argentina (Gowan et al., 2020) and Brazil (Rubio-
Sandoval et al., 2021a). Labels inside each cell detail the number of sites with the corresponding RSL/age quality scores. The color of each
cell is related to the relative frequency of each duplet of scores. The code used to create this image is available from Rovere et al. (2022).

Figure 12. Comparison between sea-level proxies in WALIS 1.0 and those in the global review by Pedoja et al. (2014), indicating areas where
geographic data gaps are present (see details in the main text). Map made with Natural Earth, background from https://www.naturalearthdata.
com (last access: 15 December 2022).

includes the most relevant data from this region. However,               (Wehmiller et al., 2021) should be included in future versions
additional sites that may be inserted in WALIS are present in            of WALIS. In Bermuda, data from corals (Chutcharavan and
Jamaica (Mitchell et al., 2001, 2006) and Cuba (Muhs et al.,             Dutton, 2021a) and cave deposits (Dumitru et al., 2021) are
2017; Schielein et al., 2020).                                           included in WALIS 1.0. Still, more sites and dated samples
   For the US Atlantic coast (excluding the Florida Keys),               are reported in a recent review by Muhs et al. (2020). Their
the only data included in WALIS 1.0 are those related to                 inclusion in the subsequent versions of WALIS must be con-
MIS 5a/5c (Thompson and Creveling, 2021b). Former stud-                  sidered a priority, given the importance of this area for un-
ies suggested that these stages attained similar elevations to           raveling land motion changes driven by glacial isostatic ad-
MIS 5e in this area due to glacial isostatic adjustment pro-             justment in the North Atlantic.
cesses (Wehmiller et al., 2004); therefore, outcrops of this                On the East Atlantic, Pedoja et al. (2014) report that Last
age might have been eroded by later highstands. However,                 Interglacial sea-level proxies were mapped in Ireland by
there are reports of MIS 5e successions scattered along the              Orme (1966). While it seems unlikely that this study con-
coast (Wehmiller et al., 2010, 2012; O’Neal and McGeary,                 tains enough metadata to be considered for WALIS, some of
2002; Wright et al., 2009), which should be screened for in-             the Quaternary deposits presented in this early study might
sertion in WALIS. Also, as already mentioned in the pre-                 have been the subject of successive dating (e.g., Gallagher
vious sections, the Last Interglacial amino acid racemiza-               and Thorp, 1997), thereby meeting the standard for their in-
tion data obtained from samples of the US Atlantic coast                 clusion in subsequent versions of WALIS. Last Interglacial

Earth Syst. Sci. Data, 15, 1–23, 2023                                                          https://doi.org/10.5194/essd-15-1-2023
A. Rovere et al.: The World Atlas of Last Interglacial Shorelines (version 1.0)                                                15

data missing from WALIS 1.0 may also be present on the             ies must be screened to gauge whether valid sea-level index
Atlantic coasts of the Iberian Peninsula (Alonso and Pagés,        points can be inserted in the subsequent versions of WALIS.
2007; Meireles and Texier, 2000; Benedetti et al., 2009). In          There are no data in WALIS 1.0 for India and the Chagos–
the Azores islands, Last Interglacial deposits have also been      Laccadive ridge. Key references from which data might be
reported (Ávila et al., 2009, 2015) but are not included in        retrieved are Bhatt and Bhonde (2006), Banerjee (2000) (for
WALIS 1.0. Only U-series ages with no indication of paleo          India), Woodroffe (2005), and Gischler et al. (2008) (for the
sea level are reported in WALIS 1.0 from the Canary and            Chagos–Laccadive Ridge). Unfortunately, we could not find
Cabo Verde archipelagos. However, enough metadata might            publications reporting data for Last Interglacial successions
be present in some papers (Zazo et al., 2010, 2007; Muhs et        in Thailand, Malaysia, and the islands of Sumatra and Java.
al., 2014) to upgrade these points to sea-level proxies in the     WALIS 1.0 also lacks data from the South China Sea; how-
subsequent versions of WALIS.                                      ever, some potentially Last Interglacial sites were reported
   Within the Mediterranean Sea, data from several stud-           by Pedoja et al. (2008).
ies were inserted in WALIS 1.0. However, some areas lack              In Australia, the Last Interglacial data included in WALIS
records, mainly in the eastern part of the basin. For example,     1.0 are mainly derived from corals (Chutcharavan and Dut-
there seem to be little to no studies on the coastal Quater-       ton, 2021a) along the western coast and the Great Barrier
nary of Libya, except for one site near Alexandria inserted        Reef. Thompson and Creveling (2021b) report MIS 5a/5c
in WALIS 1.0 (Mauz and Elmejdoub, 2021). While sites in            in South Australia. Further data on MIS 5e shorelines from
Israel and Cyprus have been inserted in WALIS 1.0 (Sivan           strand plains in South Australia are available from sev-
and Galili, 2020; Zomeni, 2021), there are no sites in WALIS       eral studies (Murray-Wallace and Belperio, 1991; Murray-
for Lebanon, Syria, Turkey, and Greece. In these areas, Last       Wallace, 2002; Murray-Wallace et al., 2016; Pan et al., 2018)
Interglacial sea-level proxies are reported in the literature      and should be included in the subsequent versions of WALIS.
(e.g., Sanlaville, 1974; Dodonov et al., 2008; Tarıet al., 2018;
Gaki-Papanastassiou et al., 2009) and should be screened to        5.3   Future developments
gauge whether enough metadata are available for their in-
sertion in the following versions of WALIS. Also, Last In-         While WALIS 1.0 represents a concrete result, we know there
terglacial sea-level proxies from the Black Sea are reported       are several ways in which the WALIS database and infras-
by Pedoja et al. (2014) but are not yet present in WALIS 1.0.      tructure could be improved. We discuss the main avenues
The published records in these areas need to be evaluated and      for improvement below. These emerged during the compi-
eventually included in the subsequent versions of WALIS.           lation of WALIS 1.0, and more will likely be identified as the
   There is a substantial lack of data in WALIS 1.0 along          database starts to be used by more end users.
the Atlantic coasts of northern and central Africa. However,        1. As mentioned above, the database structure is now a col-
there are several recent studies detailing Last Interglacial ma-       lection of tables with no links defined in MySQL. Creat-
rine and coastal sequences in Morocco (Barton et al., 2009;            ing such a connection would imply a partial restructur-
Plaziat et al., 2008, 2006; Rhodes et al., 2006), Mauritania,          ing of the PHP interface. However, this would improve
and Senegal (Giresse et al., 2000), where data might be gath-          the overall structure of the WALIS database. Another
ered for subsequent WALIS versions. There are only a few               technical improvement would consist in allowing bulk
other reports of Last Interglacial shorelines (e.g., Gregory,          uploads, which at the current stage is not possible.
1962) south of Senegal, the first southwards being those in
Angola inserted in WALIS 1.0 by Cooper and Green (2021).            2. One of the main aims of WALIS is to standardize the
   Another area where more data could be added to WALIS                reporting of sea-level proxies and dated samples for the
is the Red Sea. Here, several U-series ages on corals have             Last Interglacial. The focus is on relative sea-level prox-
been reviewed by Chutcharavan and Dutton (2021a), some of              ies for reconstructing former sea levels from WALIS
which were identified as “sea-level index points from corals”.         data. The paleo RSL calculated from these proxies
Further sea-level index points might be retrieved from stud-           (Fig. 10) represents the sum of global mean sea-level
ies reporting on Last Interglacial shorelines in Saudi Ara-            changes (driven by ice melting and thermal expansion)
bia (Dullo, 1990) and the Gulf of Suez (Parker et al., 2012;           and local effects due to land motions caused by subsi-
Bosworth and Taviani, 1996). On the other side of the Ara-             dence, tectonic uplift, glacial isostatic adjustment, and
bian Peninsula, in the Gulf of Oman and the Persian Gulf,              other processes. Fields to report on rates of uplift or
the only data inserted in WALIS 1.0 are those related to MIS           subsidence are present in WALIS, with the caveat that
5a/5c proxies (Thompson and Creveling, 2021b). However,                such estimates must be independent of the Last Inter-
potential MIS 5e sea-level proxies are reported in the lit-            glacial sea-level record. Uplift or subsidence rates are
erature from Oman (Falkenroth et al., 2020, 2019), United              stored in the database but are not used in WALIS to cor-
Arab Emirates, Qatar (Williams and Walkden, 2002), and                 rect the paleo relative sea-level elevations. Future ver-
Iran (Oveisi et al., 2007; Pirazzoli et al., 2004). These stud-        sions of WALIS should improve the fields describing
                                                                       land motion values, which would also entail revising the

https://doi.org/10.5194/essd-15-1-2023                                                  Earth Syst. Sci. Data, 15, 1–23, 2023
You can also read