Cortical astrocytes independently regulate sleep depth and duration via separate GPCR pathways - eLife
←
→
Page content transcription
If your browser does not render page correctly, please read the page content below
RESEARCH ARTICLE

                                     Cortical astrocytes independently
                                     regulate sleep depth and duration via
                                     separate GPCR pathways
                                     Trisha V Vaidyanathan1,2, Max Collard1, Sae Yokoyama2, Michael E Reitman1,2,
                                     Kira E Poskanzer1,2,3*
                                     1
                                      Neuroscience Graduate Program, University of California, San Francisco, San
                                     Francisco, United States; 2Department of Biochemistry & Biophysics, University of
                                     California, San Francisco, San Francisco, United States; 3Kavli Institute for
                                     Fundamental Neuroscience, San Francisco, United States

                                     Abstract Non-rapid eye movement (NREM) sleep, characterized by slow-wave
                                     electrophysiological activity, underlies several critical functions, including learning and memory.
                                     However, NREM sleep is heterogeneous, varying in duration, depth, and spatially across the
                                     cortex. While these NREM sleep features are thought to be largely independently regulated, there
                                     is also evidence that they are mechanistically coupled. To investigate how cortical NREM sleep
                                     features are controlled, we examined the astrocytic network, comprising a cortex-wide syncytium
                                     that influences population-level neuronal activity. We quantified endogenous astrocyte activity in
                                     mice over natural sleep and wake, then manipulated specific astrocytic G-protein-coupled receptor
                                     (GPCR) signaling pathways in vivo. We find that astrocytic Gi- and Gq-coupled GPCR signaling
                                     separately control NREM sleep depth and duration, respectively, and that astrocytic signaling
                                     causes differential changes in local and remote cortex. These data support a model in which the
                                     cortical astrocyte network serves as a hub for regulating distinct NREM sleep features.

*For correspondence:
Kira.Poskanzer@ucsf.edu              Introduction
                                     Sleep is characterized by distinct electrophysiological features that reflect the rhythmic activity of
Competing interests: The
                                     large populations of neurons. One phase of sleep—non-rapid eye movement (NREM) sleep—is criti-
authors declare that no
                                     cal for several important functions including memory consolidation/destabilization and synaptic
competing interests exist.
                                     homeostasis (Klinzing et al., 2019; Genzel et al., 2014; Kim et al., 2019; Tononi and Cirelli, 2014;
Funding: See page 25                 Diekelmann and Born, 2010; Tononi and Cirelli, 2006; Tononi and Cirelli, 2020; Ji and Wilson,
Received: 22 September 2020          2007). These functions are thought to require slow-wave activity (SWA), the distinct oscillatory pat-
Accepted: 17 February 2021           tern of neural activity in the cortex that occurs during NREM sleep and differentiates it from the rela-
Published: 17 March 2021             tively desynchronized activity during wakefulness and REM sleep. However, neural activity during
                                     NREM sleep is not uniform over the course of sleep, but varies in duration and depth (as measured
Reviewing editor: Beth Stevens,
Boston Children’s Hospital,
                                     by SWA intensity). Past work has demonstrated that NREM sleep duration and depth can be inde-
United States                        pendently controlled (Dijk and Beersma, 1989; Patrick and Gilbert, 1896). Indeed, the circuit
                                     mechanisms known to underlie sleep depth and duration are largely independent from each other
   Copyright Vaidyanathan et al.
                                     and operate on very different time-scales: sleep duration is mediated by subcortical nuclei that
This article is distributed under
                                     receive direct input from circadian centers and drive sleep/wake transitions through release of neu-
the terms of the Creative
Commons Attribution License,         romodulatory signals (Holst and Landolt, 2018; Saper and Fuller, 2017; Lee and Dan, 2012). On
which permits unrestricted use       the other hand, SWA intensity is largely regulated by cortical and thalamocortical circuits
and redistribution provided that     (Chen et al., 2012; Steriade et al., 1993; Lemieux et al., 2015; Volgushev et al., 2006;
the original author and source are   Steriade and Timofeev, 2003; Sheroziya and Timofeev, 2014; Amzica and Steriade, 1995; San-
credited.                            chez-Vives and McCormick, 2000). While these two physiological measures of sleep have been

Vaidyanathan et al. eLife 2021;10:e63329. DOI: https://doi.org/10.7554/eLife.63329                                                    1 of 32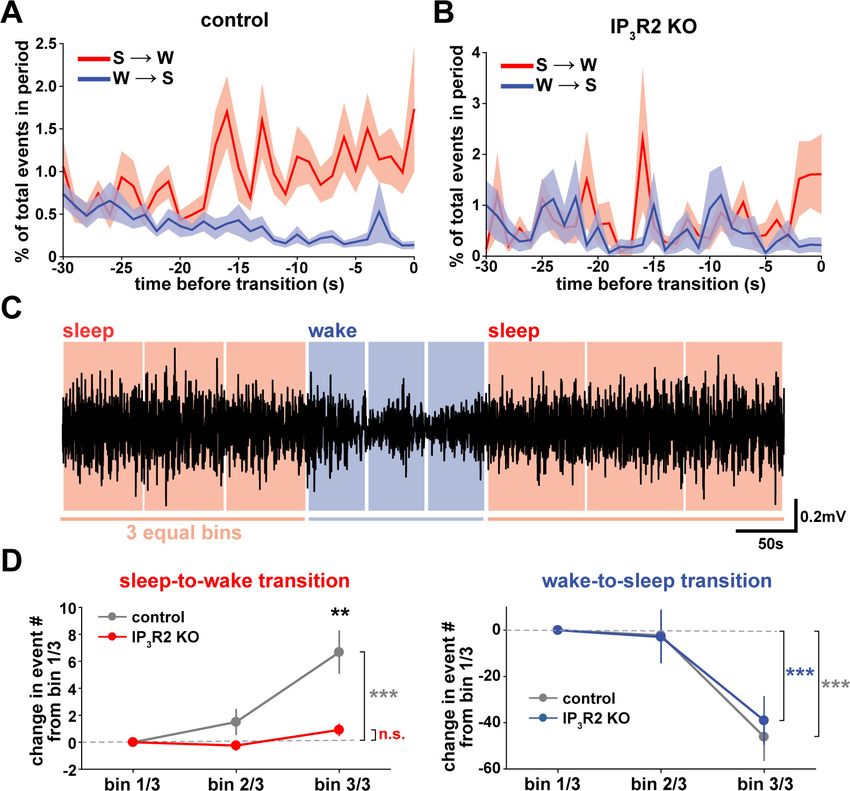
Research article                                                                                                   Neuroscience

                                   eLife digest Sleep has many roles, from strengthening new memories to regulating mood and
                                   appetite. While we might instinctively think of sleep as a uniform state of reduced brain activity, the
                                   reality is more complex. First, over the course of the night, we cycle between a number of different
                                   sleep stages, which reflect different levels of sleep depth. Second, the amount of sleep depth is not
                                   necessarily even across the brain but can vary between regions.
                                      These sleep stages consist of either rapid eye movement (REM) sleep or non-REM (NREM) sleep.
                                   REM sleep is when most dreaming occurs, whereas NREM sleep is particularly important for learning
                                   and memory and can vary in duration and depth. During NREM sleep, large groups of neurons
                                   synchronize their firing to create rhythmic waves of activity known as slow waves. The more
                                   synchronous the activity, the deeper the sleep.
                                      Vaidyanathan et al. now show that brain cells called astrocytes help regulate NREM sleep.
                                   Astrocytes are not neurons but belong to a group of specialized cells called glia. They are the
                                   largest glia cell type in the brain and display an array of proteins on their surfaces called G-protein-
                                   coupled receptors (GPCRs). These enable them to sense sleep-wake signals from other parts of the
                                   brain and to generate their own signals. In fact, each astrocyte can communicate with thousands of
                                   neurons at once. They are therefore well-poised to coordinate brain activity during NREM sleep.
                                      Using innovative tools, Vaidyanathan et al. visualized astrocyte activity in mice as the animals
                                   woke up or fell asleep. The results showed that astrocytes change their activity just before each
                                   sleep–wake transition. They also revealed that astrocytes control both the depth and duration of
                                   NREM sleep via two different types of GPCR signals. Increasing one of these signals (Gi-GPCR)
                                   made the mice sleep more deeply but did not change sleep duration. Decreasing the other (Gq-
                                   GPCR) made the mice sleep for longer but did not affect sleep depth.
                                      Sleep problems affect many people at some point in their lives, and often co-exist with other
                                   conditions such as mental health disorders. Understanding how the brain regulates different features
                                   of sleep could help us develop better – and perhaps more specific – treatments for sleep disorders.
                                   The current study suggests that manipulating GPCRs on astrocytes might increase sleep depth, for
                                   example. But before work to test this idea can begin, we must first determine whether findings from
                                   sleeping mice also apply to people.

                                   mostly described in non-overlapping mechanistic terms, there is also physiological evidence that
                                   sleep depth and duration can be coupled. For example, cortical calcium (Ca2+) signaling can act on
                                   a millisecond time-scale to modulate cortical synchrony during SWA while also engaging
                                   longer term signaling cascades that regulate the sleep/wake cycle (Ode et al., 2017; Tatsuki et al.,
                                   2016). Thus, the extent to which the neural mechanisms underlying sleep depth and duration are
                                   linked remains unclear.
                                       The cortex—where mammalian sleep is most often measured—is a brain region where neural
                                   mechanisms underlying sleep duration and sleep depth coincide: many neuromodulatory nuclei asso-
                                   ciated with sleep/wake transitions send direct projections to the cortex (Björklund and Lindvall,
                                   1978; Woolf, 1991; Loughlin et al., 1986; Panula et al., 1989), and the cortex plays an instrumen-
                                   tal role in generating and propagating SWA during sleep (Volgushev et al., 2006; Sanchez-
                                   Vives and McCormick, 2000; Niethard et al., 2018; Stroh et al., 2013; Luczak et al., 2007;
                                   Massimini et al., 2004; Krone, 2020; Sanchez-Vives and Mattia, 2014; Lemieux et al., 2014). Fur-
                                   ther, cortical SWA intensity can be locally regulated, leading to heterogeneity of SWA across cortex
                                   (Huber et al., 2004; Funk et al., 2016; Siclari and Tononi, 2017). However, how the cortex integra-
                                   tes separate regulatory signals to orchestrate activity across sleep and wake is unknown. In untan-
                                   gling sleep mechanisms, both in cortex and throughout the brain, the historical focus has almost
                                   exclusively been on neurons and neuronal circuits. Yet astrocytes—the largest class of non-neuronal
                                   brain cells—are also situated to play critical roles in sleep regulation within the cortex. Astrocytes
                                   tile the cortex, can participate in bidirectional communication with thousands of neurons
                                   (Halassa et al., 2007; Allen and Barres, 2005; Bushong et al., 2002; Bazargani and Attwell,
                                   2016), exhibit morphological and transcriptional changes during sleep (Bellesi et al., 2015), and
                                   regulate SWA under anesthesia (Szabó et al., 2017; Poskanzer and Yuste, 2016; Durkee et al.,

Vaidyanathan et al. eLife 2021;10:e63329. DOI: https://doi.org/10.7554/eLife.63329                                                  2 of 32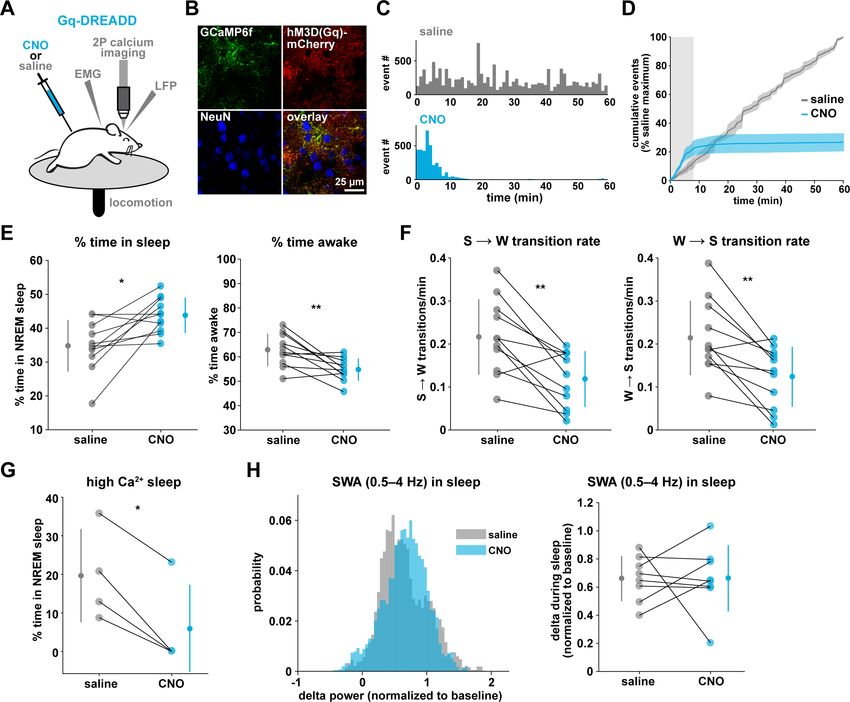
Research article                                                                                                  Neuroscience

                                   2019). Further, multiple canonical astrocytic functions are also associated with sleep/wake regula-
                                   tion, including regulation of extracellular glutamate (Poskanzer and Yuste, 2016; Poskanzer and
                                   Yuste, 2011), extracellular ion dynamics (Ding et al., 2016), release of neurotransmitters
                                   (Halassa et al., 2009; Papouin et al., 2017; Fellin et al., 2009), and metabolic regulation (Petit and
                                   Magistretti, 2016; Bellesi et al., 2018; DiNuzzo and Nedergaard, 2017).
                                      Astrocyte physiology is primarily measured via intracellular Ca2+dynamics, which vary widely in
                                   size, shape, and location, and can propagate within or even between cells (Wang et al., 2019;
                                   Khakh and McCarthy, 2015; Shigetomi et al., 2013; Shigetomi et al., 2016; Guerra-Gomes et al.,
                                   2017). Because imaging complex astrocyte Ca2+ activity in vivo is relatively new, it remains unknown
                                   whether these diverse astrocytic Ca2+ dynamics map onto different circuit functions. However, the
                                   potential of astrocytes to influence large populations of cortical neurons across different time-scales
                                   is significant (Stobart et al., 2018; Lind et al., 2013). The majority of astrocyte Ca2+ activity is
                                   thought to result from upstream activation of G-protein coupled receptors (GPCRs) (Durkee et al.,
                                   2019; Di Castro et al., 2011; Agulhon et al., 2008; Kofuji and Araque, 2021). Importantly, many
                                   astrocytic GPCRs are activated by neuromodulators, including those associated with sleep/wake reg-
                                   ulation, such as norepinephrine, acetylcholine, and histamine. Since GPCRs regulate a diverse array
                                   of Ca2+-dependent intracellular signals on many different time-scales (Grundmann and Kostenis,
                                   2017; Kholodenko et al., 2010), they are prime candidates for differentially regulating individual
                                   features of NREM sleep, such as duration and depth. A downstream target of GPCRs, the inositol tri-
                                   phosphate type two receptor (IP3R2), has been recently shown to be involved in sleep regulation
                                   (Bojarskaite et al., 2020). In astrocytes, both Gi- and Gq-coupled GPCRs activate IP3R2s and lead
                                   to increases in intracellular Ca2+ (Durkee et al., 2019; Mariotti et al., 2016; Nagai et al., 2019),
                                   while also engaging separate signaling cascades. Despite this, scant attention has been paid to
                                   whether the activation of different astrocytic GPCRs, and resulting Ca2+ signals, have differential
                                   effects on the surrounding neural circuit. Indeed, GPCR signaling in astrocytes may underlie mecha-
                                   nisms by which astrocytes perform multiple, parallel functions in the neural circuit.
                                      Here, we leveraged a recently developed image analysis tool that captures the spatiotemporal
                                   complexity of astrocyte Ca2+ dynamics (Wang et al., 2019) and astrocyte-specific chemogenetics to
                                   investigate the mechanisms by which cortical astrocytes both link and independently regulate differ-
                                   ent features of NREM sleep via GPCR signaling. To do this, we carried out in vivo two-photon (2P)
                                   imaging of astrocyte Ca2+ while recording electrophysiological sleep rhythms to examine astrocyte
                                   Ca2+ changes across natural sleep and wake. We find that endogenous Ca2+ activity is inversely cor-
                                   related with SWA and exhibits bidirectional changes prior to sleep-wake transitions. Using chemoge-
                                   netics to selectively manipulate astrocytic Gi- and Gq-GPCR pathways, we demonstrate that
                                   astrocytes actively regulate both NREM sleep duration and depth, via separate GPCR signaling path-
                                   ways: astrocytic Gi-induced Ca2+ is sufficient to increase SWA (sleep depth), while sleep-wake transi-
                                   tions (sleep duration) is dependent on Gq-GPCRs. We demonstrate a role for astrocytes in both
                                   local and cortex-wide sleep regulation; manipulating astrocytic Ca2+ in primary visual cortex (V1)
                                   alters not only local SWA, but also affects SWA in contralateral frontal cortex (FC). Further, we find
                                   that while local changes in SWA arise from greater changes in delta waves, remote SWA effects in
                                   FC are due to increases in slow oscillations. Since these two slow waves underlie different functions,
                                   our data support the concept that astrocytes exert different effects on neuronal populations
                                   depending on both the type of GPCR activated and their localization within cortical circuits.
                                   Together, our data support a role for the cortical astrocytic network as a hub for the regulation of
                                   sleep depth and duration across cortex.

                                   Results
                                   Accurate detection of astrocyte Ca2+ events in vivo across sleep and
                                   wake
                                   To study the role of astrocytes in sleep regulation, we conducted 2P imaging of astrocyte Ca2+
                                   dynamics as animals naturally transitioned between sleep and wake states (Niethard et al., 2018;
                                   Seibt et al., 2017). To specifically express the Ca2+ indicator GCaMP6f in cortical astrocytes, we
                                   injected mice with AAV-GFAP-GCaMP6f 2–4 weeks before experiments (Figure 1B, left). Electrodes
                                   were implanted for local field potential (LFP) and electromyogram (EMG) recordings (Figure 1B,

Vaidyanathan et al. eLife 2021;10:e63329. DOI: https://doi.org/10.7554/eLife.63329                                                 3 of 32
Research article Neuroscience
A 2P calcium
B
imaging astrocytic LFP 1 mV
GCaMP6f
EMG LFP
imaging
window EMG 2 mV
reference LFP
moving
locomotion
stationary
100
astrocyte Ca2+ 10
locomotion 100 µm events 1
200 s
C D
= event onset
500
wake
500 sleep (NREM) 10
r = -0.46
pixel location on y-axis
AQuA-detected 8
400 400
events
6
event rate
300 300 event count = 6
4
200 200 2
100 100 0
-2
0 10 s -1 -0.5 0 0.5 1
70 µm 0
sleep wake normalized SWA (0.5–4 Hz power)
time
time (s)
E F G
log SWA (1–4 Hz power)
wake 5 -1
sleep
*** ***
log event rate
* *** -2 *** ***
50
Ca2+ event -3
0
number 0
-4
sleep wake wake 20 s
(locomotory) (stationary)
-5
-5
locomotion sleep sleep wake wake
wake wake
(stationary) (locomotory) (stationary) (locomotory)
H I IP3R2 KO
control
6
sleep 2.0 sleep
5 stationary wake stationary wake
1.5
4
event rate
event rate
3 r = -0.36 1.0 r = -0.21
r = -0.17 r = -0.05
2
0.5
1
0
0
-1 -0.5
-1.0 -0.5 0 0.5 1.0 -1.0 -0.5 0 0.5 1.0 1.5
normalized SWA (0.5–4 Hz power) normalized SWA (0.5–4 Hz power)
Figure 1. Cortical astrocyte Ca2+ event rate and SWA are negatively correlated across behavioral states. (A) Experimental in vivo imaging and
electrophysiology setup. Mice expressing astrocytic GCaMP6f were head-fixed on a horizontal treadmill to record astrocyte Ca2+, LFP, EMG, and
locomotion. (B) Left: example image of GCaMP6F expression in L2/3 V1 astrocytes in an awake, head-fixed mouse. Right: example of LFP, EMG,
locomotion, and astrocyte Ca2+ event data using this experimental setup. (C) Left: AQuA (Wang et al., 2019) detects astrocyte Ca2+ events in 3 min
GCaMP time series. Right: representative spatiotemporal plot of AQuA-identified Ca2+ events displaying event time and duration on the x-axis, and the
unidimensional (y) spatial extent on the y-axis. Events are color-coded by behavioral state (wake=blue, NREM sleep=pink). Inset demonstrates that
event count throughout paper is quantified using event onset. (D) Ca2+ event rate and SWA are negatively correlated (Pearson’s correlation, p
Research article                                                                                                              Neuroscience

Figure 1 continued
stationary wake, and highest during locomotory wake, while (G) the inverse is true for SWA (for F and G, rank sum test, data are represented as median,
25th and 75th percentile). (H) Ca2+ event rate and SWA are negatively correlated within each behavioral period: sleep (red, Pearson’s correlation,
p
Research article                                                                                                  Neuroscience

                                   compared the events’ size, duration, and amplitude. As predicted by the large, synchronous bursts
                                   observed during locomotion, we found locomotory wake Ca2+ events were larger in size and dura-
                                   tion than events observed in the other two states. However, when we controlled for locomotion we
                                   did not find differences in size, duration, or amplitude of events between sleep and stationary wake
                                   when these features were compared individually (Figure 1—figure supplement 1A). However,
                                   astrocyte events have many other features beyond size, duration, and amplitude, such as event
                                   perimeter or propagation. Because of this spatiotemporal complexity, we next used a dimensionality
                                   reduction approach, implementing principal component analysis to explore whether astrocyte Ca2+
                                   events differed among behavioral states. This approach allowed us to incorporate 20 different event
                                   features calculated by AQuA. We found that the first three principal components (PCs) represented
                                   spatial-, temporal-, and amplitude-related features respectively. We then focused on the five PCs
                                   that explained the most variance in the imaging data (Figure 1—figure supplement 1B) and com-
                                   pared them among the three behavioral states. While the largest differences in each PC were
                                   between locomotory wake and the other two states, we also found significant differences between
                                   sleep and stationary wake in all five PCs examined (Figure 1—figure supplement 1C). Together,
                                   this analysis demonstrates that while no state-specific differences are observed by comparisons of
                                   individual event features, there are unique spatial, temporal, and amplitude signatures of sleep-spe-
                                   cific astrocyte Ca2+ events when multiple features are incorporated.
                                       We next examined the relationship between astrocyte Ca2+ event frequency and SWA within sta-
                                   tionary behavioral states and found, similar to Figure 1D, a negative correlation between Ca2+ fre-
                                   quency and SWA (Figure 1H). The strong association found between Ca2+ frequency and SWA
                                   during sleep, namely high Ca2+ activity during sleep periods of low SWA and vice versa, is sugges-
                                   tive of a possible role of astrocytic Ca2+ specifically in sleep depth. Lastly, we explored the role of
                                   IP3R2 in the relationship between astrocyte Ca2+ activity and SWA since IP3R2s are enriched in astro-
                                   cytes (Zhang et al., 2014), underlie a significant fraction of astrocytic Ca2+ dynamics through Ca2+
                                   release from intracellular stores (Beck et al., 2004), and IP3R2 KO mice show a total decrease in
                                   SWA during NREM sleep (Bojarskaite et al., 2020). To test whether the inverse relationship of
                                   astrocyte Ca2+ and SWA is dependent on IP3R2s, we imaged astrocyte Ca2+ dynamics over natural
                                   sleep and wake in IP3R2 KO mice (Petravicz et al., 2008). Similar to previous work
                                   (Srinivasan et al., 2015), we noted a reduction, but not complete abolishment, of Ca2+ events in
                                   IP3R2 KO mice. In IP3R2 KO mice, Ca2+ event rate and SWA were negatively correlated, but the cor-
                                   relation was decreased compared to controls (Figure 1I), suggesting the astrocyte-SWA relationship
                                   is at least partially dependent on the IP3R2. The change in correlation between control and IP3R2
                                   KO was most dramatic in sleep, implicating IP3R2-dependent astrocytic Ca2+ signaling in the regula-
                                   tion of SWA intensity in the sleep state. Since both Gq- and Gi-GPCR signaling can increase Ca2+ in
                                   astrocytes through IP3R2s (Durkee et al., 2019; Nagai et al., 2019) and astrocytes express many
                                   GPCRs that have been implicated in sleep-wake regulation (Durkee et al., 2019; Di Castro et al.,
                                   2011; Agulhon et al., 2008; Kofuji and Araque, 2021), the relationship between astrocytic Ca2+
                                   and SWA may result from astrocytic sensing of sleep-wake cues through GPCR signaling.

                                   Transitions from low to high SWA are centered around astrocyte Ca2+
                                   events
                                   To understand how astrocyte Ca2+ activity is related to SWA on a shorter time-scale, we asked
                                   whether consistent electrophysiological changes occur in the seconds around the onset of astrocyte
                                   Ca2+ events. As earlier, we separated the recordings by sleep, stationary wake, and locomotory
                                   wake states (Figure 2A). Although SWA was, by definition, highest during sleep, we also observed
                                   significant fluctuation between periods of relative high and low SWA within each behavioral state
                                   (Figure 2B). We next calculated Ca2+ event-triggered averages of SWA, separated by behavioral
                                   state. Because the majority of locomotory wake Ca2+ events were in bursts tied to locomotion onset,
                                   we focused on sleep and stationary wake states. We found a pattern in which Ca2+ events were pre-
                                   ceded by decreases in SWA and followed by increases in SWA (Figure 2C, left). This modulation was
                                   significantly higher during sleep compared to stationary wake (Figure 2D). Further, this SWA modu-
                                   lation was decreased in IP3R2 KO mice (Figure 2C, right, Figure 2D), indicating partial dependence
                                   of this relationship on IP3R2s (as in Figure 1I).
                                       This specific pattern of SWA change centered on astrocyte Ca2+ events—low SWA before astro-
                                   cyte events and higher afterward—suggests an active role of astrocytes in regulating sleep depth.

Vaidyanathan et al. eLife 2021;10:e63329. DOI: https://doi.org/10.7554/eLife.63329                                                 6 of 32
Research article                                                                                                                   Neuroscience

Figure 2. Astrocyte Ca2+ events characterize transitions from low to high SWA. (A) Example of SWA obtained by filtering LFP (0.5–4 Hz) recordings
(top), with corresponding astrocyte Ca2+ events (bottom). Behavioral state denoted by color: sleep (red) and wake (locomotory in blue, stationary in
cyan). (B) Example traces of SWA fluctuations for each behavioral state (top) and raster plot of Ca2+ events (below) to demonstrate that across
behavioral states, SWA fluctuates at similar levels. (C) Left: Average Ca2+ event-triggered traces reveal astrocyte Ca2+ event onsets occur after a relative
decrease in SWA and are followed by an increase in SWA during sleep (red) and stationary wake (cyan). Right: This relationship is diminished in IP3R2
KO mice, where less modulation around Ca2+ events is observed. Line width=SEM (control: n = 4 mice, 19 hr; IP3R2 KO: n = 5 mice, 22 hr). (D) SWA
modulation across the 2 s before and after Ca2+ onset demonstrates modulation is highest during sleep (red) and dependent on expression of IP3R2
(rank sum test, data represented as mean± SEM).

                                      Specifically, we speculate that astrocytes may be associated with a homeostatic process that
                                      increases SWA in response to a transient decrease in SWA. Although we cannot determine this from
                                      the data shown here, several lines of evidence support this hypothesis: astrocytes exhibit Ca2+
                                      increases in response to many neuromodulators associated with decreased low-frequency power
                                      (Ding et al., 2013; Khan et al., 2001; Takata et al., 2011; Shelton and McCarthy, 2000) and corti-
                                      cal astrocytes have the ability to increase low-frequency power (Szabó et al., 2017; Poskanzer and
                                      Yuste, 2016). If, in fact, astrocyte Ca2+ events are ‘triggered’ by decreases in SWA, we would
                                      expect to observe more Ca2+ events when SWA is low, which we indeed found in the correlation
                                      analysis above (Figure 1D,H). While many other cell types may also play roles in a SWA homeostatic
                                      process, we wondered whether astrocytes may be involved in the consistent increase in SWA that
                                      we observe after astrocyte Ca2+ event onsets (Figure 2C). To address this question, we next used
                                      chemogenetics to specifically manipulate GPCR pathways that shape astrocyte Ca2+ dynamics.

Vaidyanathan et al. eLife 2021;10:e63329. DOI: https://doi.org/10.7554/eLife.63329                                                                   7 of 32
Research article Neuroscience
Gi-driven astrocyte Ca2+ increases are sufficient to increase SWA
during sleep
To test whether astrocyte Ca2+ may play a causal role in SWA control, we acutely manipulated corti-
cal astrocyte Ca2+, since genetic manipulations—such as IP3R2 KO—can lead to compensatory
developmental effects. Because IP3R2 can mediate the astrocyte-SWA relationship (Figures 1I and
2C–D), and both Gi- and Gq-GPCR mediated Ca2+ changes in astrocytes are dependent on the
IP3R2 pathway (Durkee et al., 2019; Mariotti et al., 2016; Nagai et al., 2019), we chose to use
Designer Receptors Exclusively Activated by Designer Drugs (DREADDs) (Roth, 2016) to selectively
manipulate GPCR pathways in astrocytes. The inhibitory neurotransmitter GABA has been implicated
in cortical synchrony during sleep through the mediation of synchronous DOWN states
(Lemieux et al., 2015; Sheroziya and Timofeev, 2014; Zucca et al., 2017) and the excitatory neu-
rotransmitter glutamate has been implicated in cortical UP states (Sanchez-Vives and McCormick,
2000; Poskanzer and Yuste, 2011). Astrocytes respond to both GABA and glutamate via Gi-GPCRs
(via GABAB and mGluR3 receptors in adults) (Durkee et al., 2019; Mariotti et al., 2016;
Nagai et al., 2019). Thus, we chose the inhibitory human M4 muscarinic receptor DREADD (hM4Di)
to selectively drive this well described Gi-GPCR pathway in astrocytes (Figure 3).
The same experimental setup as earlier (Figure 1A) was used, but mice were co-injected with
AAV-GFAP-GCaMP6f and AAV-GFAP-hM4D(Gi)-mCherry to express both GCaMP6f and Gi-
DREADD specifically in cortical astrocytes (Figure 3A–B, Figure 3—figure supplement 1). In these
experiments, we monitored the effects of I.P. administration of the hM4Di agonist clozapine-N-oxide
(CNO, 1 mg/kg) on Ca2+ dynamics, SWA, and sleep state. Because of the known sedative effects of
CNO, we first verified that CNO itself (1 mg/kg, I.P) did not alter Ca2+ dynamics or sleep features in
the absence of DREADD expression. We found no change in Ca2+ dynamics or sleep features
between administration of 1 mg/kg CNO and the saline control (Figure 3—figure supplement 2).
While Gi-DREADD has been used in astrocytes in vivo previously, its effects on astrocytic Ca2+ have
not yet been established during natural wake and/or sleep. Here, we confirmed that Gi-DREADD
activation indeed altered astrocyte Ca2+, causing an increase in event frequency across the entire 2
hr recording period after CNO administration (Figure 3C–D, Video 2). This finding is consistent with
studies of astrocytic Ca2+ activity in ex vivo slices and in anesthetized mice (Durkee et al., 2019;
Nagai et al., 2019; Chai et al., 2017). Next, we asked whether Gi-induced Ca2+ event increases
were sufficient to alter SWA. We found that activation of Gi-DREADDs by CNO significantly
increased SWA during sleep compared to a saline injection in the same animal (Figure 3E). In con-
trast, total time spent in sleep and wake was not affected by Gi-DREADD activation (Figure 3F,H).
Thus, although the total duration of sleep did not change, the sleep was characterized by higher
SWA, or greater sleep depth. Together, these data demonstrate that regulation of SWA and sleep
duration can be separated, and that astrocyte Ca2+, through Gi-GPCR activation, is sufficient to
increase SWA during sleep. We hypothesized that astrocytes were part of a homeostatic mechanism
regulating SWA, where in response to decreases in SWA, astrocyte Ca2+ causes an increase in SWA.
Here, we artificially increased Ca2+ beyond endogenous levels through Gi-GPCR signaling and found
we could drive SWA increases above control levels, consistent with the hypothesis that astrocytes
are part of a homeostatic mechanism that regulates SWA.
Because we found similar relationships between endogenous Ca2+ dynamics and SWA in sleep
and stationary wake (Figure 1H, Figure 2C–D), we next quantified the effect of Gi-GPCR activation
on SWA during wake. In contrast to the change in SWA during sleep (Figure 3E), we found no
change in SWA during the entire wake state (Figure 3G). Likewise, when calculating SWA only in the
stationary wake state, we observed no significant difference in SWA (Figure 3—figure supplement
1f). This negative result suggests that a different mechanism underlies the astrocyte-SWA relation-
ship in wake, and assigns the role of Gi-induced Ca2+ dynamics to regulating SWA specifically during
sleep. To investigate this difference, we performed PCA on the Ca2+ data collected after saline or
CNO administration. We found that CNO resulted in significantly larger differences in multiple PCs
for sleep relative to wake (Figure 3—figure supplement 3). This selective change in Ca2+ event
properties during sleep, but not wake, may explain the sleep-specific effects in SWA.
Because the astrocyte-SWA relationship is partly dependent on IP3R2s (Figures 1I and 2C–D), we
tested whether the effect of Gi-GPCR activation on SWA was also dependent on IP3R2s by repeating
these Gi-DREADD experiments in IP3R2 KO mice. Unlike control mice (Figure 3C–D), CNO
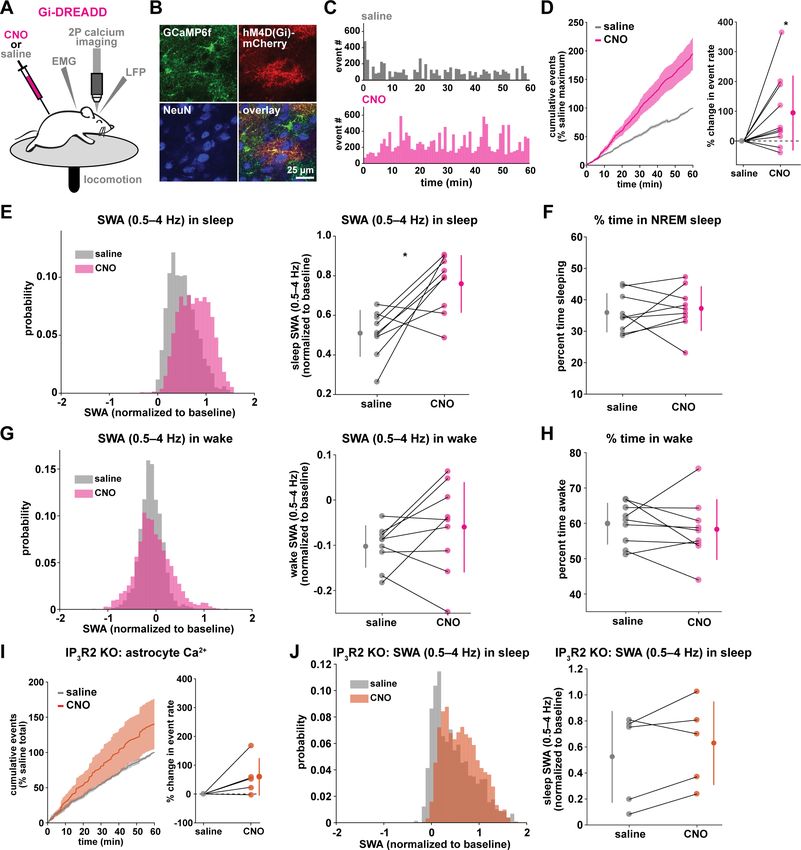
Vaidyanathan et al. eLife 2021;10:e63329. DOI: https://doi.org/10.7554/eLife.63329 8 of 32Research article Neuroscience Figure 3. Astrocytic Gi-DREADD-driven Ca2+ increases are sufficient to increase SWA during sleep. (A) Experimental setup. Mice were co-injected with GFAP-cyto-GCaMP6f and GFAP-hM4D(Gi)-mCherry AAVs. After I.P. injection of either 1 mg/kg CNO or saline, astrocyte Ca2+, LFP, EMG, and locomotion were recorded. (B) Post-experiment immunohistochemistry demonstrates astrocyte-specific expression of Gi-DREADD and GCaMP6f. mCherry+ cells (red) exhibit typical astrocyte morphology and do not co-localize with neurons (NeuN, blue). (C) Representative astrocyte Ca2+ response in one animal in which CNO (pink, bottom) causes increased Ca2+ events compared with saline (gray, top). (D) Left: Cumulative Ca2+ event count for all mice after CNO (pink) shows higher event rate compared to saline (gray). Error bars=SEM. (n = 10 mice, 1 hr recordings). Right: Change in event rate for each mouse with CNO compared to saline (paired t-test). For panels D–J, data are represented by the mean for each individual animal, and the Figure 3 continued on next page Vaidyanathan et al. eLife 2021;10:e63329. DOI: https://doi.org/10.7554/eLife.63329 9 of 32
Research article                                                                                                                   Neuroscience

Figure 3 continued
population as mean± SD. (E) Left: Administration of CNO (pink) results in rightward shift of the SWA distribution during sleep compared to saline (gray),
using 5 s bins. Right: Summary statistics, by animal, show increased SWA during sleep after CNO. (for panels E–H, n = 9 mice, 2 hr recordings, paired t-
test) (F) Percent time in NREM sleep does not differ between saline and CNO conditions. (G) Distribution of SWA (left) and summary statistics across
mice (right) show that SWA during wake, in contrast with sleep (E), is unchanged between conditions. (H) Percent time awake, similar to time in NREM
sleep (F), is similar between conditions. (I) CNO administration (orange) in IP3R2 KO mice expressing astrocytic Gi-DREADDs causes no significant
change in Ca2+ event number compared to saline (gray) as shown by the cumulative event count (left, error bars = SEM) and summary statistics per
mouse (right, paired t-test) (for experiments in I–J, n = 5 mice, 2 hr recordings). (J) Distribution of SWA during sleep (left) and summary statistics (right)
show that, in contrast to controls (E), sleep SWA is unchanged between saline (gray) and CNO (orange) conditions in IP3R2 KO mice (paired t-test).
The online version of this article includes the following figure supplement(s) for figure 3:
Figure supplement 1. Astrocyte-specific expression of Gi-DREADDs across ipsilateral and contralateral cortex.
Figure supplement 2. Systemic administration of CNO does not affect astrocyte Ca2+ dynamics, SWA, or sleep and wake behavior.
Figure supplement 3. PCA shows that Gi-DREADD activation causes increased changes in Ca2+ event properties during sleep compared to wake.

                                      administration did not significantly increase astrocyte Ca2+ in IP3R2 KO mice (Figure 3I), demonstrat-
                                      ing that Gi-DREADD-induced Ca2+ events rely, at least in part, on IP3R2. In accordance with the lack
                                      of change in Ca2+ in the IP3R2 KO animals, we also observed no significant change in SWA with
                                      CNO administration (Figure 3J), indicating that the change in sleep depth we observe (Figure 3E) is
                                      dependent on IP3R2.

                                      Gi-DREADD astrocyte activation regulates delta waves more than slow
                                      oscillations
                                      While NREM sleep is broadly characterized by SWA, it has become increasingly clear that there are
                                      two main types of slow waves: delta waves and slow oscillations (Genzel et al., 2014; Kim et al.,
                                      2019; Steriade et al., 1993; Steriade and Timofeev, 2003; Siclari et al., 2014; Dang-Vu et al.,
                                      2008; Bernardi et al., 2018). These two types of slow waves are characterized by different regula-
                                      tory mechanisms and are associated with distinct functions in NREM sleep. Delta waves are thought
                                      to promote the weakening of memories, while slow oscillations support memory consolidation
                                      (Genzel et al., 2014; Kim et al., 2019). In light of our finding that astrocytic Gi-GPCR-induced Ca2+
                                      is sufficient to increase sleep SWA (Figure 3E), we explored whether this increase could be attrib-
                                      uted to specific changes in delta waves or slow oscillations. A specific change could point to specific
                                      roles of astrocytic Gi-signaling in sleep. For this analysis, we implemented an established approach
                                      to distinguish delta waves and slow oscillations by their distinct waveforms (Kim et al., 2019). Slow
                                      oscillations had larger positive peaks and larger positive-to-negative deflections that occurred within
                                      500 ms (Figure 4A–B). Across recordings, slow
                                      oscillations and delta waves were differentiated
                                      by their peak and trough amplitudes using
                                      k-means clustering (Figure 4C).
                                          We first looked at the effect of astrocytic Gi-
                                      DREADD activation on the number of identified
                                      delta waves and slow oscillations, and found no
                                      effect on the rate of delta waves or slow oscilla-
                                      tions during sleep (Figure 4E). This negative
                                      result was expected by this analysis, because
                                      delta waves and slow oscillations were identified
                                      using amplitude percentile thresholds (see
                                      Materials and methods) that were set for each
                                      individual recording. However, when quantifying
                                      the amplitude of these waveforms, we noted
                                      increases in the mean amplitude, particularly for
                                                                                            Video 2. Ca2+ dynamics following Gi-DREADD-
                                      delta waves (Figure 4F,I). Indeed, by plotting activation. Example video of 20 min of elevated in vivo
                                      peak vs. trough amplitude, we observed a clear GCaMP activity in layer 2/3 V1 cortical astrocytes
                                      change in delta waves after CNO, resulting in expressing Gi-DREADDs after 1 mg/kg CNO
                                      higher peak and lower trough amplitudes administration. Frame rate = 30 Hz. Scale bar = 50 mm.
                                      (Figure 4G). This change was smaller in the slow https://elifesciences.org/articles/63329#video2

Vaidyanathan et al. eLife 2021;10:e63329. DOI: https://doi.org/10.7554/eLife.63329                                                                   10 of 32
Research article Neuroscience Figure 4. Astrocytic Gi-DREADD activation regulates local delta waves more than slow oscillations. (A) Mean of all identified slow oscillations (orange) and delta waves (cyan) (n = 31,966,966 delta waves, 7855 slow oscillations) in saline condition, including mean LFP amplitude filtered for high-gamma (gray, 80–100 Hz) demonstrating lower gamma during DOWN state and higher gamma during UP state (for panels A–C, n = 10 mice, 38 hr). (B) Peak amplitude separation between slow oscillations and delta waves. (C) Peak vs. trough amplitude for slow oscillations and delta waves is separable by K-means clustering (dashed line). (D) Left: Example of filtered LFP (0.1–4 Hz) for a 20-min recording. Slow oscillations (orange) and delta waves (cyan) indicated. Right: A 10 s window corresponding to the red box, with example waveforms of individual slow oscillations and delta waves. (E) Delta wave (left) and slow oscillation (right) rates do not change between conditions (for panels E; H, left; K, left; and L, data represented by mean for each animal, and the population as mean± SD, n = 9 mice 2 hr recordings, paired t-test). (F) Delta waves with CNO (cyan) show higher peak and trough amplitude compared with saline (gray) (saline: n = 10 mice, 16,467 waveforms; CNO: n = 9 mice, 15,499 waveforms). (G) Peak vs. trough amplitude for delta waves after CNO (cyan) is shifted compared with saline controls (gray) (for panels G; H, right; J; K, right, saline: n = 10 mice, 257 sleep periods, CNO: n = 9 mice, 246 sleep periods). (H) Left: Peak minus trough delta wave amplitude is higher with CNO. Right: Cumulative distribution reveals a leftward shift in the peak minus trough delta wave amplitude with CNO (two-sample Kolmogorov-Smirnov test). (I) Slow oscillations show minimal peak and trough amplitude change with CNO (orange) relative to saline (gray), compared with delta waves (F) (saline: n = 10 mice, 3995 waveforms, CNO: n = 9 mice, 3860 waveforms). (J) Peak versus trough amplitude for slow oscillations is similar between CNO (orange) and saline (gray) conditions, compared with Figure 4 continued on next page Vaidyanathan et al. eLife 2021;10:e63329. DOI: https://doi.org/10.7554/eLife.63329 11 of 32
Research article                                                                                                               Neuroscience

Figure 4 continued
delta waves (G). (K) Left: Peak minus trough slow oscillation amplitude shows a smaller, but significant, increase with CNO compared with delta waves
(H left). Right: Cumulative distribution reveals a minimal shift in the peak minus trough slow oscillation amplitude after CNO administration, compared
with delta waves (H, right) (two-sample Kolmogorov-Smirnov test). (L) Higher percent change for delta waves in peak minus trough amplitude with
CNO, compared to slow oscillations.
The online version of this article includes the following figure supplement(s) for figure 4:
Figure supplement 1. Gi-DREADD activation does not affect SWA in stationary wake, but changes peak and trough delta wave amplitude during
sleep.

                                     oscillation waveforms (Figure 4J). Similarly, we quantified the change in total peak – trough ampli-
                                     tude after CNO administration. While we saw a significant increase in size for delta waves
                                     (Figure 4H) and slow oscillations (Figure 4K) compared to saline controls in the same animal, the
                                     change in delta waves was significantly higher than that for slow oscillations (Figure 4L, Figure 4—
                                     figure supplement 1). Together, these data demonstrate that astrocyte Ca2+, through Gi-GPCR sig-
                                     naling, preferentially increases SWA by altering delta wave amplitude. Delta waves are more local
                                     than slow oscillations and are thought to be generated within the cortex (Genzel et al., 2014;
                                     Siclari and Tononi, 2017; Siclari et al., 2014; Bernardi et al., 2018; Spoormaker et al., 2010;
                                     Nir et al., 2011). Given that our Gi-astrocytic manipulation is restricted to a small portion of cortex
                                     (Figure 3—figure supplement 1), the result that astrocytic Gi-DREADD activation affects delta
                                     waves more than slow oscillations may indeed be expected.

                                     Cortical astrocyte Ca2+ dynamics exhibit bidirectional changes before
                                     sleep/wake transitions
                                     We next wondered whether astrocytes might play a role beyond the regulation of sleep depth, to
                                     also influence sleep duration. Data here (Figure 2) suggest that a component of astrocyte signaling
                                     may be important for sleep/wake state transitions, which would directly affect sleep duration. To
                                     study these transitions, we first examined endogenous cortical astrocyte Ca2+ dynamics in the 30 s
                                     leading up to transitions between sleep or wake. We found a pattern in which Ca2+ events consis-
                                     tently increased before the sleep-to-wake transition and decreased before the wake-to-sleep transi-
                                     tion (Figure 5A). This is supported by a recent study that demonstrated, using an alternative image
                                     analysis technique, that Ca2+ increases preceding sleep-to-wake transitions (Bojarskaite et al.,
                                     2020). We next divided all sleep and wake periods, regardless of length, into three equal bins
                                     (Figure 5C). This allowed us to study how astrocyte Ca2+ dynamics generally change throughout a
                                     sleep or wake period. In so doing, we found that Ca2+ event rate increased in the last third of sleep
                                     and decreased in the last third of wake (Figure 5D). Since Ca2+ event rate is higher during wake
                                     than sleep (Figure 1F) and Ca2+ events occur after dips in SWA (Figure 2C), the increase in event
                                     rate preceding the transition to wake could reflect a gradual shift in SWA to a wake state. In fact,
                                     various ascending brainstem neuromodulatory neurons associated with wakefulness have been
                                     shown to increase firing prior to the transition to wake and decrease firing prior to the transition to
                                     sleep (Takahashi et al., 2006; Eban-Rothschild et al., 2016; Aston-Jones and Bloom, 1981;
                                     Lee et al., 2005; Trulson and Jacobs, 1979). Astrocytes express receptors and exhibit increased
                                     Ca2+ dynamics in response to many of these neuromodulators (Ding et al., 2013; Khan et al., 2001;
                                     Takata et al., 2011; Shelton and McCarthy, 2000). Thus, this change in event rate prior to sleep/
                                     wake transitions may be due to neuromodulator-driven GPCR signaling in astrocytes.
                                        We reasoned that if the Ca2+ dynamics observed around state transitions were due to astrocytic
                                     GPCR signaling, we would expect that these Ca2+ dynamics would be altered in IP3R2 KO mice. As
                                     predicted, we found that the changes in event rate preceding transitions were abolished in IP3R2
                                     KO mice (Figure 5B). When quantifying the change in event rate in the last third of sleep and wake
                                     for IP3R2 KO mice, we found that IP3R2 KO mice did not exhibit the same increase in event rate in
                                     the last third of sleep (Figure 5D, left). However, the change in event rate observed during wake
                                     was unchanged in IP3R2 KO mice (Figure 5D, right), suggesting a specific role of IP3R2s in sleep.
                                     Since Gi-DREADD activation did not affect sleep duration (Figure 3F), we next tested the hypothesis
                                     that Gq-GPCR-mediated Ca2+ signaling in astrocytes regulates sleep/wake transitions.

Vaidyanathan et al. eLife 2021;10:e63329. DOI: https://doi.org/10.7554/eLife.63329                                                              12 of 32
Research article Neuroscience
Figure 5. Cortical astrocyte Ca2+ dynamics exhibit bidirectional changes preceding sleep and wake transitions.
(A) Within each individual sleep/wake period, the proportion of all astrocyte Ca2+ events increases before
transitions to wake (red) and decreases before transitions to sleep (blue). Error bars=SEM. (B) In contrast, the
proportion of all Ca2+ events in a sleep or wake period in IP3R2 KO mice does not consistently change preceding
transitions. Error bars=SEM. (C) Example filtered LFP (0.5–4 Hz) trace across sleep (NREM) and wake transitions. All
sleep (red) and wake (blue) periods were divided in three equal bins to examine Ca2+ dynamics across individual
behavioral states. (D) Change in Ca2+ event number across sleep and wake periods show an increase in event
number in the last third of sleep (left) and a decrease in the last third of wake (right) (paired t-test). Change in Ca2+
event number across sleep periods (left) increases in the last third for control, but not IP3R2 KO mice (unpaired t-
test). Data are represented as mean± SEM (controls: n = 4 mice, 19 hr; IP3R2 KO = 5 mice, 22 hr).
Gq-DREADD activation suppresses astrocyte Ca2+ dynamics in vivo
To drive the astrocytic Gq-GPCR pathway and test for a role of astrocyte Ca2+ in mediating sleep/
wake transitions, we selectively expressed the human M3 muscarinic receptor DREADD (hM3Dq) in
astrocytes. We were also motivated by the knowledge that neuromodulatory signals play an impor-
tant role in mediating sleep and wake transitions (Holst and Landolt, 2018; Saper and Fuller,
2017; Lee and Dan, 2012; Scammell et al., 2017), and many of these endogenous signals can act
at Gq-GPCRs in astrocytes (Zhang et al., 2014; Chai et al., 2017). We used a similar approach as
above (Figure 3A), but here selectively expressed GCaMP6f and the Gq-DREADD in astrocytes
(Figure 6A–B, Figure 6—figure supplement 1). As above, we imaged astrocyte Ca2+ after I.P. CNO
administration to confirm the effect of Gq-DREADD activation on Ca2+ activity in vivo. Although
astrocytic Gq-DREADD activation in vivo has been performed previously (Durkee et al., 2019;
MacDonald et al., 2020; Bonder and McCarthy, 2014; Adamsky et al., 2018), validation of Gq-
Vaidyanathan et al. eLife 2021;10:e63329. DOI: https://doi.org/10.7554/eLife.63329 13 of 32Research article Neuroscience Figure 6. Gq-induced Ca2+ is necessary for sleep-wake transitions. (A) Experimental setup. Mice were co-injected with GFAP-cyto-GCaMP6f and GFAP-hM3D(Gq)-mCherry AAVs. After I.P. injection of either 1 mg/kg CNO or saline, 2P astrocyte Ca2+ dynamics, LFP, EMG, and locomotion were recorded. (B) Post-experiment immunohistochemistry demonstrates astrocyte-specific expression of the Gq-DREADD (red) and GCaMP6f (green). mCherry+ cells exhibit typical astrocyte morphology and do not co-localize with neurons (blue, NeuN). (C) Representative data from a single Gq- DREADD-expressing animal. Administration of CNO (blue) causes a short initial period of elevated Ca2+ relative to saline administration (gray), followed by a complete suppression of all Ca2+ activity. (D) Cumulative Ca2+ event count after saline (gray) or CNO (blue) injection over 60 min. The initial high Ca2+ period (8 min, light gray box) is followed by suppression of astrocyte Ca2+. (Error bars=SEM, n = 3 mice, 1 hr recordings) (E) Left: The proportion of time mice spend sleeping after CNO administration (during Ca2+ suppression period) is increased relative to saline controls, and time in wake is decreased (right), suggesting Ca2+ suppression is sufficient to increase sleep (for E–F, and H, paired t-test, n = 11 mice; analyses are performed in the 1 hr, 52-min period of Ca2+ suppression). (F) Sleep-to-wake transitions (left) and wake-to-sleep transitions (right) are decreased with CNO relative to saline. (G) During the high Ca2+ period after CNO administration, mice spend less time sleeping compared to saline-injected controls (paired t-test), suggesting the Gq-DREADD-driven Ca2+ increase is sufficient to suppress sleep (n = 4 mice, for E–H, data are represented as mean for each animal and population mean± SD). (H) Distribution of SWA (left) and summary statistics (right) show that despite Ca2+ changes, SWA during sleep is unaffected by Gq-DREADD activation. (n = 8 mice, paired t-test). The online version of this article includes the following figure supplement(s) for figure 6: Figure supplement 1. Astrocyte-specific expression of Gq-DREADDs across ipsilateral and contralateral cortex. Figure supplement 2. Gq-DREADD activation suppresses sleep-wake transitions by increasing bout length and decreasing bout number. Vaidyanathan et al. eLife 2021;10:e63329. DOI: https://doi.org/10.7554/eLife.63329 14 of 32
Research article                                                                                                        Neuroscience

                                   DREADD-mediated astrocytic Ca2+ increases has only been performed under anesthesia or ex vivo,
                                   in part because several in vivo astrocyte DREADD experiments have been carried out in brain
                                   regions that are less accessible than cortex (MacDonald et al., 2020; Adamsky et al., 2018). Thus,
                                   the effect of Gq-DREADD activation on Ca2+ in awake mice has not been previously reported.
                                   Canonically, Gq-GPCR signaling results in an increase in Ca2+ activity via IP3-dependent release of
                                   intracellular Ca2+ (Petravicz et al., 2008). However, we were surprised to find that Ca2+ dynamics
                                   only increased in the first 5–10 min after I.P. injection of CNO (150.9% ± 135.9, Video 3). After this
                                   initial period of increased Ca2+ events, Ca2+ dynamics were almost completely abolished ( 97.3% ±
                                   0.79%, Figure 6C–D, Figure 6—figure supplement 1H, Video 3). This ‘silent’ state of Ca2+ dynam-
                                   ics lasted for the rest of the entire recording (2–3 hr).
                                       To test whether this unexpected result was due to CNO concentration (1 mg/kg), we adminis-
                                   tered lower doses of CNO. While the initial period of increased Ca2+ dynamics was slightly longer
                                   (15–20 min) following administration of a ten-fold lower dose of CNO (0.1 mg/kg), this very low
                                   dose still resulted in a strong reduction in Ca2+ events for long time periods (Figure 6—figure sup-
                                   plement 1F–h). The observed inhibition of astrocyte Ca2+ could be due to depletion of intracellular
                                   Ca2+ stores and/or interference with store-operated Ca2+ channels (Sakuragi et al., 2017). To com-
                                   pare the inhibition of Ca2+ events with changes in fluorescence, we used an ROI-based approach to
                                   analyze fluorescence in somas and processes after CNO administration. We found that fluorescence
                                   in both somas and processes remained elevated above baseline after 1 mg/kg CNO (Figure 6—fig-
                                   ure supplement 1I), which suggests that Ca2+ levels may be clamped at saturating levels. Together,
                                   these results indicate that (1) we cannot assume that Gq-DREADD activation simply increases astro-
                                   cytic Ca2+ in vivo, and (2) when feasible, astrocytic experiments using chemogenetics in vivo should
                                   be validated individually, particularly for those involving circuit function and animal behavior.
                                       To test whether the astrocytic Ca2+ silencing we observed following Gq-DREADD activation could
                                   be reproduced with endogenous GPCR signaling, we measured Ca2+ activity in ex vivo cortical slices
                                   in response to a cocktail of neuromodulators associated with wakefulness, including norepinephrine,
                                   acetylcholine, dopamine, and histamine. We adapted methodology (Ding et al., 2016), using half
                                   the concentration of each neuromodulator as previously, since each experiment involved two total
                                   applications of this ‘wake cocktail’ (20 mM norepinephrine, 5 mM acetylcholine, 5 mM dopamine, 2.5
                                   mM histamine). We also included TTX in the circulating bath to block neuronal firing. As predicted
                                   from previous studies reporting astrocytic Ca2+ increases to various neuromodulators (Ding et al.,
                                   2013; Khan et al., 2001; Takata et al., 2011; Shelton and McCarthy, 2000; Pankratov and Lalo,
                                   2015), we observed a dramatic increase in Ca2+ activity in response to the cocktail (Figure 6—figure
                                   supplement 1J). However, after this initial
                                   increase in Ca2+, GCaMP fluorescence did not
                                   return to baseline levels, but remained high and
                                   further Ca2+ events were almost completely
                                   absent (Figure 6—figure supplement 1J), simi-
                                   lar to in vivo dynamics observed 5–10 min after
                                   CNO administration. To test whether this ‘silent’
                                   state altered the astrocytic response to further
                                   neuromodulatory input, we bath-applied a sec-
                                   ond round of the wake cocktail. In contrast to
                                   the initial Ca2+ increase, we observed no further
                                   increase in astrocyte Ca2+ (Figure 6—figure
                                   supplement 1J). We speculate that the mecha-
                                   nism underlying the inability of astrocytes to
                                   respond to a second dose of wake cocktail may
                                   be similar to that underlying the inhibition of
                                                                                          Video 3. Ca2+ dynamics following Gq-DREADD-
                                   Ca2+ dynamics in vivo in response to circulating
                                                                                          activation. Example video of 20 min of in vivo GCaMP
                                   CNO.
                                                                                          activity in layer 2/3 V1 cortical astrocytes expressing
                                                                                          Gq-DREADDs. Video begins immediately after 1 mg/kg
                                   Gq-induced Ca2+ dynamics                               CNO administration, demonstrating the initial period
                                   regulate sleep-wake transitions                        of elevated Ca2+, followed by almost complete Ca2+
                                   The finding that Gq-DREADD chemogenetics               suppression. Frame rate = 30 Hz. Scale bar = 50 mm.
                                   can inhibit an intracellular GPCR signaling            https://elifesciences.org/articles/63329#video3

Vaidyanathan et al. eLife 2021;10:e63329. DOI: https://doi.org/10.7554/eLife.63329                                                      15 of 32
Research article Neuroscience
pathway in astrocytes makes this is a particularly useful tool for understanding astrocytes’ roles in
cortical state regulation. To investigate whether astrocytes regulate sleep duration, we focused on
the long period of Ca2+ suppression in these experiments. We found that mice spent significantly
more time in sleep after CNO administration (Figure 6E, left). Further, in the absence of Gq-GPCR-
mediated Ca2+ events, mice made fewer sleep-to-wake transitions (Figure 6F, left) and accordingly,
we observed fewer sleep bouts of longer duration (Figure 6—figure supplement 2A). This suggests
that the IP3R2-dependent increase in event rate prior to sleep-to-wake transitions (Figure 5) is
important to transition the cortex to the wake state. The transition data (Figure 5) also showed that
endogenous Ca2+ decreases toward the end of wake periods, just prior to wake-to-sleep transitions
(Figure 5). Thus, we wondered whether Ca2+ suppression via Gq-DREADDs would affect wake as
well. We observed a decrease in the percent time awake (Figure 6E, right), as predicted by the
increase in sleep observed (Figure 6E, left). However, we also observed less frequent transitions out
of wake, demonstrating that astrocyte Ca2+ is important for both wake-to-sleep transitions
(Figure 6F, right), and sleep-to-wake transitions (Figure 6F, left). As predicted from the decrease in
transitions, we also observed fewer wake bouts and wake bouts of longer duration (Figure 6—figure
supplement 2B). We hypothesize that decreased astrocytic Ca2+ prior to wake-to-sleep transitions
(Figure 5) is important for the transition to sleep, but astrocytes were unable to make this significant
decrease due to clamped Ca2+ in these experiments.
If Gq-GPCR signaling is an important bidirectional regulator of sleep/wake transitions, we would
expect that increases in Gq-GPCR signaling to have the opposite effect from decreased Gq-GPCR
Ca2+ signaling. We thus used data from the short, initial period with elevated Ca2+ activity to ask
whether this is the case. Because this period is so short (5–10 min), we were somewhat limited in our
analysis. However, of the animals that exhibited some sleep in either the CNO or saline condition
(n = 4), we observed a significant decrease in the percent time sleeping (Figure 6G). This bidirec-
tional change in sleep time strongly supports the hypothesis that Gq-GPCR-mediated Ca2+ plays a
critical role in regulating sleep duration. Interestingly, we did not observe a change in the amount of
sleep with Gi-GPCR activation (Figure 3F), which similarly increased Ca2+ dynamics. This difference
between Gq- and Gi-mediated Ca2+ increases indicates an important functional dissociation
between Gq- and Gi-GPCR-mediated Ca2+ activity in astrocytes and highlights the likelihood that
other signaling molecules involved in GPCR signaling cascades play roles in regulating sleep-wake
transitions. Because we observed a significant increase in sleep depth in response to the Ca2+
increase with Gi-DREADDs (Figure 3E), we also wondered whether Ca2+ suppression via Gq-
DREADDs would have an opposing effect. In contrast to manipulation of the Gi-GPCRs, we found
that Ca2+ suppression via Gq-GPCR manipulation had no significant effect on SWA during sleep
(Figure 6H). This suggests that astrocytic regulation of SWA is specifically dependent on the Gi-
GPCR pathway and provides further evidence that astrocytic Gi- and Gq-GPCR signaling regulate
separable sleep/wake features.
Local Gi-DREADD activation of cortical astrocytes can drive changes in
remote cortical sleep features
SWA during NREM sleep is considered a widespread phenomenon, involving the synchronization of
neurons across the entire cortex. While widespread oscillatory activity has been observed in several
animal models (Lemieux et al., 2015; Amzica and Steriade, 1995), recent work has also empha-
sized the existence of more local and asynchronous sleep (Genzel et al., 2014; Huber et al., 2004;
Funk et al., 2016; Siclari and Tononi, 2017; Bernardi et al., 2018; Nir et al., 2011). The morphol-
ogy and interconnectedness of cortical astrocytes and astrocytic networks make them well posi-
tioned to mediate neural activity across broad swaths of cortex. Cortical astrocytes are non-
overlapping, in all cortical layers, gap junctionally coupled, and contain highly ramified processes
that can contact tens of thousands of synapses (Halassa et al., 2007). We therefore wondered how
they may be involved in both local and remote changes in cortical synchronization in sleep. To
address this question, we implanted a second electrode to record EEG in the contralateral frontal
cortex (FC-EEG, Figure 7A). This second electrode was far (both rostral-caudally and medial-lat-
erally) from the imaging window/LFP electrode in V1, but still over cortex (Figure 7A, Figure 3—fig-
ure supplement 1, Figure 6—figure supplement 1).
Vaidyanathan et al. eLife 2021;10:e63329. DOI: https://doi.org/10.7554/eLife.63329 16 of 32Research article Neuroscience
A 2P calcium B
imaging
V1-LFP
0.5 mV
LFP FC-EEG
EMG
50 s
imaging
window contralateral
FC-EEG 0.5 mV
reference LFP
50 s
V1 astrocyte
Ca2+ events
locomotion 5 events
50 s
C D E
0.5–4 Hz power (normalized)
1.04
1.03 0.5 ** astrocyte-aligned 0.40 **
FC-EEG and V1-LFP
FC-EEG and V1-LFP
randomly aligned astrocyte-locked
1.02 0.4 0.35 randomly locked
coherence
coherence
1.01
0.3 0.30
1.00
0.99 0.2 0.25
0.98 LFP
EEG 0.1 0.20
0.97
0.96 0 0.15
-4 -3 -2 -1 0 1 2 3 4 0 5 10 15 20 25 30 35 40 -30 -25 -20 -15 -10 -5 0
time from Ca2+ event onset (s) frequency (Hz) time before S→W transition (s)
F 20
LFP: saline 20
LFP: CNO
frequency (Hz)
0
LFP saline
2 LFP CNO
normalized to baseline
10 10 EEG saline
SWA (0.5–4 Hz)
EEG CNO
1
-10
0 0
0 10 20 30 40 50 60 0 10 20 30 40 50 60
0
20 EEG: saline 20 EEG: CNO
frequency (Hz)
0
-1
10 10 25 30 35 40 45 50
time (min)
-10
0 0
0 10 20 30 40 50 60 0 10 20 30 40 50 60
time (min) time (min)
G FC SWA (0.5–4 Hz) in sleep FC SWA (0.5–4 Hz) in sleep
H SWA (0.5–4 Hz) increase
0.20 0.6 0.7
(normalized to baseline)
saline
CNO * 0.6 **
0.15
SWA in sleep
probability
0.5
(CNO - saline)
SWA change
0.4
0.4
0.10
0.3
0.2 0.2
0.05
0.1
0
0
-1 -0.5 0 0.5 1 1.5 2 0 V1-LFP FC-EEG
-0.1
SWA (normalized to baseline) saline CNO
I FC-EEG delta FC-EEG slow oscillation
J
25 *
amplitude (CNO vs. saline)
n.s.
% change in peak-trough
2.6 4.5 **
peak - trough amplitude
peak - trough amplitude
* 20
2.4
4.0 15
2.2 10
3.5
2.0 5
3.0 0
1.8
-5
1.6 2.5 FC V1 FC V1
saline CNO saline CNO delta delta SO SO
Figure 7. V1 manipulation of astrocyte Ca2+ alters SWA in contralateral frontal cortex via changes in slow oscillations. (A) Experimental setup. Mice
were co-injected with GFAP-cyto-GCaMP6f and GFAP-hM4D(Gi)-mCherry AAVs. 2P astrocyte Ca2+ dynamics in right V1, LFP local to the imaging field,
EEG in the contralateral frontal cortex (orange), EMG, and locomotion were recorded. (B) Representative data from simultaneous recordings from V1-
LFP (black), contralateral frontal cortex EEG (orange), and V1 astrocyte Ca2+ imaging (green). (C) Average V1-Ca2+ event-triggered traces of FC-EEG
Figure 7 continued on next page
Vaidyanathan et al. eLife 2021;10:e63329. DOI: https://doi.org/10.7554/eLife.63329 17 of 32You can also read