THE PATTERNS OF ELEMENTAL CONCENTRATION (CA, NA, SR, MG, MN, BA, CU, PB, V, Y, U AND CD) IN SHELLS OF INVERTEBRATES REPRESENTING DIFFERENT CACO3 ...
←
→
Page content transcription
If your browser does not render page correctly, please read the page content below
Biogeosciences, 18, 707–728, 2021
https://doi.org/10.5194/bg-18-707-2021
© Author(s) 2021. This work is distributed under
the Creative Commons Attribution 4.0 License.

The patterns of elemental concentration (Ca, Na, Sr, Mg, Mn, Ba,
Cu, Pb, V, Y, U and Cd) in shells of invertebrates representing
different CaCO3 polymorphs: a case study from the brackish
Gulf of Gdańsk (the Baltic Sea)
Anna Piwoni-Piórewicz1 , Stanislav Strekopytov2,a , Emma Humphreys-Williams2 , and Piotr Kukliński1,3
1 Instituteof Oceanology, Polish Academy of Sciences, Sopot, 81-712, Poland
2 Imaging  and Analysis Centre, Natural History Museum, London, SW7 5BD, United Kingdom
3 Department of Life Sciences, Natural History Museum, London, SW7 5BD, United Kingdom
a current address: National Measurement Laboratory, LGC Limited, Teddington, TW11 0LY, United Kingdom

Correspondence: Anna Piwoni-Piórewicz (apiwoni@iopan.pl)

Received: 10 September 2019 – Discussion started: 20 September 2019
Revised: 6 November 2020 – Accepted: 9 December 2020 – Published: 29 January 2021

Abstract. The shells of calcitic arthropod Amphibalanus           1   Introduction
improvisus; aragonitic bivalves Cerastoderma glaucum,
Limecola balthica, and Mya arenaria; and bimineralic bi-          Marine invertebrates such as molluscs, brachiopods, corals,
valve Mytilus trossulus were collected in the brackish waters     echinoderms, bryozoans and some groups of protozoa
of the southern Baltic Sea in order to study patterns of bulk     (foraminifera) are able to form skeletons built of calcium car-
elemental concentration (Ca, Na, Sr, Mg, Ba, Mn, Cu, Pb, V,       bonate. The combination of inorganic CaCO3 crystals and or-
Y, U and Cd) in shells composed of different crystal lattices     ganic compounds with a characteristic and ordered structure,
(calcite and aragonite). The factors controlling the elemental    mainly polymers, creates a composite strengthening mate-
composition of shells are discussed in the context of crys-       rial. As a result of long-term adaptation, calcifiers are armed
tal lattice properties, size classes of organisms and potential   with hard protective internal and external body parts such
environmental differences between locations. Clams that pre-      as shells, tubes, walls, or plates of various colours, shapes,
cipitate fully aragonitic shells have a clear predominance of     and functions. The biogenic CaCO3 is deposited mainly in
Sr over Mg in shells, contrary to predominant accumulation        the form of two polymorphs: calcite and aragonite, which in
of Mg over Sr in calcitic shells of barnacles. However, the       some taxa are found co-existing in the same specimen and
barnacle calcite shell contains higher Sr concentration than      appear to be precipitated in the same environment (Cusack
bivalve aragonite. The elemental variability between size-        and Freer, 2008; Morse et al., 2007; Taylor et al., 2008; Stan-
grouped shells is different for each studied species, and the     ley, 2008). Furthermore, various trace elements, especially
elemental concentrations tend to be lower in the large size       those forming divalent ions – mainly Mg and Sr, as well as
classes compared to the smaller size classes. Biological dif-     Mn, Br, Cd, Cu, Pb, V, etc. – are present as impurities in
ferences between and within species, such as growth rate,         skeletons. The major sources of trace elements for organisms
feeding strategy (including feeding rate and assimilation effi-   during the calcification process are aquatic soluble phases
ciency or composition) and contribution of organic material,      and the food base that may consist of suspended and/or sedi-
seem to be important factors determining the elemental ac-        mented particles (Newman and Unger, 2003; Rainbow, 1995;
cumulation in shells. Because specimens used in this study        Rainbow and Phillips, 1993). However, the bioavailability of
were obtained from different sampling sites within the gulf,      trace elements depends on a combination of environmental
the impact of location-specific environmental factors, such as    (e.g. salinity, pH, sediment type, and oxygen conditions) and
sediment type, cannot be excluded.                                chemical factors (e.g. element–particle binding strength, the

Published by Copernicus Publications on behalf of the European Geosciences Union.
708                          A. Piwoni-Piórewicz et al.: The patterns of elemental concentration in shells of invertebrates

composition of particle, and the presence of other trace ele-      organisms that secrete calcareous skeletons have shown that
ments and compounds; Blackmore and Wang, 2002).                    lower seawater temperatures are correlated with the secretion
   Biological carbonates determine a very important compo-         of calcite skeletons with low Mg contents rather than more
nent of the hydrosphere’s carbon reservoir, and the biogenic       soluble high-Mg calcite or aragonite skeletons (Taylor and
production of CaCO3 has a strong interdependence on the            Reid, 1990). The mineralogy of many calcareous structures
ocean composition, biogeochemistry and the carbon cycle            changes with latitude, likely as a result of the temperature
(Cohen and McConnaughey, 2003). In the last few decades,           gradient from the poles to the Equator (Kuklinski and Tay-
increasing attention has been paid to the relationship between     lor, 2009; Loxton et al., 2014; Taylor et al., 2014). Thermo-
the composition of shells and external environmental factors.      dynamics predicts that aragonite is the stable phase at pres-
It has been repeatedly observed that the mineral type and ac-      sures higher than 5000 hPa (roughly 40 m depth), and calcite
cumulated trace element concentrations in CaCO3 shells of          is the stable phase at lower pressures. However, aragonite
marine invertebrates are integrated records of environmental       is still the major constituent of shells or pearls, indicating
conditions (Marchitto et al., 2000; Rodland et al., 2006). The     its metastable formation in shallow waters (Sunagawa et al.,
elemental composition of the carbonate skeleton can provide        2007). The incorporation of Sr was suggested to play a sig-
records of seawater chemistry and has a significant potential      nificant role in the biomineralogical precipitation of arago-
for the fields of palaeoceanography and palaeoclimatology          nite (Allison et al., 2001). Many studies have demonstrated a
(Freitas et al., 2006; Gillikin et al., 2006; Khim et al., 2003;   clear correlation between the concentration of Sr in the hard
Ponnurangam et al., 2016; Vander Putten et al., 2000). How-        parts and precipitation of the aragonite layer (Iglikowska et
ever, as recent studies have indicated (Dove, 2010), the in-       al., 2016; Reeder, 1983). The ionic radius of Sr is larger than
fluence of environmental parameters on shell precipitation         that of Ca; thus, Sr is more likely to form ninefold coordina-
could be very complex. The mineralogy and chemistry of             tion, which triggers metastable aragonite nucleation (Suna-
shells are likely to be both linked to environmental condi-        gawa et al., 2007).
tions and controlled by the organism itself. Even a single            Many studies have demonstrated that the biological con-
population or closely related species within the same habi-        trol of shell composition is often more important than the en-
tat may exhibit different accumulation strategies (Rainbow         vironmental control (Carré et al., 2006; Freitas et al., 2005,
et al., 2000).                                                     2006; Gillikin, 2005; Gillikin et al., 2005b). Elements incor-
   Due to its spatial structure, aragonite shows preferential      porated into skeletons originate from the environment, yet as
substitution with larger cations, such as Sr, while smaller        some of them are the components of enzymes or body flu-
cations, such as Mg, are energetically favoured in calcite. In     ids, the trace element pathway to the skeleton can be altered
natural systems, calcite commonly incorporates Mg (Morse           by the biological processes (Cubadda et al., 2001; Luoma
et al., 2007; Reeder, 1983; Wang and Xu, 2001), and the sol-       and Rainbow, 2008), which can affect the relationship be-
ubility of Mg-containing calcite is known to increase with in-     tween the concentrations of a given trace element between
creasing Mg substitution (Kuklinski and Taylor, 2009; Smith        skeleton and environment. In biologically controlled miner-
et al., 2006). At the temperatures and pressures of the Earth’s    alization, the organism drives the process of nucleation and
surface, low-Mg calcite is the most stable form of CaCO3 (de       growth of the minerals in a way that is not entirely dependent
Boer, 1977). Nevertheless, in many marine organisms, arag-         on the environmental conditions. Endogenous factors man-
onite and high-Mg calcite are the dominant phases precipi-         ifest themselves through co-regulation of all the structures
tated from seawater (Dickson, 2004). The solution chemistry        and functions of the organism, including its sex, growth rate,
(Cusack and Freer, 2008), temperature (Balthasar and Cu-           metabolism and feeding strategy (Lowenstam and Weiner,
sack, 2015), pressure (Allison et al., 2001), CaCO3 saturation     1989). The main physiological processes involved in ele-
state (Watson et al., 2012), pCO2 (Lee and Morse, 2010) and        ment accumulation are ingestion, assimilation, elimination
phylogenesis (Kuklinski and Taylor, 2009; Smith et al., 1998;      and growth (Wang and Fisher, 1997). Throughout the lifes-
Smith and Girvan, 2010) are known to influence shell miner-        pan, the biological system experiences ontogenetic trends
alogy. The main driving force controlling the mineralogy of        and seasonal variations in physiology, determining metabolic
precipitated CaCO3 is the ratio of Mg to Ca ions in seawa-         expenses based on life’s needs. Biological effects have been
ter (Cusack and Freer, 2008; Morse et al., 2007). A Mg/Ca          repeatedly used to explain shifts of elemental concentrations
ratio > 2 favours the precipitation of aragonite and high-         in shells from a theoretical equilibrium (Davis et al., 2000;
Mg calcite. At high Mg/Ca ratios, such as those in modern          Roger et al., 2017; Watson et al., 1995). Ontogenetic fluc-
seawater (Mg/Ca = 5.2), calcitic structures incorporate Mg,        tuations of the growth rate and metabolic activity affect the
which is observed to inhibit calcite nucleation and growth,        intensity of the element uptake (Lee et al., 1998). Vander Put-
whereas aragonite nucleation is not affected by Mg in solu-        ten et al. (2000) concluded that the seasonality of the accu-
tion (De Choudens-Sanchez and Gonzalez, 2009; Morse et             mulation of Mg, Sr and Pb in Mytilus edulis shells shows sig-
al., 2007). Most taxa producing low-Mg calcite are known           nificant similarity across individuals, with a maximum dur-
to actively control the amount of incorporated Mg (Bentov          ing spring and early summer, and that the elemental profiles
and Erez, 2005; De Nooijer et al., 2014). Several studies of       cannot be explained by seasonal variations in the seawater

Biogeosciences, 18, 707–728, 2021                                                      https://doi.org/10.5194/bg-18-707-2021
A. Piwoni-Piórewicz et al.: The patterns of elemental concentration in shells of invertebrates                                  709

composition. Carré et al. (2006) developed a model of ion           varying from approximately 5.5 in summer to 8.4 in winter
transport in bivalve shells that shows that Ca2+ channels are       (Bulnheim and Gosling, 1988; Szefer, 2002).
less ion selective when Ca2+ fluxes are higher. Other studies          The Gulf of Gdańsk is an area highly influenced by human
have found that the rate of trace element uptake increases as       activities. This is due to intensive usage of its resources and
mussel filtration rate increases (Janssen and Scholtz, 1979).       to anthropogenic emissions originating from various coastal
   The aim of this study is to assess the patterns of elemental     sources, river inflows and atmospheric deposition. The most
variability (Ca, Na, Sr, Mg, Mn, Ba, Cu, Pb, V, Y, U and Cd)        significant input of industrial and municipal pollution into
in shells of mussels and barnacles representing three possi-        the gulf is derived from the Vistula river, which transports
ble mineralogical forms. The selected species are aragonitic        pollutants from a catchment area of 194 000 km2 (Pruszak et
clams Cerastoderma glaucum, Mya arenaria, and Limecola              al., 2005). Both the water discharge and sediment load into
balthica; bimineralic mussel Mytilus trossulus; and barnacle        the gulf are strongly seasonally dependent. Because of the
Amphibalanus improvisus with a fully calcitic shell, which          local conditions, mainly the limited water exchange, river-
are all collected from the low-salinity environment of the          borne contaminants remain in the ecosystem for decades, ac-
southern Baltic Sea. A comparison of elemental concentra-           cumulating in the sediments and in living organisms (Glasby
tion levels between size classes is also performed. Assuming        et al., 2004; Szumiło-Pilarska et al., 2016).
the larger specimens are older than the smaller specimens              Most regions of the Baltic Sea have lower salinity and al-
of the same species, we assess how different ontogenetical          kalinity (that is, lower Ca2+ and CO2− 3 concentrations) than
stages influence elemental accumulation. The potential in-          oceanic surface waters (Beldowski et al., 2010; Cai et al.,
fluence of biological control and local environmental con-          2010; Findlay et al., 2008). Due to the seasonality of tem-
ditions on the observed element concentrations in shells is         perature and biogeochemical cycle, the amplitude of CaCO3
briefly discussed. The study area offers a variety of fluctu-                              [Ca2+ ]×[CO2− ]
                                                                                                      3            ∗ is a solubility
                                                                    saturation state ( =          ∗
                                                                                                 Ksp     , where Ksp
ating factors, giving the opportunity to increase our under-
standing of elemental variation patterns of skeletons formed        product of calcite or aragonite under in situ conditions; e.g.
in the area. Brackish waters affect the activity and specia-        Kawahata et al., 2019) in the Baltic Sea is high in comparison
tion of elements, enhancing their bioavailability (Fritioff et      to saline waters. It alternates between approximately 1 to 5
al., 2005). The seasonal changes (e.g. surface temperature,         for calcite and 0.5 to 2.5 for aragonite (Findlay et al., 2008).
primary production and freshwater inflow) determine the el-            The community of calcifiers from the Gulf of Gdańsk
ement sources and drive the physiological processes of living       is characterized by the dominance of benthic filter feeders
organisms (Urey et al., 1951).                                      and deposit feeders (Kruk-Dowgiałło and Dubrawski, 1998).
                                                                    These organisms exploit their growth potential during the
                                                                    productive seasons of the year when the availability of sus-
                                                                    pended matter, mainly phytoplankton, is the highest (Pier-
2     Material and methods
                                                                    scieniak et al., 2010; Staniszewska et al., 2016).
2.1    Study area
                                                                    2.2   Species
The study area is located in the Gulf of Gdańsk in the south-
ern Baltic Sea; more precisely, it is in the outer Puck Bay and     The clam Cerastoderma glaucum (Mollusca, Bivalvia;
the central Gulf of Gdańsk (Fig. 1). The north-western part of     Fig. 2a), commonly known as the lagoon cockle, is a salt-
the gulf is separated by the Hel Peninsula and in the west and      water organism found along the coasts of Europe and north-
south by the coastline stretches (Kruk-Dowgiałło and Szani-         ern Africa, including in the Mediterranean Sea, Black Sea,
awska, 2008; Rainbow et al., 2004). This location makes the         Caspian Sea and the low-salinity Baltic Sea. It is a euryhaline
seawater the most turbulent in January and the calmest in           species living in salinities between 4 and 84. Clam C. glau-
June, with weak bottom currents and minimal tidal ampli-            cum can tolerate habitats with a wide range of temperatures,
tudes. The hydrophysical parameters of the gulf are mostly          from periodically freezing to above 30 ◦ C. It is a filter feeder
driven by the temperate climate and the following seasonal          that actively lives near the sediment surface, acting as a biod-
changes. Differences in air temperature and water mixing            iffuser (Urban-Malinga et al., 2013). The clam is surrounded
cause seasonal fluctuations of the surface water temperature,       by a ribbed aragonite shell, which is externally yellowish to
ranging from approximately 4 to 22 ◦ C (Uścinowicz, 2011).         greenish brown (Jelnes et al., 1971). In the brackish environ-
The Gulf of Gdańsk is a low-salinity system under the influ-       ment of the Gulf of Gdańsk, C. glaucum spawns in May–July
ence of brackish water from the open southern Baltic Sea and        and typically lives up to 4 years, achieving a height of 27 mm
fresh waters from rivers, mainly the Vistula river; the Vistula     (Żmudziński, 1990).
is the largest river in Poland and has an average annual inflow        The soft-shell clam Mya arenaria (Mollusca, Bivalvia;
into the estuary of 1080 m3 s−1 , which varies seasonally from      Fig. 2b) is a marine invasive species introduced into Eu-
250 to 8000 m3 s−1 and has a maximum in spring (Cyberski            ropean waters from the Atlantic coasts of North America
et al., 2006). Thus, the average water salinity in the gulf is 7,   (Behrends et al., 2005). It has a wide global distribution,

https://doi.org/10.5194/bg-18-707-2021                                                        Biogeosciences, 18, 707–728, 2021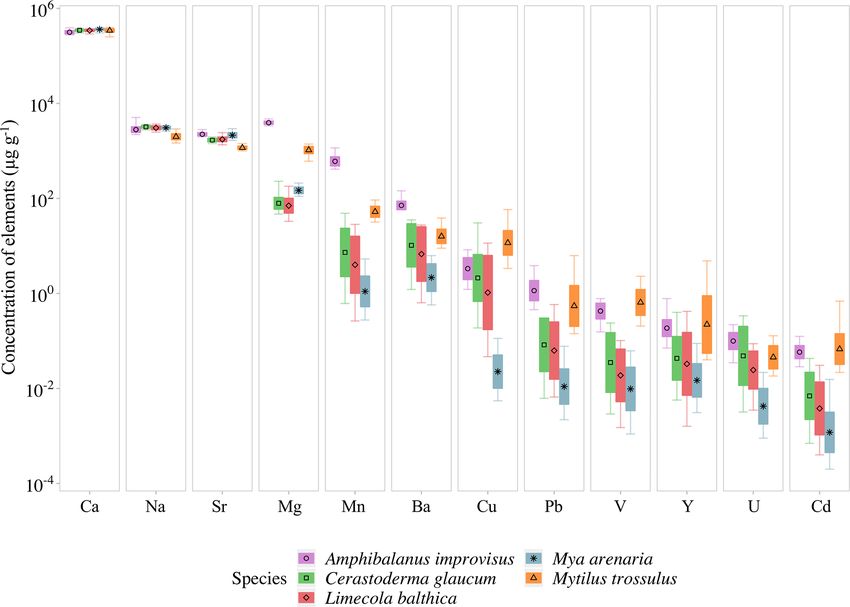
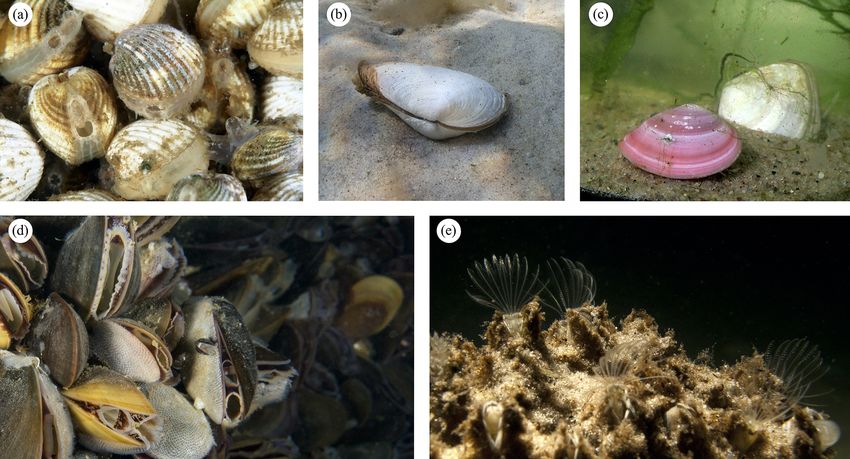
710                            A. Piwoni-Piórewicz et al.: The patterns of elemental concentration in shells of invertebrates

Figure 1. The location of the study area: the Baltic Sea (a) and the Gulf of Gdańsk (b) are marked by black rectangles. Panel (c) shows the
sampling stations as black circles (see Table 1 for station details). The grey lines indicate 20 m isobaths.

Figure 2. The investigated species photographed in situ: clams (a) Cerastoderma glaucum, (b) Mya arenaria, and (c) Limecola balthica;
mussels (d) Mytilus trossulus; and barnacle (e) Amphibalanus improvisus.

mainly due to its adaptability to varying environments with                The clam Limecola balthica (Mollusca, Bivalvia; Fig. 2c)
salinities between 4 and 35 and temperatures between −2                 lives in the northern parts of the Atlantic and Pacific oceans,
and 28 ◦ C (Gofas, 2004; Strasser et al., 1999). M. arenaria            in sub-Arctic and European waters from southern France to
is a filter feeder, filtering organic particles and microinverte-       the White Sea and Pechora Sea, including the Baltic Sea
brates using long fused siphons, and a deposit feeder. In the           (Strelkov et al., 2007). It is a euryhaline clam capable of
Gulf of Gdańsk, M. arenaria is a common inhabitant of shal-            living in a wide range of water salinities from 3 to 40 and
low waters down to a depth of 30 m. It spawns once or twice             at temperatures from −2 to above 30 ◦ C (Sartori and Go-
a year in spring or summer, at temperatures of 10–15 ◦ C. In-           fas, 2016). L. balthica is a filter feeder and a deposit feeder
dividuals live 10–12 years. They have aragonitic shells and             and has a semi-sessile lifestyle, with the ability to under-
grow up to 70 mm (Żmudziński, 1990).                                  take periodic migrations (Hiddink et al., 2002). In the Baltic

Biogeosciences, 18, 707–728, 2021                                                             https://doi.org/10.5194/bg-18-707-2021
A. Piwoni-Piórewicz et al.: The patterns of elemental concentration in shells of invertebrates                                711

Sea, L. balthica lives at depths down to 40 m and grows to            By measuring the shell heights of clams and shell diame-
24 mm. Adults reproduce in spring when the water temper-           ters of barnacles using a calliper with an accuracy of ±1 mm,
ature reaches 10 ◦ C and live 12 years (Żmudziński, 1990).       the shells were classified into four size classes. The division
They have aragonitic shells varying in colour between indi-        into size classes was performed based on the size reached
viduals and locations, mainly exhibiting white, pink, yellow       by each species in the southern Baltic Sea environment (Ta-
and orange (Sartori and Gofas, 2016).                              ble 2). Forty shells (10 in each class) were selected for A.
   The mussel Mytilus trossulus (Mollusca, Bivalvia; Fig. 2d)      improvisus, C. glaucum, M. arenaria and L. balthica. For
is one of three closely related taxa in the Mytilus edulis com-    M. trossulus, 20 shells were selected, with 5 in each class,
plex of blue mussels, which, collectively, are widely dis-         while the results for the rest were obtained from Piwoni-
tributed in the temperate and cold-water coasts of the North-      Piórewicz et al. (2017). After the removal of soft tissues,
ern Hemisphere and are often dominant organisms on hard            each shell was viewed under a stereoscopic microscope to
substrates of shallow nearshore habitats (Rainbow et al.,          check for the presence of epibiotic flora and fauna, which
1999; Wenne et al., 2016). Generally, M. trossulus has a           could contaminate the sample and bias the chemical analysis.
lifespan of approximately 12 years and grows to 100 mm,            If any organisms were present on the shell, they were care-
yet in the estuarine environment of the Gulf of Gdańsk, it        fully removed. To remove the biofilm, the periostracum was
reaches a maximum length of approximately 50 mm (Gofas,            scraped with a scalpel, and pre-cleaned shells were placed
2004; Żmudziński, 1990). Mussels are sessile filter feeders,     in an ultrasonic bath (InterSonic IS-7S) in ultra-pure water
mainly depending on phytoplankton. They reproduce from             for 30 min and then dried at 70 ◦ C for 24 h. The shells were
late spring to early autumn, depending on the temperature          then crushed and ground into a fine powder with an agate
and food abundance (Larsson et al., 2017; Lauringson et al.,       mortar and pestle. Aliquots (2.8–849 mg, mean of 132 mg)
2014; Rainbow et al., 2004). The shell of M. trossulus is          of the powdered samples were weighed using a five-digit an-
bimineralic and consists of two calcium carbonate layers: an       alytical balance, placed into a 15 mL plastic tube (Sarstedt™)
outer calcite and inner aragonite layer in variable proportions    and dissolved in a mixture of 1.5 mL concentrated nitric acid
between individuals (Dalbeck, 2008; Piwoni-Piórewicz et al.,       (HNO3 , Sigma-Aldrich® , TraceSELECT for trace analysis),
2017).                                                             1.5 mL ultra-pure water and 0.3 mL 30 % hydrogen perox-
   The barnacle Amphibalanus improvisus (Arthopoda, Max-           ide (H2 O2 , Merck® Suprapure grade). After 24 h at 70 ◦ C,
illopoda; Fig. 2e), commonly named the bay barnacle, is            the liquid samples were diluted to ca. 15 mL by weight with
a small sessile crustacean that typically exists in shallow        ultra-pure water.
coastal zones that are less than 10 m deep. It is widespread
around the Atlantic and has been dispersed by shipping to          2.4   Elemental analysis
many parts of the world, now having a worldwide distri-
bution. It is a euryhaline and eurythermal species that is         Concentrations of chemical elements in the digested samples
absent only from the Arctic and Antarctic seas (Kerckhof,          were determined at the Natural History Museum, London,
2002). A. improvisus is a filter feeder that inhabits hard sub-    using a Thermo iCap 6500 Duo inductively coupled plasma
strates. In the Baltic Sea, the reproduction of barnacles starts   optical emission spectrometer (ICP-OES) for Ca, Na, Sr and
in spring with temperatures over 10 ◦ C and ends in autumn.        Mg and an Agilent 7700x inductively coupled plasma mass
The species grows to approximately 10 mm in diameter with          spectrometer (ICP-MS) for Mn, Ba, Cu, Pb, V, Y, U and Cd.
a maximum height of approximately 6 mm, and generally, it          Calibration of the ICP-OES analysis was performed using so-
has a longevity of 1 year (Żmudziński, 1990). It has a conical   lutions containing 1–50 mg L−1 Ca, 0.01–5 mg L−1 Na, and
shell composed of six fused calcite plates (Weidema, 2000).        0.001–0.5 mg L−1 Sr and Mg in 0.8 M HNO3 . Na, Mg and
                                                                   Sr calibration solutions all contained Ca at 100 times the
2.3   Sample collection and preparation                            Mg concentration, to account for the effects on other wave-
                                                                   lengths by high Ca contents in the samples and standards.
Samples of shells were gathered by a Van Veen grab sam-            Multiple wavelengths for each element were recorded, and
pler from four stations: GN (May 2013), MA, M2 and MW              line selection was performed by accounting for the suitabil-
(June 2014), located in the Gulf of Gdańsk (Table 1, Fig. 1).     ity of the wavelength to the concentrations in the samples and
One species was found at stations MA (Mya arenaria),               accounting for any potential spectral interferences. The accu-
M2 (Cerastoderma glaucum) and MW (Limecola balthica),              racy and reproducibility of the analyses were checked using
while two species were collected at station GN (Mytilus            two calcium-rich certified reference materials (CRMs): JLs-
trossulus, Amphibalanus improvisus; Table 1). To ensure that       1 Limestone and JDo-1 Dolomite (both from the Geologi-
the samples were not contaminated or modified by solutions         cal Survey of Japan). The reference materials were diluted to
of preservatives, the collected material was transported alive     match the concentrations of Ca in the sample solutions. Ca,
in tanks filled with seawater to the laboratory in which sam-      Mg and Sr concentrations were found to be within 1 standard
ple preparation was performed.                                     deviation (SD) of the reported values (Imai et al., 1996).

https://doi.org/10.5194/bg-18-707-2021                                                      Biogeosciences, 18, 707–728, 2021
712 A. Piwoni-Piórewicz et al.: The patterns of elemental concentration in shells of invertebrates
Table 1. Details of the sampling locations. Temperature (T ) and salinity were measured near the bottom during sample collection.
Station Coordinates Collected species Depth T (◦ C) Salinity Sediment type∗ Sampling
(m) measured in situ date
GN 54◦ 320 N, 18◦ 480 E Amphibalanus improvisus 36 3.1 7.3 Sandy mud, silty sand May 2013
GN 54◦ 320 N, 18◦ 480 E Mytilus trossulus 36 3.1 7.3 Sandy mud, silty sand May 2013
M2 54◦ 380 N, 18◦ 330 E Cerastoderma glaucum 10 16.9 6.9 Sand June 2014
MA 54◦ 370 N, 18◦ 320 E Mya arenaria 10 19.8 6.9 Sand June 2014
MW 54◦ 370 N, 18◦ 370 E Limecola balthica 31 4.7 7.0 Fine sand, sandy mud, silty sand June 2014
∗ Based on Uścinowicz (2011).
Table 2. The range of shell sizes for each studied species within a given size class.
Species Mineral type Size classes (mm) Maximum size in the
I II III IV Gulf of Gdańsk (mm)∗
Amphibalanus improvisus Calcite 3–4 5–6 7–8 9–10 10
Mytilus trossulus Bimineralic 6–15 16–25 26–35 36–44 50
Cerastoderma glaucum Aragonite 4–8 9–12 12–16 16–20 27
Mya arenaria Aragonite 10–20 20–30 30–40 40–49 70
Limecola balthica Aragonite 4–7 8–11 12–15 15–18 24
∗ Based on Żmudziński (1990).
The limit of quantification (LOQ) of the ICP-MS analysis Cu, Pb, V, Y, U and Cd were examined in the four size
was generally determined as the concentration correspond- classes separately for each species. The data were not nor-
ing to 10 times the standard deviation of the signal obtained mally distributed (Shapiro–Wilk test); therefore, significant
by analysing 0.8 M HNO3 solution (six to seven times) in differences between the mean concentrations of the selected
each individual run. ICP-MS was run in helium (He) mode trace elements in the size classes were identified by one-way
(5 mL min−1 He, 99.9995 % purity) for lighter elements (V, Kruskal–Wallis nonparametric ANOVA (p value = 0.05) and
Mn, Cu, Y and Cd) to minimize the molecular interference post hoc Dunn’s tests for multiple independent groups. Sta-
from plasma and solution components and Ca from the sam- tistical computing and graphical visualizations were per-
ples. formed in RStudio (R Core Team, 2019).
The accuracy and reproducibility were checked by anal-
yses of JLs-1 and JDo-1 before and after every batch of
samples. The results obtained for all elements were within 3 Results
±2.5 SD of the recommended values (Imai et al., 1996). Ac-
curacy of Pb determination could not be checked using these The concentrations of trace elements in studied individ-
CRMs because of the large spread of reference values prob- uals can be found in Table S1 in the Supplement. The
ably due to insufficient homogeneity of Pb distribution in mean concentrations in all studied organisms decreased, be-
these materials. Based on the analyses of CRMs and matrix- ing the highest for Ca and the lowest for Cd, in the fol-
matched solutions, the maximum analytical error for the typ- lowing order Ca > Na > Sr > Mg > Mn > Ba > Cu > Pb >
ical range of concentrations in the shells can be estimated (in V > Y > U > Cd. However, the concentrations of given el-
relative percentage) as 1.5 % for Ca, Mg and Sr; 3 % for Ba; ements were different for Cerastoderma glaucum, Mya are-
20 % for Cu and U; and 10 % for all other elements. More de- naria, Limecola balthica, Mytilus trossulus and Amphibal-
tails on method validation were reported previously (Piwoni- anus improvisus, showing high variability both between and
Piórewicz et al., 2017). within species (Table 3, Fig. 3).
There is a pattern of the highest concentration of Ca
2.5 Statistical analyses in all individuals, which ranges from 316 ± 26 mg g−1
(mean ± 1 SD) in A. improvisus to 363±18 mg g−1 in M. are-
To evaluate the effect of the shell size (ontogenesis stage) naria. The rest of the elements had mean concentrations in
on the concentrations of trace elements in calcareous parts shells below 4.0 mg g−1 . In mussels, the most concentrated
of A. improvisus, C. glaucum, M. arenaria, L. balthica and were in the order Na > Sr > Mg, while in barnacles the or-
M. trossulus, the concentrations of Ca, Na, Sr, Mg, Mn, Ba, der was Mg > Na > Sr. The concentration of Na ranged, on
Biogeosciences, 18, 707–728, 2021 https://doi.org/10.5194/bg-18-707-2021A. Piwoni-Piórewicz et al.: The patterns of elemental concentration in shells of invertebrates 713
Table 3. Elemental concentrations in shells of studied organisms, presented in decreasing order of means for each species (SD represents
standard deviation).
Amphibalanus improvisus: calcite
Element Sample size, Mean conc. SD Weight ratio El/Ca Molar ratio El/Ca
(El) n [µg g−1 ] [g g−1 ] [mmol mol−1 ]
Ca 37 316 000 26 000 1 1000
Mg 37 3940 320 0.01 20.5
Na 37 2850 470 0.01 15.7
Sr 37 2250 190 0.01 3.25
Mn 37 625 160 0.002 1.43
Ba 37 73.6 20.1 2 × 10⁻⁴ 0.07
Cu 37 3.90 2.21 1 × 10⁻⁵ 0.01
Pb 37 1.34 0.79 4 × 10⁻⁶ 0.001
V 36 0.47 0.16 2 × 10⁻⁶ 0.001
Y 37 0.21 0.12 1 × 10⁻⁶ 3 × 10⁻⁴
U 37 0.11 0.04 3 × 10⁻⁷ 1 × 10⁻⁴
Cd 37 0.06 0.02 2 × 10⁻⁷ 1 × 10⁻⁴
Cerastoderma glaucum: aragonite
Element Sample size, Mean conc. SD Weight ratio El/Ca Molar ratio El/Ca
(El) n [µg g−1 ] [g g−1 ] [mmol mol−1 ]
Ca 40 348 000 16 000 1 1000
Na 40 3220 210 0.01 16.1
Sr 40 1700 140 0.01 2.23
Mg 40 80.3 30.2 2 × 10⁻⁴ 037
Ba 40 15.3 10.4 4 × 10⁻⁵ 0.01
Mn 40 11.9 10.5 3 × 10⁻⁵ 0.02
Cu 40 4.11 6.32 1 × 10⁻⁵ 0.01
Pb 34 0.14 0.11 4 × 10⁻⁷ 1 × 10⁻⁴
U 40 0.11 0.08 3 × 10⁻⁷ 1 × 10⁻⁴
Y 40 0.07 0.07 2 × 10⁻⁷ 1 × 10⁻⁴
V 37 0.07 0.06 2 × 10⁻⁷ 2 × 10⁻⁴
Cd 37 0.01 0.01 3 × 10⁻⁸ 1 × 10⁻⁵
Limecola balthica: aragonite
Element Sample size, Mean conc. SD Weight ratio El/Ca Molar ratio El/Ca
(El) n [µg g−1 ] [g g−1 ] [mmol mol−1 ]
Ca 40 345 000 17 000 1 1000
Na 40 3100 300 0.01 15.6
Sr 40 1770 210 0.01 2.34
Mg 40 80.3 30.4 2 × 10⁻⁴ 0.38
Ba 40 13.1 10.2 4 × 10⁻⁵ 0.01
Mn 40 7.93 7.12 2 × 10⁻⁵ 0.02
Cu 40 3.01 3.40 1 × 10⁻⁵ 0.01
Pb 39 0.14 0.16 4 × 10⁻⁷ 1 × 10⁻⁴
Y 40 0.08 0.11 2 × 10⁻⁷ 1 × 10⁻⁴
V 35 0.04 0.03 1 × 10⁻⁷ 1 × 10⁻⁴
U 40 0.03 0.02 1 × 10⁻⁷ 2 × 10⁻⁵
Cd 37 0.01 0.01 2 × 10⁻⁸ 7 × 10⁻⁷
https://doi.org/10.5194/bg-18-707-2021 Biogeosciences, 18, 707–728, 2021714 A. Piwoni-Piórewicz et al.: The patterns of elemental concentration in shells of invertebrates
Table 3. Continued.
Mya arenaria: aragonite
Element Sample size, Mean conc. SD Weight ratio El/Ca Molar ratio El/Ca
(El) n [µg g−1 ] [g g−1 ] [mmol mol−1 ]
Ca 40 363 000 18 159 1 1000
Na 40 3080 207 0.001 14.8
Sr 40 2160 280 0.001 2.72
Mg 40 150 25.1 4 × 10⁻⁴ 0.68
Ba 40 2.59 1.62 1 × 10⁻⁵ 0.002
Mn 40 1.41 0.89 4 × 10⁻⁶ 0.003
Cu 40 0.03 0.02 1 × 10⁻⁷ 5 × 10⁻⁵
Y 40 0.02 0.02 1 × 10⁻⁷ 3 × 10⁻⁵
V 40 0.02 0.01 4 × 10⁻⁸ 4 × 10⁻⁵
Pb 40 0.02 0.01 4 × 10⁻⁸ 1 × 10⁻⁵
U 40 0.01 0.01 2 × 10⁻⁸ 3 × 10⁻⁶
Cd 37 0.002 0.003 1 × 10⁻⁸ 2 × 10⁻⁶
Mytilus trossulus: calcite and aragonite
Element Sample size, Mean conc. SD Weight ratio El/Ca Molar ratio El/Ca
(El) n [µg g−1 ] [g g−1 ] [mmol mol−1 ]
Ca 40 344 000 28 000 1 1000
Na 21 2010 310 0.01 10.2
Sr 41 1170 100 0.003 1.55
Mg 40 1060 170 0.003 5.07
Mn 35 54.3 15.1 2 × 10⁻⁴ 0.11
Ba 38 17.1 6.69 5 × 10⁻⁵ 0.01
Cu 40 14.1 10.2 4 × 10⁻⁵ 0.03
Pb 32 1.14 1.41 3 × 10⁻⁶ 0.001
V 40 0.78 0.52 2 × 10⁻⁶ 0.002
Y 40 0.73 1.23 2 × 10⁻⁶ 0.001
Cd 40 0.09 0.11 3 × 10⁻⁷ 1 × 10⁻⁴
U 40 0.05 0.03 2 × 10⁻⁷ 3 × 10⁻⁵
average, from 2.01 ± 0.31 mg g−1 in M. trossulus to 3.22 ± M. arenaria to 620 ± 160 µg g−1 in A. improvisus (Table 3,
0.21 mg g−1 in C. glaucum. In A. improvisus, Mg (3.94 ± Fig. 3).
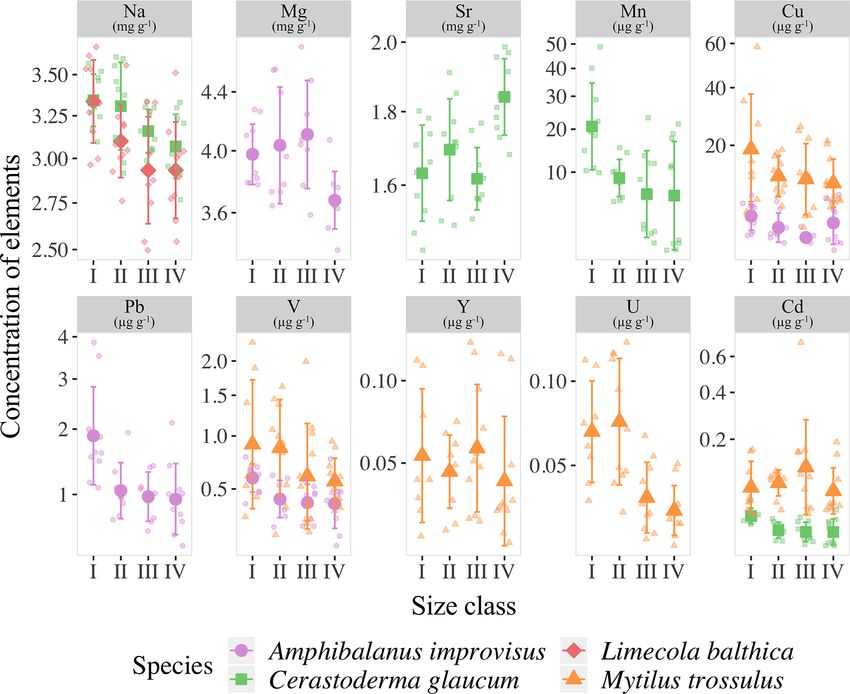
0.32 mg g−1 ) was dominant after Ca, while mean concentra- The results of the Kruskal–Wallis nonparametric ANOVA
tion of Sr (2.25 ± 0.19 mg g−1 ) was lower than Na (2.85 ± test, which was used to compare the element concentrations
0.47 mg g−1 ). Clams C. glaucum (Mg: 80.3 ± 30.2 µg g−1 , between the four size classes in each species, revealed the
Sr: 1.70 ± 0.14 mg g−1 , Na: 3.22 ± 0.21 mg g−1 ), M. are- lack of variability within M. arenaria. The smallest vari-
naria (Mg: 150 ± 25.1 µg g−1 , Sr: 2.16 ± 0.28 mg g−1 , Na: ability was found in L. balthica. Only the concentration of
3.08±0.21 mg g−1 ) and L. balthica (Mg: 80.3±30.4 µg g−1 , Na (H = 10.586, p = 0.014) decreased with shell growth
Sr: 1.77±0.21 mg g−1 , Na: 3.10±0.30 mg g−1 ) had concen- for this clam. The third clam species, C. glaucum, showed
trations of Sr over 15 times higher than those of Mg. Mussels high variability in the four trace elements. Shells of C.
M. trossulus were characterized by concentrations of Mg and glaucum had increased concentrations of Sr (H = 14.584,
Sr reaching 1.06±0.17 and 1.17±0.10 mg g−1 , respectively. p = 0.002), contrary to the decreasing concentration of Na
This species also was characterized by a concentration of Na (H = 10.529, p = 0.015), Mn (H = 10.658, p = 0.014) and
(2.01±0.31 mg g−1 ) higher than Mg and Sr (Table 3, Fig. 3). Cd (H = 11.655, p = 0.009). Similarly, shells of A. im-
The trace elements (Mn, Ba, Cu, Pb, V, Y, U and Cd) ex- provisus also showed variability in four trace elements be-
hibit a general trend of highest concentrations in A. impro- tween size classes, namely, Mg (H = 11.996, p = 0.007), V
visus and M. trossulus, lower in C. glaucum and L. balth- (H = 11.206, p = 0.011), Cu (H = 9.146, p = 0.027) and
ica, and the lowest in M. arenaria. Manganese was the most Pb (H = 13.308, p = 0.004). However, in this case, the se-
variable element and increased from 1.41 ± 0.89 µg g−1 in quences of the changes were not straightforward but, rather,
Biogeosciences, 18, 707–728, 2021 https://doi.org/10.5194/bg-18-707-2021A. Piwoni-Piórewicz et al.: The patterns of elemental concentration in shells of invertebrates 715
Figure 3. Mean elemental concentrations in shells of studied species. The boxplots represent standard deviations (±1 SD) of values, and
whiskers indicate the minimum and maximum concentrations for each studied species. Concentrations of elements are presented using a
logarithmic scale.
had a tendency to fluctuate between the smallest and the
largest individuals. The highest variability was found within
the bimineralic shells of M. trossulus. The size classes dif-
fered in terms of five trace elements. The incorporation of
V (H = 22.595, p < 0.001), Cu (H = 26.18, p < 0.001), Y
(H = 10.819, p = 0.013), Cd (H = 15.353, p = 0.002) and
U (H = 18.202, p < 0.001) into shells decreased in larger
mussels (Fig. 4).
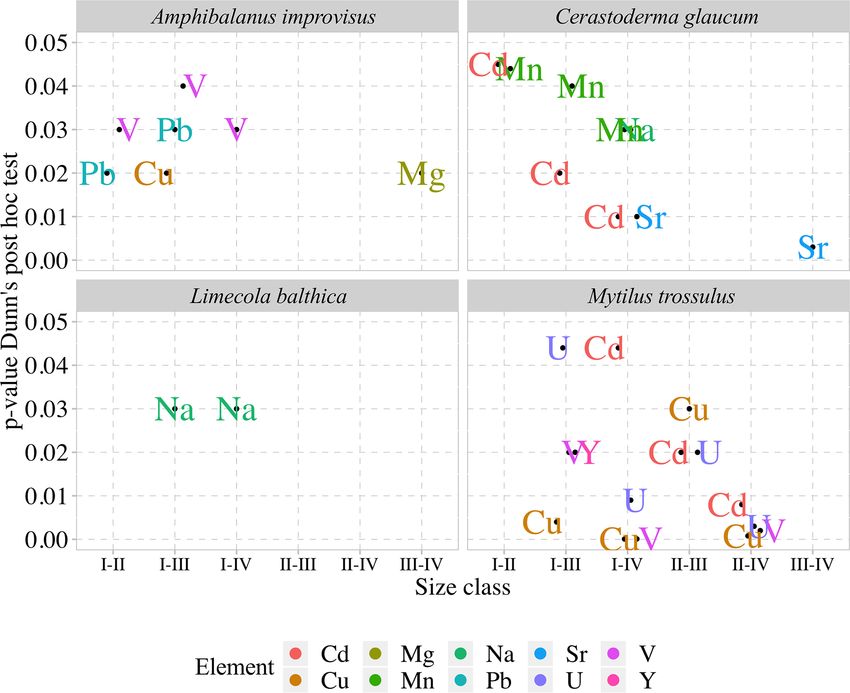
Detailed analyses of the differences in the studied ele-
ments between the size classes based on post hoc Dunn’s
tests for multiple independent groups indicated that the sig-
nificant variations were not linear (Fig. 4). In L. balthica, Na
concentration decreased in larger shells, showing differences
between the size classes I and III and I and IV. In the shells
of C. glaucum, Sr concentration increased gradually, reach-
ing a peak in the size class IV, while statistically significant
differences were observed between the size classes I and IV
and between III and IV. An inverse pattern was observed for
Figure 4. Mean concentrations of elements with statistically signif-
Na concentration, which, however, differed only between the icant differences between the four size classes (for size class details
smallest and largest clams. Shells of C. glaucum were also see Table 2) in the shells of studies species; error bars indicate stan-
characterized by a common trend of the Mn and Cd, which dard deviations (±1 SD). Concentrations of Mn, Cu, Pb, Cd, V and
decreased from size class I to size class II, reaching then a Y are presented using a square root scale.
plateau. In shells of A. improvisus, the concentrations of Mg,
V, Cu and Pb decreased in larger individuals. The levels of
Mg in shells statically differed between the size classes III creased in growing shells of barnacles, reaching the mini-
and IV; likewise, shells from the size class III had the high- mum in the size class III. However, it is worth noting that
est concentrations. The elements V and Pb occurred at the Cu concentrations in many of the oldest shells are several
highest concentrations in shells of the smallest individuals, times higher. Shells of M. trossulus were characterized by
and later, they showed no trend in classes II–IV. Copper de- the highest variability of trace element concentrations be-
https://doi.org/10.5194/bg-18-707-2021 Biogeosciences, 18, 707–728, 2021716 A. Piwoni-Piórewicz et al.: The patterns of elemental concentration in shells of invertebrates
ing order of accumulated concentrations: Na > Sr > Mg. In
barnacles, however, this order was different: Mg > Na > Sr
(Fig. 3). The most evident observed feature was that the
aragonitic shells of C. glaucum, M. arenaria and L. balth-
ica contained over 15 times more Sr than Mg. In the cal-
citic A. improvisus, Mg was 1.8 times more concentrated
than Sr, while the bimineralic shells of M. trossulus con-
taining layers of calcite and aragonite were distinguished by
equalized concentrations of Mg and Sr in shells (Table 3,
Fig. 3). Such a pattern of Mg and Sr is observed in a num-
ber of calcareous species including bivalves and barnacles
(Table 4; Dalbeck, 2008; Iglikowska et al., 2016; Wang and
Xu, 2001; Zhao et al., 2017). However, inter-species compar-
ison showed that the calcite of barnacles A. improvisus devi-
ated from this general trend: both Mg and Sr concentrations
were higher in calcitic barnacles than in aragonitic clams (Ta-
ble 3, Fig. 3). Kinetic and biological effects influence the
Figure 5. Pairwise comparisons of elements in the shells of studied
partitioning of Sr between the shell and seawater (Urey et
species with statistically significant differences (p < 0.05) between al., 1951), and Sr in shells is known to significantly exceed
size classes (for size class details see Table 2). its concentration expected at the thermodynamic equilibrium
(Schöne et al., 2010). Furthermore, previous studies revealed
that barnacles have significantly higher Sr shell concentra-
tween size classes. The trend of decreasing concentrations tion (up to 2.3 mg g−1 ) than other marine invertebrates (Car-
was clearly marked for V, Cu, Cd and U. The concentration penter and Kyger, 1992; Ullmann et al., 2018). The con-
of Y showed significant differences between the size classes centration of Sr in shells of A. improvisus from this study
I and III (Fig. 5). (2.25 ± 0.19 mg g−1 ) supports these findings, suggesting that
The comparison of elemental concentrations in shells of the barnacle precipitation process differs from other marine
mussels and barnacles from different regions, based on liter- organisms. Carpenter and Kyger (1992) concluded that Sr is
ature data, is presented in Table 4. a sensitive indicator of precipitation rate; this may explain the
elevated Sr concentrations in barnacles. The shell increment
in barnacles is rapid (15–30 mm per year; Milliman, 1974)
4 Discussion due to their relatively short lifespan (approximately 1 year).
Consequently, the observed Sr concentration of A. improvi-
4.1 CaCO3 polymorph type and elemental sus may be caused by a higher precipitation rate of barnacle
concentrations calcite in comparison with the precipitation rate of aragonite
in long-lived bivalves (Tables 3 and 4, Fig. 3). Crystal lattice
The average Ca concentration in the skeletons of all species distortions in barnacle calcite induced by rapid incorporation
collected in the Baltic Sea was found to be 343 mg g−1 (Ta- of impurities (Pokroy et al., 2006) may allow for even higher
ble 3), which corresponds to ca. 86 % weight per weight Sr incorporation and support the high Sr concentration in A.
(w/w) of pure CaCO3 . For comparison, same species or improvisus shell. This indicates that Mg and Sr concentra-
congeners from different regions contain between 310 and tions in shell are controlled by CaCO3 lattice properties yet
420 mg g−1 of Ca in shell (Table 4), with the results above in a strongly species-specific way (Skinner and Elderfield,
(400 mg g−1 ) probably being caused by analytical bias. 2005).
Among shell impurities, the most concentrated elements The concentrations of Mn and Ba are several orders of
were Na, Sr and Mg in all studied CaCO3 polymorphs magnitude higher in the calcitic shells of barnacle A. improvi-
(Fig. 3). Such compositions are considered to be typical for sus than in other species (Table 3, Fig. 3). Based on the ionic
calcareous skeletons of marine invertebrates, as those ele- radii of Mn and Ba, it is expected that aragonite shells would
ments are energetically favoured in CaCO3 crystal lattice, incorporate Ba more intensively than would calcitic shells
substituting for Ca (Allison et al., 2001; Iglikowska et al., (Findlater et al., 2014; Gillikin et al., 2006), yet this trend is
2016; Reeder, 1983; Sugawara and Kato, 2000; Wang and not observed in this study, indicating that Ba is not clearly re-
Xu, 2001; see also Table 4). The main elemental constituents lated to the crystal lattice orientation. Furthermore, barnacles
of the Baltic shells showed generally a uniform distribution appear to have a stronger capacity for Mn incorporation into
in collected samples and were within the ranges typical for shells than other benthic calcifiers (Pilkey and Harris, 1966),
a given species. Clams that precipitate fully aragonitic shells including A. improvisus collected at the same location (GN,
and bimineralic mussels were characterized by the follow- Fig. 1), possibly due to the species-specific biological factors
Biogeosciences, 18, 707–728, 2021 https://doi.org/10.5194/bg-18-707-2021A. Piwoni-Piórewicz et al.: The patterns of elemental concentration in shells of invertebrates 717
Table 4. Elemental concentrations in shells from different regions based on this study (in bold) and literature data.
Element concentration in shell Ca Na Sr Mg Mn Ba Cu Pb Cd U
[µg g−1 ] [µg g−1 ]
Amphibalanus improvisus a 316 000 2850 2250 3940 625 73.4 3.91 1.34 0.11 0.06
Balanus sp.o 1600–5000 80–3800
Balanus sp.y 39–313 < 18.2 0–1.48
Balanus balanoidesd 77.3
Amphibalanus reticulatush 1000–2000
Cerastoderma glaucum a 348 000 3220 1700 80.4 11.9 15.1 4.08 0.14 0.01 0.09
Cerastoderma glaucumg 400 000 280 26.2 0.16 17 0.02
Cerastoderma eduler 1.11–4.42 0.03–4.94
Limecola balthica a 345 000 3100 1770 80.3 7.92 13.0 3.0 0.14 0.007 0.03
Macoma (= Limecola) balthicas 0.68
Mya arenaria a 363 000 3080 2160 150 1.40 2.60 0.03 0.02 0.002 0.01
Mya arenariai 9.5 0.05
Mytilus trossulus a 344 000 2010 1170 1060 54 17.0 14 1 0.09 0.05
Mytilus trossulusj 1185
Mytilus trossulusg 310 000 1400 120 0.16 24 0.03
Mytilus trossulusg 420 000 1700 90 < 0.02 5.2 0.01
Mytilus edulise 970 970 24.2 3.31 0.32 0.01
Mytilus edulisw 862 856 0.13 0.26 0.39 0.001
Mytilus edulisn 398 000
Mytilus galloprovincialisv 9.54 1.19
Mytilus galloprovincialisi 10 7.3
Mytilus galloprovincialisb 360 000 2500–4000 500–800 900–1400 < 160 0–3.8 0–5.5 0–5.0 0–3.0
Shell weight ratio, element / Ca Na/Ca Sr/Ca Mg/Ca Mn/Ca Ba/Ca Cu/Ca Pb/Ca Cd/Ca U/Ca
[g g−1 ] [mg g−1 ]
Amphibalanus improvisus a 0.01 0.01 0.01 1.98 0.23 0.01 0.004 3 × 10⁻⁴ 2 × 10⁻⁴
Amphibalanus amphitritet 0.01
Balanus balanoidesu 0.01 0.01 0.01 0.001
Balanus balanoidesu 0.01 0.01 0.01 0.001
Balanus balanoidesu 0.02 0.01 0.01 3 × 10⁻⁴
Shell molar ratio, element / Ca Na/Ca Sr/Ca Mg/Ca Mn/Ca Ba/Ca Cu/Ca Pb/Ca Cd/Ca U/Ca
[mmol mol−1 ] [µmol mol−1 ]
Amphibalanus improvisus a 15.7 3.30 20.5 1438 67.3 7.71 0.82 0.07 0.06
Amphibalanus improvisusp 4.20 20.6 0.71
Balanus balanusc 20.5 3.85 14.8 0.08 0.06
Mya arenaria a 14.8 2.72 0.68 2.80 2.09 0.05 0.01 0.002 0.003
Mya arenariam 2.11–2.45 1–1.9 0.06–0.14 1.7–3.7 0.002–0.005
Mytilus trossulus a 10.2 1.55 5.07 114 14.4 25.4 0.56 0.09 0.03
Mytilus edulisl 1.1–1.6 2.5–6.0
Mytilus edulisf 1.92 8.67
Mytilus edulisk 1.34–1.50 5.1–7.86 13–35
Mytilus edulisn 0.7–1.5 2.5–12.0 100–450 20–70 0.2–1.3
Cerastoderma glaucum a 16.1 2.23 0.38 24.9 12.6 7.3 0.08 0.01 0.05
Cerastoderma edulex 1.6 1.5 20–60 15 0.01
a Baltic Sea, Gulf of Gdańsk (this study); b Adriatic Sea, Croatia (Rončević et al., 2010); c Arctic (Iglikowska et al., 2018); d Atlantic, USA (Blanchard and Chasteen, 1976);
e North Sea, Germany (Ponnurangam, 2018); f Baltic Sea, Germany (Heinemann et al., 2008); g Baltic Sea, Gulf of Gdańsk (Szefer and Szefer, 1985); h Bay of Bengal,
India (Raman and Kumar, 2011); i Black Sea (Mititelu et al., 2014); j Canada (Klein et al., 1996); k cultured (Freitas et al., 2009); l cultured (Heinemann et al., 2011);
m cultured (Strasser et al., 2008); n cultured (Vander Putten et al., 2000); o cultured (Gordon et al., 1970); p Denmark (Ullmann et al., 2018); r England (Price and Pearce, 1997);
s Canada, estuary (Thomas and Bendell-Young, 1998); t Hong Kong (Zhang et al., 2015); u Irish Sea, UK (Bourget, 1974); v Spain (Puente et al., 1996); w Portugal (Ponnurangam,
2018); x Portugal (Ricardo et al., 2015); y south-west coast of India (Ashraf et al., 2007).
https://doi.org/10.5194/bg-18-707-2021 Biogeosciences, 18, 707–728, 2021718 A. Piwoni-Piórewicz et al.: The patterns of elemental concentration in shells of invertebrates (Bourget, 1974). Yet, as both species with highest concentra- sue and van Geen, 2004). These elements are biologically es- tion of Mn produced calcite (Table 3, Fig. 3), we should not sential (Bellotto and Miekeley, 2007) and inter-species vari- rule out that the polymorph type of CaCO3 regulates, to some ability of Mg and Mn between barnacles, mussels and clams degree, the level of shell Mn in this low-salinity environment. (Fig. 3) could be enhanced by specific properties of organic It was observed that an increased incorporation of Mg and phases. Furthermore, trace elements in shells may be present Sr into shell can contribute to distortion of CaCO3 crystal lat- in microscopic aqueous fluid inclusions that were trapped tice, which, in turn, results in increased incorporation of trace within crystals during their growth from solution (Gaffery, elements into the shells (Davis et al., 2000; Dalbeck, 2008). 1998). Lécuyer and O’Neil (1994) found that such inclusion In our study, shell lattices of mussels and barnacles could be waters constitute up to 2 % of the shell and probably repre- affected by the concentrations of Mg and Sr higher than those sent the remnants of metabolic fluids produced by the mantle in clams. Therefore, the concentrations of Cu, V, Cd, Y and epithelium. Therefore, their composition most likely results U seem to be driven to some degree by crystal lattice prop- from the specific biological features of an organism rather erties having the highest values in calcite-containing shells than from the structural properties of calcium carbonate. (Fig. 3). It is also important to note that the smaller ionic radii of V, Cd, Y, U and Cu are energetically favoured in cal- 4.2 Size classes and potential biological impact on cite, while the larger Pb radius is favoured in aragonite struc- elemental concentrations ture (Morse et al., 1997; Reeder, 1983; Wang and Xu, 2001). However, trace elements Cu, V, Cd and Y were present at the The recorded concentrations of trace elements in all popula- highest levels in bimineralic M. trossulus, while only U, as tions exhibited marked inter-individual variability (Table 3, well as Pb, was present in calcitic A. improvisus (Table 3), Fig. 3), which is a feature previously recorded by several au- which suggests that additional factors, other than the crys- thors (Gillikin et al., 2005a; Vander Putten et al., 2000). In tal lattice effects, determine those concentrations. Further- this study, individuals were collected over a wide range of more, this study likewise revealed inconsistent variability of sizes (Table 2), representing different ages and lifespans. Bi- trace element concentrations between aragonitic clams. Out valves are long-living organisms, and those of the Gulf of of the three species of clams, M. arenaria was characterized Gdańsk have a life expectancy of 4–12 years (Gofas, 2004; by the lowest concentration of all trace elements (Table 3). Żmudziński, 1990), contrary to barnacles with the relatively This also indicates that factors other than mineral properties short lifespan of approximately 1 year (Bornhold and Mil- co-regulate trace element accumulation in shells. liman, 1973). The southern Baltic Sea is driven by cyclical This study considers element concentrations in shells that environmental dynamics, which evoke physiological stress, were not subjected to chemical removal of organic matter determine the food base and drive its biogeochemical cycles prior to the dissolution of the carbonate matrix. Chemical (Elder and Collins, 1991). Shells of A. improvisus experi- cleaning of carbonate skeletons prior to chemical analysis enced 1-year variability of environmental factors, while bi- and both improvement of the data quality and potential arte- valves represent long-term variability. Thus, the lifespan may facts associated with this are widely discussed in the liter- explain, to some extent, the lowest variability of trace ele- ature (Barker et al., 2003; Holcomb et al., 2015; Loxton et ments in barnacles (Fig. 3). However, this relationship is not al., 2017), but a plausible pre-treatment method for the re- noticeable in mussels, for which the inter-individual variabil- moval of organics still needs to be found (Inoue et al., 2004). ity of trace elements in the youngest individuals (size class I) Mannella et al. (2020) showed that the suitability of chemi- was not lower than in the oldest ones (size class IV, Fig. 4). cal pre-treatments for organic matter removal from carbonate Thébault et al. (2009) revealed low inter-individual elemen- matrices should be evaluated on a case-by-case basis and, in tal variability in bivalves and on this basis indicated the en- case of relatively low organic content, should be avoided. In vironment as a factor controlling their incorporation within addition to CaCO3 crystal lattice, shells of barnacles and bi- shells. Therefore, the variability in elemental concentrations valves usually contain up to 5 % of organic matter (Bourget, between individuals from the brackish Gulf of Gdańsk may 1987; Wolowicz and Goulletquer, 1999; Marin and Luquet, to some extent be caused by biological factors, which could 2004; Rueda and Smaal, 2004). However, the specific fea- lead to a deviation from what is expected with purely en- tures and composition of a particular organic matrix might vironmental control. The biological influence on the shell result from the inter-species and inter-individual variability chemistry in the southern Baltic Sea could be reinforced by of elemental concentration in shells (Fig. 3, Table 3; Take- unfavourable conditions for calcification. The low salinity sue and van Geen, 2004). The organic fraction was found to (∼ 7) and alkalinity, which is typical for the studied area of be generally not associated with significant levels of trace the Gulf of Gdańsk, cause a reduced CaCO3 saturation state elements (Lingard et al., 1992; Takesue et al., 2008), which (Beldowski et al., 2010; Cai et al., 2010; Findlay et al., 2008). are strongly incorporated into the crystal phase. Yet, many Ions of Ca2+ and CO2− 3 are essential components for the authors found correlations, especially for Mg and Mn, asso- crystal formation and, when their concentrations in seawater ciated with the shell organic matrix (Bourget, 1974; Walls et are low, calcifying organisms exert selective Ca2+ channels al., 1977; Lorens et al., 1980; Rosenberg et al., 2001; Take- to enable an active ion capture from solution (Sather and Mc- Biogeosciences, 18, 707–728, 2021 https://doi.org/10.5194/bg-18-707-2021
A. Piwoni-Piórewicz et al.: The patterns of elemental concentration in shells of invertebrates                                   719

Cleskey, 2003). The required higher contribution of Ca2+ ac-         Hughes (1991) suggested that areas of higher shell curvature,
tive pumping results in a greater degree of biological control       such as the umbo, require greater metabolic expenditure, re-
over the calcification process (Sather and McCleskey, 2003;          sulting in an increase in element uptake. When the metabolic
Waldbusser et al., 2016), and shells are not produced in equi-       activity of an organism decreases, the ionic flux likewise de-
librium with environmental conditions when it comes to an            creases, increasing the tendency of Ca2+ to block other ion
elemental concentration.                                             fluxes (Carré et al., 2006; Friel and Tsien, 1989). There-
   Within species, organisms from juveniles to adults expe-          fore, in a low-salinity environment of the Gulf of Gdańsk,
rience morphological and functional changes related to sex,          metabolic fluctuations of organisms can have an exception-
metabolic rate or reproductive stage, which complicate the           ally strong effect on elemental variability, which was high
biomineralization process (Carré et al., 2006; Freitas et al.,       among studied individuals (Table 3, Fig. 3). The surface-
2006; Gillikin et al., 2005b; Schöne et al., 2010, 2011; Warter      to-volume ratio decreases with size and affects the contri-
et al., 2018). The size-related elemental patterns in shells of      bution of the adsorbed element content to the bulk concen-
A. improvisus, C. glaucum, M. arenaria, L. balthica and M.           tration (Azizi et al., 2018). Therefore, the negative correla-
trossulus from the Gulf of Gdańsk indicate that if a signifi-       tion between the bulk elemental concentration and the shell
cant variability exists, it is specifically expressed in trace el-   size (Fig. 4), noted in some previous studies (Martincic et
ement concentrations. The studied mussel M. trossulus and            al., 1992; Piwoni-Piórewicz et al., 2017; Ritz et al., 1982),
barnacle A. improvisus showed the greatest variability be-           could have been caused by a greater potential of surface ad-
tween size classes, while the size class effects were less pro-      sorption in smaller individuals. This is most pronounced for
nounced in clams (Fig. 4). However, the variability of trace         some trace elements, the concentrations of which decreased
elements was not uniform for M. trossulus and A. improvi-            across the four size classes in shells of A. improvisus (V, Cu
sus, even though the organisms came from the same location           and Pb), M. trossulus (V, Cu, Y, Cd and U) and C. glaucum
(Table 1). The size-related trend was observed for V, Cu, Y,         (Mn and Cd) (Figs. 4 and 5). Catsiki et al. (1994) suggested
Cd and U in molluscs and Mg, V, Cu and Pb in barnacles               that, apart from metabolic processes, an active detoxification
(Fig. 3). Among clams, we found a lack of size-dependent             mechanism in tissues is responsible for this trend, and its ef-
changes within M. arenaria. In L. balthica only the concen-          ficiency is higher in older and larger individuals.
tration of Na decreased with shell growth, while C. glaucum             Nevertheless, many of the trace elements studied herein
showed variability of Sr, Na, Mn and Cd (Fig. 4). Species-           showed a lack of statistically significant relationships with
specific patterns of elemental accumulation within the same          the shell size. Some trace elements in the shells of A. im-
habitat were observed before (Rainbow, 2002, 1995). Rain-            provisus (Y, U and Cd), M. trossulus (Pb), and C. glaucum
bow et al. (2000) tested the potential of A. improvisus and          (V, Cu, Y, Pb and U) and all trace elements in the shells of L.
M. trossulus from the Gulf of Gdańsk to be used as environ-         balthica and M. arenaria (V, Cu, Y, Pb, U and Cd) showed no
mental biomonitors by measuring the concentrations of Co,            significant variability related to the size of organisms (Figs. 4
Zn, Fe, Cd, Pb, Mn and Ni in soft tissues. They found that           and 5). This is not an unusual pattern for marine invertebrates
mussels and barnacles occurring at the same location did not         and has been shown by a number of studies. Saavedra et
show the same variation in elemental bioavailabilities, proba-       al. (2004) observed no differences between Cd, Pb, Cr, Ni,
bly because barnacles were particularly strong accumulators          As, Cu or Zn concentrations for different shell lengths of the
of trace elements (Rainbow, 1998, 2002). This shows that             raft Mytilus galloprovincialis separated into four size classes.
biological differences between species, such as growth rate,         Protasowicki et al. (2008) similarly found that the concentra-
feeding rate, assimilation efficiency (Luoma and Rainbow,            tions of Hg, Pb, Cd, Cu, Zn, Cr, Ni, Fe, Mn, V, Li or Al in
2005), and route and degrees of element uptake (Rainbow              the shells of the mussel Mytilus edulis from the Polish coast
and Wang, 2001) are significant factors determining the ele-         of the Baltic Sea did not vary between shell sizes. This in-
mental accumulation in shells.                                       consistent relationship shows that trace element concentra-
   In this study, it was generally observed that, when statisti-     tions in shells of different sizes might be under the influence
cal differences between size classes were recorded, the con-         of a number of factors including species-specific biological
centrations of trace elements decreased with the shell size.         mechanisms (e.g. metabolic rate).
The reverse was found only for Sr in the shells of C. glau-
cum, in which the concentration of Sr increased with size            4.3   Environmental factors and elemental
(Figs. 4 and 5). Large mussels pump less water per unit body               concentrations
weight, and their uptake of trace elements is lower than that
in smaller individuals. When the concentrations of trace el-         Organisms derive trace elements in dissolved and particulate
ements decrease with increasing shell size (Fig. 4), the in-         forms primarily from surrounding water, sediments and their
corporation might depend on the growth rate. The younger             food base (Freitas et al., 2006; Gillikin et al., 2005a; Poulain
specimens could have a greater growth rate and shell pre-            et al., 2015). The concentration of major constituents Na, Mg
cipitation rate, resulting in a greater uptake of trace ele-         and Sr in surrounding seawater is generally proportional to
ments (Dalbeck, 2008; Szefer et al., 2002). Rosenberg and            salinity (Beldowski et al., 2010; Cai et al., 2010; Findlater

https://doi.org/10.5194/bg-18-707-2021                                                         Biogeosciences, 18, 707–728, 2021
You can also read