Genetic determination for source capacity to support breeding of high-yielding rice (Oryza sativa)
←
→
Page content transcription
If your browser does not render page correctly, please read the page content below
Mol Breeding          (2020) 40:20
https://doi.org/10.1007/s11032-020-1101-5

Genetic determination for source capacity to support
breeding of high-yielding rice (Oryza sativa)
Shunsuke Adachi           &   Satoshi Ohkubo & Nan Su San &
Toshio Yamamoto

Received: 23 August 2019 / Accepted: 9 January 2020
# Springer Nature B.V. 2020

Abstract Over the past 20 years, researchers have de-               approaches. We also describe the development of phe-
veloped increasingly sophisticated genome information               notyping methods and recent improvements of our un-
and analytical platforms for rice (Oryza sativa) genetic            derstanding of natural variant genes that regulate source
research. The genetic controls of source capacity include           capacity. We conclude that the next challenge to be
photosynthesis capacity, leaf senescence, canopy archi-             addressed is closing the gap between understandings
tecture, and translocation. Details of these controls have          of genetic control of source capacity and rice productiv-
been gradually elucidated using biotechnological ap-                ity in the field.
proaches and studies of natural genetic resources. These
advances have been accompanied by the development
of phenotyping methodologies for use under both field               Keywords Canopy architecture . Genetic variation .
and controlled conditions. However, a more comprehen-               Photosynthesis . Senescence . Source capacity .
sive understanding of the genetic factors that regulate             Translocation
source capacity and their effects on rice yield is required
to increase the efficiency of breeding to improve yield.
In this review, we summarize the current understanding
                                                                    Introduction
of the physiological and genetic factors that regulate
source capacity gained through biotechnology
                                                                    Rice (Oryza sativa), one of the most important cereal
                                                                    crops in the world, is consumed by more than 50% of
This article is part of the Topical Collection on Rice Functional   the world’s population as a main cereal food. The annual
Genomics.                                                           global production of rice is approximately 770 Mt, a
                                                                    value that is exceeded only by maize, at 1100 Mt (FAO
S. Adachi (*) : S. Ohkubo : N. S. San
Institute of Global Innovation Research, Tokyo University of
                                                                    2019). Due to the continuous increase of the world’s
Agriculture and Technology, Fuchu 183-8509, Japan                   population and economic growth, which increases de-
e-mail: shunsuke.adachi.0210@vc.ibaraki.ac.jp                       mand for cereals, rice production will need to double by
                                                                    2050 relative to 2010 levels to meet the growing de-
T. Yamamoto
Institute of Plant Science and Resources, Okayama University,
                                                                    mand (Ray et al. 2013). This will require an annual
2-20-1 Chuo, Kurashiki, Okayama 710-0046, Japan                     improvement of more than 2.4% for rice yield, which
                                                                    is much larger than the rate of 1.0% during past 25 years
                                                                    (Ray et al. 2013; FAO 2019). The rate of increase has
Present Address:
S. Adachi
                                                                    slowed due to the limitations imposed by conventional
College of Agriculture, Ibaraki University, 3-21-1 Chuo, Ami,       breeding strategies and the effects of climate change
Inashiki, Ibaraki 300-0393, Japan                                   (Zhu et al. 2010a). Breaking these constraints to achieve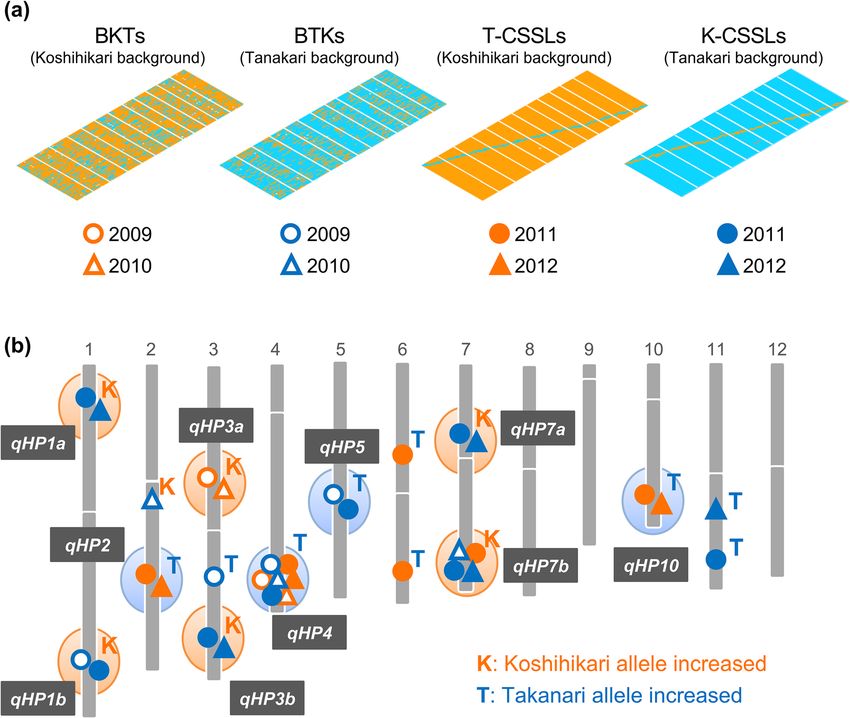
20    Page 2 of 23                                                                 Mol Breeding      (2020) 40:20

the required increase in rice production will be a chal-        (Zhu et al. 2010a). In contrast, εc remains far below the
lenging task for crop scientists.                               theoretical maximum, suggesting that modification of εc
   Crop productivity can be expressed in terms of the           will be a promising approach to increase rice yield
efficiency of utilization of sunlight (Monteith and Moss        potential (Long et al. 2015). In particular, the photosyn-
1977, modified by Zhu et al. 2010a):                            thetic capacity of individual leaves, which is the primary
                                                                determinant of εc, has not been improved during the
Y ¼ 0:487 " S t " εi " εc " εp                           ð1Þ    history of rice breeding (Long et al. 2015).
                                                                    “Source capacity” refers to the availability of a carbon
where Y (GJ m−2) is the crop yield, St (GJ m−2) is the          supply to meet the demand from the sink organs. It is
total incident solar radiation at the Earth’s surface per       determined by the photosynthetic activity of the crop
unit area during crop cultivation, εi is the efficiency of      canopy and the availability of carbohydrate storages
sunlight interception by the canopy, εc is the efficiency       (Miao et al. 2009). We also consider translocation capac-
of converting intercepted light into biomass, and εp is         ity, which represents the ability to transport carbon from
the partitioning of biomass to harvestable organs. Pho-         source to sink organs, as one of the source capacity traits
tosynthetically active radiation (at wavelengths from           in this review. Efforts to identify the genetic factors that
400 to 700 nm) accounts for 48.7% of the total incident         control source capacity have used methods of genetic
radiation (Papaioannou et al. 1993), which is the source        analysis such as quantitative trait locus (QTL) analysis
of the 0.487 in the equation. εi is affected by canopy leaf     and genome-wide association studies (GWAS) that have
expansion, the decrease of functional leaf area during          been facilitated by the development of new phenotyping
senescence, light reflection by the leaves, and the spatial     tools. Transgenic approaches and mutant analyses have
arrangement of the leaves. εc is affected by light penetra-     also played important roles in understanding source ca-
tion into the canopy, and by the photosynthesis, respiration,   pacity limitations. These efforts have revealed useful
and photorespiration rates per unit leaf area. εp is affected   genes and the gene networks that regulate source capacity.
by the sink size and the rate of translocation from source to       However, there is a gap between the genomic studies
sink organs. St is primarily affected by weather conditions     of source capacity and actual breeding programs to
which cannnot be controlled. Therefore, yield potential can     increase yield (Yamamoto et al. 2009; Jena and
be enhanced by increasing εi, εc, or εp.                        Ramkumar 2017). No cultivar suitable for practical use
    Due to the efforts of breeders over the past 60 years,      has been developed from these genetic studies. This
rice yield per unit area has doubled. This great achieve-       contrasts with other genetic factors related to morpho-
ment, part of the so-called “green revolution”, has been        logical characteristics, including grain number,
attributed to several key breakthroughs, including the          flowering time, and plant height, which have been well
development of semi-dwarf cultivars that allocate less          evaluated and applied in actual breeding programs by
photosynthate to vegetative tissues, increased use of           means of DNA marker-assisted selection (MAS)
fertilizers and pesticides, and improved fertilizer appli-      (Yamamoto et al. 2014). The complexity of the relation-
cation procedures. The shorter culms of semi-dwarf              ship between source capacity and yield development
cultivars compared to those of traditional landraces            and the low throughput of traditional phenotyping
and cultivars increased the resistance to lodging caused        methods explain the gap. Therefore, overcoming these
by wind and rain during ripening, which enabled                 difficulties is an important challenge for the new gener-
breeders to increase the sink size and farmers to increase      ation of rice breeding research.
the nitrogen application rate.                                      In the rest of this paper, we will review the genetic
    However, the harvest index appears to be reaching its       factors regulating source capacity, which have been
theoretical maximum in recent developed high yielding           studied by means of transgenic approaches. We will
cultivars. The excess nitrogen input creates water pollu-       then highlight the phenotyping tools that can be used
tion and increases the production cost. Therefore, in           to promote genetic analysis of source capacity, and
future breeding programs, it will be necessary to in-           summarize our current understanding of the genetic
crease the resource-use efficiency to improve the rice          controls of source capacity based on natural genetic
yield. Genetic enhancement of εi may not further in-            variation. We will conclude by summarizing the chal-
crease yield because εi can be maximized more easily by         lenges that must be solved to increase source capacity
controlling planting density in modern farming systems          and grain yield in rice.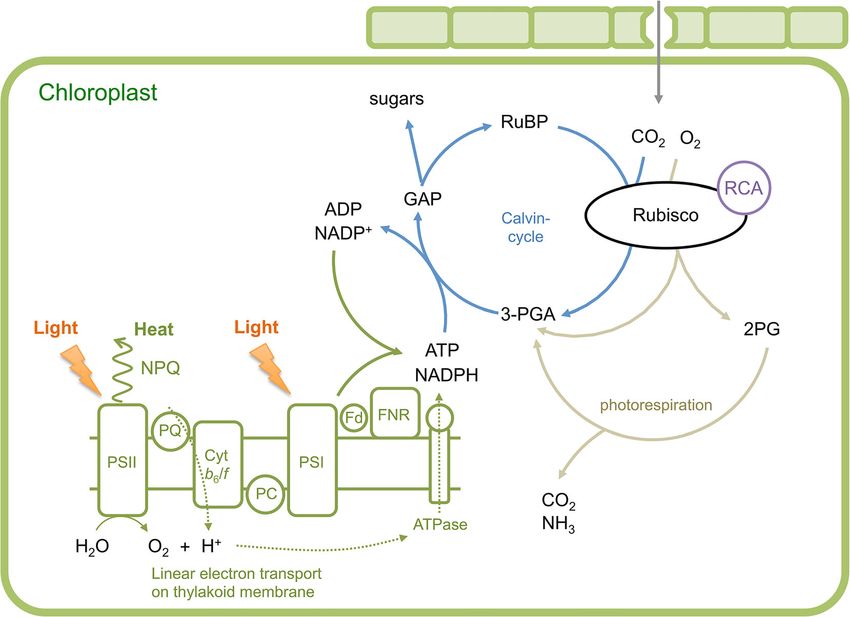
Mol Breeding         (2020) 40:20                                                                               Page 3 of 23   20

Physiological limitations of source capacity in rice                 this process drive the Calvin cycle and other metabolic
                                                                     pathways in the chloroplast stroma. The CO2 that passes
Photosynthesis is the most basic trait that regulates the            through the air into the chloroplast stroma is fixed by
source capacity of plants, as it provides the energy for all         ribulose-1,6-bisphosphate (RuBP) carboxylase/
subsequent processes. Figure 1 illustrates the key struc-            oxygenase (Rubisco, EC 4.1.1.39), which is the initial
tures involved in light harvesting, and their relationship           enzyme involved in CO2 fixation in the Calvin cycle
to the Calvin cycle. Sunlight energy captured by the                 (Simkin et al. 2019; Fig. 1).
pigments of the light-harvesting system is transferred                  Rice uses the C3 photosynthetic pathway, as do
to the reaction center of photosystems I and II (PSI and             other key crops such as wheat, soybean, and tomato,
PSII, respectively) in the thylakoid membrane of the                 and this creates different photosynthetic limitations
chloroplast. Electrons generated by the splitting of water           than those faced by plants such as maize that use the
in PSII are transferred to NADP+ in PSI, resulting in                C4 photosynthetic pathway (Edwards et al. 2011). The
NADPH production. This linear electron transport,                    limitations of C3 photosynthesis can be subdivided
where electrons pass through the cytochrome b6/f com-                into two general categories: biochemical and diffu-
plex, generates a proton gradient across the thylakoid               sion. Biochemical limitations can be further
membrane. The proton gradient enables ATP production                 subdivided into the capacity of Rubisco to consume
by ATP synthase. The ATP and NADPH generated by                      RuBP, which is referred to as a Rubisco capacity

Fig. 1 Schematic illustration of photosynthesis reactions in C3      ATP are used in the Calvin cycle to produce triose phosphate for
plants modified from Peterhansel et al. (2008). Light energy re-     carbohydrate metabolism. PQ, plastoquinone; Cyt b6/f, cyto-
ceived by chlorophyll is transferred to the reaction center of       chrome b6/f complex; PC, plastocyanin; Fd, ferredoxin; FNR,
photosystem II and I (PSII and PSI, respectively), which drives      ferredoxin-NADP reductase; GAP, glycerol aldehyde phosphate;
electron transport to reduce NADP+. The excess energy will be        3-PGA, 3-phosphoglycerate; RuBP, ribulose-1,5-bisphosphate;
dissipated by non-photochemical quenching (NPQ) at PSII. The         Rubisco, RuBP carboxylase/oxygenase; RCA, Rubisco activase;
electron transport also provides a proton (H+) gradient across the   2PG, 2-phosphoglycolate
thylakoid membrane, generating ATP production. NADPH and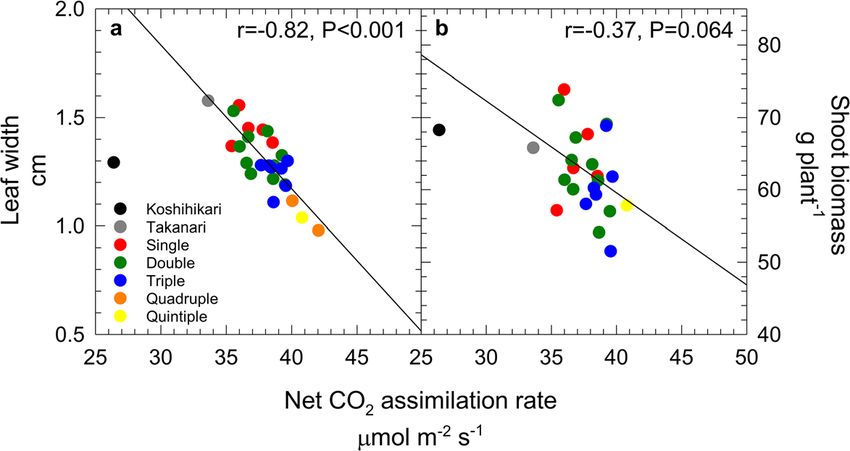
20     Page 4 of 23                                                                       Mol Breeding       (2020) 40:20

limitation, and the capacity to regenerate RuBP. These                Enhancing Rubisco capacity
limitations can be analyzed by plotting the CO2 as-
similation rate (A) versus the intercellular CO2 con-                 Rubisco is the most abundant enzyme in the photosyn-
centration (Ci); the resulting curve reveals the limiting             thetic apparatus, accounting for about a quarter of the
step independent of the stomatal diffusion effect                     whole-leaf protein in rice and other C3 plants (Makino
(Fig. 2). At lower CO2 concentrations, the A/Ci rela-                 et al. 1984). Despite this, it is often the limiting factor for
tionship is linear and represents a state in which the                carbon gain at current atmospheric CO2 levels. Rubisco
carboxylation reaction regulated by Rubisco capacity                  has a relatively slow catalytic rate (i.e., low kcat), and as a
is limiting A. At higher CO2 concentrations, the limiting             consequence, large amounts of the enzyme are required
step becomes the RuBP regeneration capacity, which is                 to sustain an adequate photosynthesis rate for plant
associated with the activities of the enzymes in the                  growth (Carmo-Silva et al. 2014). Increasing kcat by
Calvin cycle. At even higher CO2 concentrations, CO2                  introducing Rubisco from other organisms with a great-
assimilation is limited by the inorganic phosphate (Pi)               er kcat could increase A, but there is a strong negative
regeneration, which is recycled from the carbohydrates,               correlation between kcat and Rubisco specificity for its
although this limitation is unusual in typical field con-             two substrates (CO2 versus O2), which diminishes the
ditions. At the current atmospheric CO2 concentration,                potential benefits of a higher kcat (Savir et al. 2010). C4
A of most C3 species lies in the region of the A/Ci curve             species have a higher Rubisco kcat but lower specificity
that is co-limited by the Rubisco and RuBP regeneration               than in C3 plants; this is because C4 plants can maintain
capacities (Yamori et al. 2011a). We will discuss these               a high CO2 concentration around Rubisco in the bundle-
biochemical limitations in more detail in sections “En-               sheath cells, so that the low specificity is less problem-
hancing Rubisco capacity” and “Enhancing RuBP re-                     atic. Introduction of the Rubisco small subunit from
generation capacity” .                                                Sorghum bicolor, a C4 plant, into rice significantly
    We noted earlier that photosynthesis is limited by                increased the rice kcat, but the specificity and electron
both biochemical and diffusion limitations. Diffusion                 transport capacity declined, resulting in no net increase
limitations reduce the rate of CO2 delivery to the site               of A (Ishikawa et al. 2011).
of carboxylation, and can be significant, because CO2                     Increasing the amount of Rubisco is another possi-
gas must diffuse through several tissues such as mem-                 bility. Overexpressing the genes responsible for Rubisco
branes and the cytosol to reach the chloroplast stroma.               production using transgenic approaches has overcome
We will discuss diffusion limitations in section “Increas-            Rubisco limitation in rice at low CO2 concentrations
ing the CO2 concentration around Rubisco”.                            (Suzuki et al. 2007; Sudo et al. 2014). However, under

Fig. 2 Modeled responses of net CO2 assimilation rate (A) mod-        concentration, showing regions of the curve where Rubisco ca-
ified from Sage et al. (2017). a The responses of biochemical         pacity, RuBP regeneration capacity and Pi regeneration capacity
limitations on A are shown for Rubisco capacity limitation (solid     limit A. Responses were modeled according to Farquhar et al.
line), RuBP regeneration capacity limitation (dashed line), and Pi    (1980) at 21% O2 and 30 °C. Rubisco Vcmax was assumed to be
regeneration capacity limitation (dotted line). b The corresponding   100 μmol m−2 s−1, Jmax was 180 μmol m−2 s−1, and triose phos-
response of A in a model leaf to variation in intercellular CO2       phate use rate 12.5 μmol m−2 s−1
Mol Breeding (2020) 40:20 Page 5 of 23 20
continuously increasing levels of atmospheric CO2, this Caemmerer 2000). Increasing the electron transport rate
may no longer be a useful strategy, because overproduc- of the thylakoid membrane has been attempted using
tion of Rubisco decreases the allocation of N to other transgenic approaches. The cytochrome b6/f complex
photosynthetic enzymes (Suzuki et al. 2007; Sudo et al. plays an important role in both linear electron transport
2014). With increasing atmospheric CO2, it may be to produce ATP and NADPH and cyclic electron trans-
more beneficial to reallocate N from Rubisco to other port to generate ATP (Yamori and Shikanai 2016; Fig.
enzymes in Calvin cycle. A small decrease in Rubisco 1). A strong linear relationship has been observed be-
content using RNA interference to rbcS genes increased tween the chloroplast electron transport rate and the
A and biomass production in rice under conditions of content of the cytochrome b6/f complex in tobacco
elevated CO2 (Kanno et al. 2017). (Yamori et al. 2011b). These authors also found that
The Rubisco enzyme must be activated to become the content of the cytochrome b6/f complex was closely
catalytically functional (Spreitzer and Salvucci 2002). correlated with A and grain yield in a study that used
Rubisco activation decreases at high temperatures in antisense rice plants with decreased content of the
many plant species, including rice (Salvucci and Rieske FeS protein, which encodes a protein component
Crafts-Brandner 2004; Yamori and von Caemmerer of the cytochrome b6/f complex (Yamori et al. 2016b).
2009). Rubisco activase is the activator protein, which In Arabidopsis, overproduction of Rieske FeS protein
functions to remove inhibitory sugars from the active increased the electron transport rate and biomass pro-
site of Rubisco and enable carbamylation and RuBP duction (Simkin et al. 2017b). NADP is the final elec-
entry (Carmo-Silva et al. 2014). In rice, overexpression tron acceptor during photosynthetic electron transport in
of the maize Rubisco activase gene increased Rubisco the chloroplast, which can be changed to NAD (Wigge
activation under warm temperatures, although the et al. 1993). NAD kinase regulates the balance between
Rubisco content decreased (Fukayama et al. 2012). Ac- NAD and NADP (and between their protonated forms,
tivation limitation is also apparent when plants that are NADH and NADPH) through its catalysis of NAD
acclimating to low light levels experience a sudden phosphorylation in the presence of ATP (Kawai and
increase of the light intensity (Pearcy and Seemann Murata 2008). The overexpression of Arabidopsis genes
1990). Overexpressing Rubisco activase genes acceler- for chloroplastic NAD kinase (AtNADK2) in rice plants
ates the photosynthetic response to fluctuating light resulted in an increased electron transport rate and in-
levels in rice, especially at high temperatures such as creased A (Takahara et al. 2010).
40 °C (Yamori et al. 2012). These results suggest that RuBP regeneration requires 12 reactions that are
engineering plants to have a higher Rubisco activase catalyzed by 10 different enzymes to recycle 3-
content would be an efficient strategy to promote adap- phosphoglyceric acid (3-PGA), which is the initial prod-
tation to high temperatures and fluctuating light levels. uct of Rubisco, into RuBP (Fig. 1). Modification of the
activities of these enzymes could increase the RuBP
Enhancing RuBP regeneration capacity regeneration rate. Raines (2003) hypothesized that the
activity of sedoheptulose bisphosphatase (SBPase) is
The limitation caused by RuBP regeneration could oc- the major determinant of energy flow through the Calvin
cur at sub-saturating light intensities, or at atmospheric cycle. To support their hypothesis, overexpressing
CO2 concentrations greater than current values under transgenes for Chlamydomonas SBPase in tobacco
light-saturated conditions (Farquhar et al. 1980; von chloroplasts by 60–430% led to a 25% increase of A
Caemmerer 2000; Fig. 2). Limitations created by the and a 30–50% increase of biomass production. Similar
RuBP regeneration capacity will also occur when leaves trials have been conducted in Arabidopsis (Simkin et al.
experience photoinhibition, which can result from either 2017a), tomato (Ding et al. 2016), and wheat (Driever
light-induced damage or quenching of excess light en- et al. 2017), and all these studies showed increased A
ergy within the light harvesting apparatus (Sage et al. and increased plant biomass production. On the other
2017). The RuBP regeneration capacity is often equated hand, our literature review found no published studies of
with electron-transport limitations, since the flux of transgenic SBPase in rice.
electrons to support ATP and NADPH synthesis is lim- Transgenic Arabidopsis and tobacco plants that
iting at both sub-saturating light intensity and at saturat- overexpressed the genes for plastid aldolase, one of the
ing light intensity with elevated CO2 levels (von enzymes comprising the Calvin cycle, exhibited20 Page 6 of 23 Mol Breeding (2020) 40:20
increased CO2 assimilation, biomass production, and membrane H+-ATPase in guard cells could promote
yield (Hatano-Iwasaki and Ogawa 2012; Uematsu stomatal opening in response to light (Wang et al.
et al. 2012). This suggests that increasing the aldolase 2013). The gene SLOW ANION CHANNEL ASSOCI-
level could increase photosynthesis in rice. ATED 1 (SLAC1) is specifically localized to the plasma
membrane of the guard cells, where it regulates stoma-
Increasing the CO2 concentration around Rubisco tal closure in response to CO 2 (Negi et al. 2008;
Kusumi et al. 2017). The slac1 mutant in rice showed
Rubisco is a dual-function enzyme that can fix both CO2 constitutive opening of stomata and a high A (Kusumi
and O2 using its primary substrate, RuBP (Fig. 1). The et al. 2012). Both approaches have the potential to
oxygenation of RuBP by Rubisco and the subsequent enhance rice photosynthesis, although maintaining
metabolism of the P-glycolate product to 3-PGA, which open stomata comes at the cost of increased water loss,
then enters the Calvin cycle to be converted back to which may be problematic for rainfed rice.
RuBP, are termed “photorespiration” (Bauwe et al. gm includes the conductance of CO2 from the inter-
2010). In this process, ammonia and previously fixed cellular airspace into the chloroplast stroma by diffusion
CO2 are given off by glycine decarboxylase in the across several barriers. gm is negatively correlated with
mitochondria. ATP is required to phosphorylate cell wall thickness, since thinner cell walls promote CO2
glycerate to 3-PGA, and energy is required to diffusion (Scafaro et al. 2011; Tosens et al. 2012). A
reassimilate ammonia into amino acids. The rate of the larger chloroplast surface area facing the intercellular
oxygenation reaction that initiates photorespiration in- airspace may also increase gm (Terashima et al. 2011).
creases with temperature, and at temperatures above Recently, Ellsworth et al. (2018) reported that a rice
30 °C under the current atmospheric CO2 level, it can mutant with disruptions in its cell wall mixed-linkage
inhibit A by more than 30% (Sage et al. 2012). Increas- glucan production exhibited significantly reduced gm
ing the CO2 concentration around Rubisco suppresses due to a decrease in the chloroplast surface area com-
the oxygenase reaction of photorespiration and in- pared to the wild type. Our literature review found no
creases A, and should therefore reduce losses to evidence of improved anatomical properties resulting in
photorespiration. increased gm, so this possibility should be tested in the
One strategy to increase the CO2 concentration future.
around Rubisco involves promoting CO2 diffusion Some aquaporins located in the plasma membrane
from the ambient air into the chloroplast stroma, where are permeable to CO2, so their presence promotes CO2
carboxylation occurs (Fig. 1). During this diffusion, diffusion across the plasma membrane. In tobacco, over-
CO2 must pass through the boundary layer around the expression of an aquaporin gene by 20% was associated
leaf, the stomata, intercellular air spaces, the meso- with a 20% increase in A (Flexas et al. 2006). Similarly,
phyll cell walls and cytosol, and finally the chloroplast overexpression of a barley aquaporin gene in transgenic
envelope. Impediments to diffusion at each of these rice increased gm by 40%, resulting in a 14% increase in
steps reduce the CO2 concentration in the chloroplast, A as well as a 27% increase of gs (Hanba et al. 2004).
with the two largest reductions being associated with Another opportunity to increase the CO2 concentra-
the stomatal conductance (gs) and mesophyll conduc- tion around Rubisco would be to introduce a
tance (gm). gs can be determined by the stomatal den- photorespiratory bypass to reassimilate CO2 and inhibit
sity of the leaf surface and the size of each stomatal its loss through photorespiration. Engineering to intro-
pore (Ohsumi et al. 2007b). The stomatal density has duce three enzymes—glycolate dehydrogenase,
b e e n m o d u l a t e d b y o v e r- e x p r e s s i o n o f t h e glyoxylate carboligase, and tartronic semialdehyde
STOMAGEN gene and treatment of leaves with the reductase—from E. coli into Arabidopsis chloroplasts
stomagen peptide in Arabidopsis, which increased A promoted CO2 release from glycolate inside the chloro-
(Sugano et al. 2010; Tanaka et al. 2013). Stomatal plast, rather than in the mitochondria (Kebeish et al.
opening in response to light is mediated by signaling 2007). The released CO2 was then refixed by Rubisco,
from phototropin to plasma membrane H+-ATPase in resulting in higher A (Kebeish et al. 2007). Testing of a
the stomatal guard cells, which drives K+ uptake by similar approach in tobacco plants also increased A and
activating inwardly rectifying K+ channels (Yamauchi biomass production (South et al. 2019). However, we
et al. 2016). Overexpression of the genes for plasma found no studies of this approach in rice.Mol Breeding (2020) 40:20 Page 7 of 23 20
The most efficient option to inhibit photorespiration will probably not be found in the conserved core pho-
would be the development of C4 rice (Zhu et al. 2010b; tosynthetic genes but rather in genes for auxiliary factors
Sage et al. 2017). C4 plants, such as maize and sorghum, or modifiers of photosynthesis (Flood et al. 2011). One
have evolved a carbon-concentrating mechanism based example supporting this hypothesis is that Rubisco ki-
on the activities of two separate types of cell. CO2 is netic properties are very similar among modern rice
initially fixed in the mesophyll cells by the enzyme cultivars, including both indica and japonica sub-spe-
phosphoenolpyruvate carboxylase (PEPC) to produce cies, although photosynthesis rate significantly differs
C4 organic acids such as oxaloacetate and malate. The between these rice plants (Makino et al. 1987;
organic acid diffuses to the bundle-sheath cells, where Kanemura et al. 2007). Therefore, identification of ge-
the acid is decarboxylated and the CO2 is fixed by netic control and gene network using the natural genetic
Rubisco. This system increases the CO2 concentration resources will expand our knowledge of source regula-
in the bundle sheath cells to a saturating level at the tion, which has been studied using transgenic systems.
Rubisco active site, thereby reducing photorespiration to Furthermore, the advantage of this analysis is that the
negligible levels (von Caemmerer and Quick 2000). In alleles can be easily applied in breeding programs based
addition to the higher photosynthetic rate, the benefits of on MAS.
the C4 pathway include improved nitrogen-use and Mutant analysis could also provide a useful knowl-
water-use efficiency (Sage 2004). However, the engi- edge of source regulation mechanisms. Mutant panels
neering of C4 rice is not a simple matter, since C4 plants produced by γ-ray irradiation mutagenesis,
evolved millions of years ago, and this required coevo- retrotransposon mutagenesis, insertional mutagenesis,
lution of many biochemical and physiological functions. and chemical mutagenesis have been available for stud-
The overexpression of four genes encoding key en- ies of rice, Arabidopsis, and other plant species. Once a
zymes—PEPC, pyruvate orthophosphate dikinase, unique mutant for source capacity among the mutant
NADP-malate dehydrogenase, and NADP-malic panels is found, the causal gene can be identified via
enzyme—from C4 metabolism in rice plants did not genetic analysis or whole genome sequence analysis
enhance photosynthesis (Taniguchi et al. 2008). More (Abe et al. 2012). In most cases, the mutants have
effort will be necessary to modify anatomical properties negative effects on source capacity and growth, while
such as the Kranz anatomy and to produce appropriate some mutants enhance leaf photosynthesis rate, total
levels of enzyme activities (Sage and Zhu 2011). carbon gain and biomass production compared to
Increasing the affinity of Rubisco for CO2 would also wild-type (Kusumi et al. 2012; Tanaka et al. 2013; Jin
reduce photorespiration. However, as there is a strong et al. 2016; Feldman et al. 2017). These mutants could
negative correlation between Rubisco specificity and be used for breeding programs through artificial cross
kcat, attempts to increase specificity have had limited with commercial cultivars. Furthermore, the mutant al-
success (Carmo-Silva et al. 2014). There is a wide range leles as well as natural variant alleles will become can-
of Rubisco specificity and kcat among C3 species and didate transgenes and targets for gene editing, which
algal species. Finding Rubisco with a high CO2 speci- would accelerate the development of new rice
ficity and a moderate kcat would open the possibility to accessions.
inhibit photorespiration in rice. The concept of “physiological breeding” for efficient
accumulation of natural alleles for high yield through
Enhancing source capacity using natural genetic cross-breeding was proposed by Reynolds and
resources and mutants Langridge (2016). This approach consists of the follow-
ing steps: designing a plant with theoretically improved
Natural genetic variation among cultivars, subspecies, adaptation; selecting appropriate genetic resources; de-
or landraces involves a potentially large gene pool that veloping phenotyping protocols to maximize the reso-
could be utilized for genetic improvement of source lution of physiological trait expression; conducting ge-
capacity. To apply this variation to the breeding pro- netic analysis; strategic hybridization (crossing and se-
grams, QTL analysis and subsequent map-based clon- lection) to achieve cumulative improvements in gene
ing would be useful. It is hypothesized that many genes action; and field evaluation of the genetic gains. For
with minor effects relate to the diversity of natural precise identification of genetic factors for physiological
genetic variation. In addition, the natural genetic alleles traits without any interference from experimental noise,20 Page 8 of 23 Mol Breeding (2020) 40:20
improved phenotyping methods and an appropriate maximum electron transport rate, leaf nitrogen content,
choice of the genetic mapping population will be critical and leaf dry mass per unit area (Silva-Perez et al. 2017;
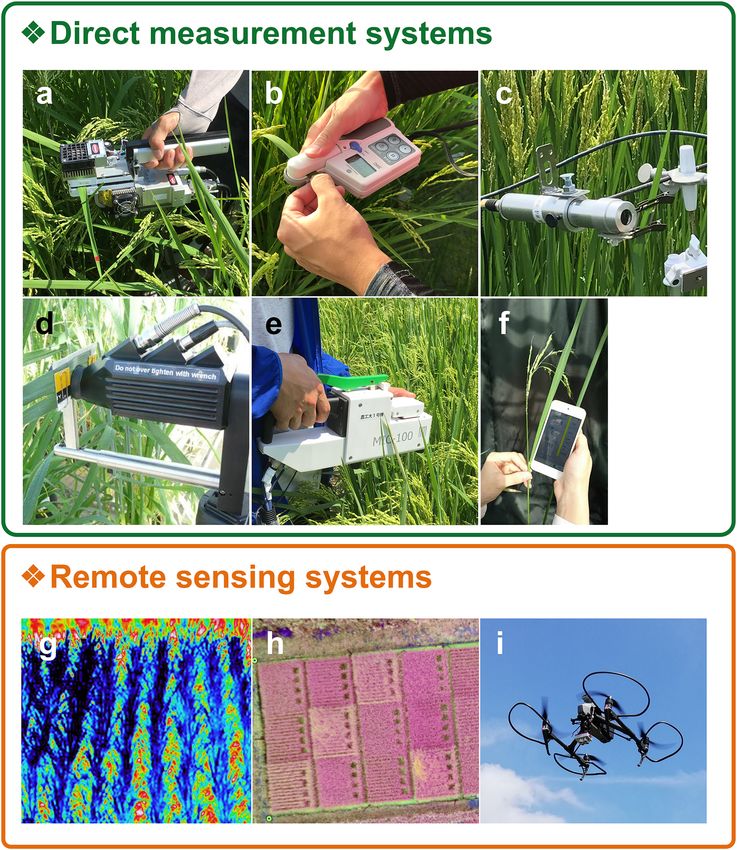
(Reynolds and Langridge 2016). Phenotyping requires Fig. 3d). More recently, a new high-throughput gas
systems that enable high-throughput evaluations, exchange system to measure A was released (Fig. 3e).
because hundreds to thousands of accessions should An advantage of these measurements is that they require
be examined to conduct QTL analysis and GWAS. only a few seconds to obtain data from a leaf. However,
High accuracy is also required because the traits these commercial systems require a leaf chamber or
that determine source capacity are strongly affected clipping of the leaf for their measurements, which
by environmental conditions surrounding the plants, makes it difficult to simultaneously compare multiple
and most physiological traits have large inter- samples.
individual variation. These properties are also re- Remote sensing techniques enable screening of pho-
quired in mutant screening to facilitate identifica- tosynthesis traits at a larger scale (Fig. 3g–i). For exam-
tion of unique mutants. In the rest of section “En- ple, canopy temperature is negatively correlated with the
hancing source capacity using natural genetic transpiration rate, which in turn is positively correlated
resources and mutants”, we discuss examples of with stomatal conductance. Therefore, canopy tempera-
phenotyping methods and genetic mapping popula- ture measured using infrared thermography could serve
tions to support an analysis of source capacity, and as a proxy for stomatal conductance (Leinonen et al.
to address recent advances in genetic analysis 2006; Fig. 3g). The normalized-difference vegetation
(Table 1). index (NDVI), which is measured using a spectral sen-
sor, has been widely used to monitor plant canopy
Phenotyping methods for source capacity growth (Tattaris et al. 2016; Fig. 3h). These systems
could be mounted on unmanned aerial vehicle (UAV),
For photosynthetic measurements, the most widespread which would allow a comprehensive analysis of photo-
procedure is using a gas-exchange system attached to an synthesis throughout a field (Fig. 3i). For more details,
infrared gas analyzer (Fig. 3a). This system has the see Furbank et al. (2019). However, it is necessary to
advantage of directly and non-destructively measuring validate the results obtained using remote sensing
A and transpiration, thereby allowing calculation of gs methods by comparing the results with highly accurate
and Ci for intact leaves and allowing repeat measure- gas-exchange measurements.
ments of the same leaves. However, measurements re- To evaluate a crop’s canopy structure, one classi-
quire the use of a leaf chamber, and it takes several cal method is calculation of the light-extinction coef-
minutes for the atmosphere within the chamber to sta- ficient following the Beer–Lambert equation (Monsi
bilize. This greatly reduces the sample size that can be 1953). This requires biomass sampling at intervals of
analyzed in 1 day (100 samples per day per machine at 10 to 20 cm from the top of the canopy to the bottom.
most). Alternative systems to evaluate photosynthetic Unfortunately, this cannot be employed in QTL anal-
capacity are leaf chlorophyll SPAD meters and chloro- ysis due to its high time requirements. As the light-
phyll fluorescence meters. SPAD meters measure the extinction coefficient is strongly correlated with the
difference in transmittance through the leaf between angle of the leaves in the canopy, direct measurement
red light (650 nm) and infrared light (940 nm), which of leaf angles has been used in QTL analysis (Hu
is correlated with chlorophyll abundance (Uddling et al. et al. 2012; Cai et al. 2015). Smartphone or tablet
2007; Fig. 3b). Chlorophyll fluorescence meters mea- software is now available to measure leaf angles and
sure the efficiency of PSII photochemistry based on the store the data, thereby improving the efficiency (San
leaf absorption of pulse-amplitude-modulated (PAM) et al. 2018a, b; Fig. 3f). Recent attempts to construct
actinic light (Fig. 3c). This method allows calculation a three-dimensional canopy model from ground-
of factors such as the photosynthetic electron transport based cameras have been reported (Cabrera-Bosquet
rate, the intrinsic light harvesting efficiency, and non- et al. 2016; Fernandez et al. 2017; Wang et al.
photochemical quenching (NPQ) (Furbank et al. 2019). 2017b). Although obtaining high-throughput mea-
A novel model was reported that used hyperspectral surements for canopy structure remains a challenge,
reflectance measurements (at wavelengths from 350 to development of new or improved software and hard-
2500 nm) to estimate the maximum carboxylation rate, ware may eventually overcome this issue.Mol Breeding (2020) 40:20 Page 9 of 23 20
Table 1 Genetic identification of QTLs associating to source capacity in rice
Phenotypes for mapping Gene(s) of Population for the analysis Growth References
interest condition
Leaf photosynthesis
Gas exchange rate GPS, CAR8 DHLsa, RILs, BILs, CSSLs Field Teng et al. (2004); Zhao et al.
(2008); Hu et al. (2009);
Adachi et al. (2011a, b, 2017,
2019); Gu et al. (2012);
Takai et al. (2013)
Stomatal conductance F2 Field Price et al. (1997)
Nitrogen content BILs, CSSLs Field Ishimaru et al. (2001a);
Hirotsu et al. (2017)
Rubisco content BILs, CSSLs Field Ishimaru et al. (2001a); Kanbe et al.
(2009); Ishimaru et al. (2001c)
⊿13C RILs, BILs, CSSLs Field Ishimaru et al. (2001c); Takai et al.
(2006, 2009); Kanbe et al. (2008)
Canopy temperature BILs, CSSLs Field Fukuda et al. (2018)
Stomatal density BILs Field Ishimaru et al. (2001b)
Chlorophyll content (leaf DHLs, BILs Field Teng et al. (2004); Ishimaru et al.
extracts) (2001c)
Chlorophyll content (SPAD) OsPTR4 RILs Field Hu et al. (2009); Ye et al. (2017)
Chlorophyll fluorescence CSSLs Field Gu et al. (2012)
NPQ (Closed FluorCam) OsPsbS1 BILs Greenhouse Kasajima et al. (2011)
Chlorophyll content Ghd7, NAL1 529 O. sativa accessions Field Wang et al. (2015)
(SPAD and leaf extracts) including both landraces
and elite varieties
Chlorophyll content (SPAD) Diverse panel of 227 rice Climate chamber Lin et al. (2018)
varieties
NPQ (PAM derived) OsPsbS1 529 O. sativa accessions Field Wang et al. (2017a)
including both landraces
and elite varieties
Leaf senescence
Chlorophyll content (SPAD) F2, BC1F1-BC1F3 pot Abdelkhalik et al. (2005);
Yoo et al. (2007)
Chlorophyll content (SPAD) DHLs, RILs field Jiang et al. (2004);
Yamamoto et al. (2017)
Chlorophyll content (SPAD) OsSG1 368 O. sativa accessions field Zhao et al. (2019)
Canopy structure
Leaf angle F2, F4, BC1F1, Field Li et al. (1999); Hu et al. (2012);
San et al. (2018a)
Tiller angle PROG1, TAC1 F2 Field Yu et al. (2007); Tan et al. (2008);
Wu et al. (2018b)
Tiller angle PROG7 F2 Pot Hu et al. (2018)
Tiller angle TAC3, D2 529 O. sativa accessions Field Dong et al. (2016)
including both landraces
and elite varieties
Translocation rate
Non-structural RILs Field Takai et al. (2005);
carbohydrate (NSC) Phung et al. (2019)
Non-structural Diverse panel of 95 Field Liu et al. (2015)
carbohydrate (NSC) rice accessions
a
Double haploid lines20 Page 10 of 23 Mol Breeding (2020) 40:20 Fig. 3 Examples of phenotyping methods to evaluate source Rapid photosynthesis measuring system (MIC-100, Masa Interna- activity of crops. Two main categories of systems physically tional, Japan). f Leaf angle measurement with original app contacting plant sample and remote sensing techniques were installed to iPod touch. g Canopy temperature measurement from shown. a Portable gas exchange system (LI-6400, LI-COR, the above of fields. Image was reprinted from Fukuda et al. (2018). USA). b Chlorophyll meter (SPAD-502, Konica Minolta, Japan). Darker blue color indicates lower temperature than surroundings. c Chlorophyll fluorescence measuring system (Monitoring PAM, h Normalized difference vegetation index (NDVI) images taken Walz, Germany). d Reflectance spectra measuring system with from the above of fields. Darker red indicates an area with higher chamber clip (FieldSpec®3, Analytical Spectral Devices, USA). NDVI value. i Unmanned aerial vehicle with four propellers The photograph was reprinted from Silva-Perez et al. (2017). e
Mol Breeding      (2020) 40:20                                                                      Page 11 of 23   20

Plant materials for efficient genotypic analysis             recently developed high-yielding indica cultivar
                                                             ‘Takanari’, which had the highest A. These studies sug-
Appropriate selection of plant materials is essential for    gest that natural genetic resources would be potential
successful genetic analysis of source capacity. In many      source materials for breeding to improve photosynthe-
cases, F2 or BC1F2 populations derived from biparental       sis. However, no clear trend of increasing A has been
crosses are used due to their ease of development            found since 1960s between indica cultivars (Hubbart
(Yamamoto et al. 2014). Source capacity traits such as       et al. 2007) or between japonica cultivars (Adachi
photosynthesis are likely to be affected by the environ-     et al., unpublished data). This suggests that the photo-
mental conditions, and are regulated by many QTLs            synthetic rate has not been improved by recent rice
with small effects (van Bezouw et al. 2019). Therefore,      breeding programs.
to accurately identify QTLs and their effects, it is nec-       The strongest determinants of the variation of A are
essary to employ an appropriate number of replicates,        likely to be differences in the leaf N content, because it
which is impossible with F2 populations. Recombinant         closely associates with the contents of Rubisco and
inbred lines (RILs) and backcrossed inbred lines (BILs)      other photosynthetic proteins (Makino et al. 1994). This
consisting of several homozygous plant series enable         hypothesis is supported by the close correlation between
repeat measurements (Yamamoto et al. 2014). A set of         A and leaf N content (Cook and Evans 1983; Adachi
chromosome-segment-substitution lines (CSSLs) has            et al. 2019). However, some reports showed a stronger
also been applied to the identification of physiological     correlation between gs and A than between leaf N con-
QTLs (Adachi et al. 2010; Ookawa et al. 2016). The use       tent and A, and the variation of A per unit of leaf N (i.e.,
of CSSLs makes QTL analysis simpler because a single-        photosynthetic nitrogen-use efficiency) could be ex-
CSSL line carries a single chromosome segment from a         plained by the variation of gs (Kanemura et al. 2007;
donor parent in the genetic background of the recipient      Ohsumi et al. 2007a; Adachi et al. 2011a). Thus, culti-
cultivar, and a simple comparison of a phenotypic value      vars with high gs may be useful materials to breed rice
between lines can reveal the QTL location (Fukuoka           with high nitrogen-use efficiency and high photosynthe-
et al. 2010; Yamamoto et al. 2014). Compared with            sis. The potential cost of high gs is lower water-use
biparental populations, such as RILs, BILs, or CSSLs,        efficiency (WUE), which may decrease rice yield, par-
GWAS can use more than 100 accessions as the parental        ticularly under the water stress that is common in rain-
population. It can then clarify the variation of QTLs in a   fed rice.
natural rice population. Applying GWAS to the corre-            In addition, gm is a key determinant of the variation
sponding genome sequences identified by next-                of A in rice and other crop species (Giuliani et al. 2013;
generation sequencing techniques can identify both the       Barbour et al. 2016; Ouyang et al. 2017). An advantage
gene location and (sometimes) its functional position        of having high gm would be higher WUE because
inside the gene locus (Yano et al. 2016). However,           increased gm enhances A without increase of water loss.
GWAS requires careful selection of varieties to avoid        gm was closely associated with thicker mesophyll cells,
false-positive estimates resulted from a wide range of       with the ratio of the chlorophyll surface area exposed to
population structure (Lipka et al. 2015).                    the internal airspace to the mesophyll surface area ex-
                                                             posed to the internal airspace (Sc/Sm), and a thinner cell
Enhancing photosynthesis                                     wall (Ouyang et al. 2017).
                                                                Several researchers have looked for photosynthetic
Natural genetic variation of photosynthesis among di-        QTLs using direct measurements of gas-exchange pa-
verse rice species and cultivars has been well studied       rameters (Zhao et al. 2008; Gu et al. 2012). Gu et al.
(Jahn et al. 2011; Qu et al. 2017). Cook and Evans           (2012) conducted QTL analysis under both well-
(1983), who evaluated A in 41 rice lines, including wild     watered and water-stress conditions using CSSLs de-
relative species, showed that A of Oryza sativa cultivars    rived from upland and lowland rice cultivars. They
tended to be higher than those of wild African and Asian     discovered an effective QTL for A, and QTLs for gs,
species. Kanemura et al. (2007) evaluated the variation      transpiration rate, Ci, and quantum yield were all
among domesticated Oryza sativa cultivars, and found a       clustered in the same region. Adachi et al. (2011b) found
difference of approximately three times in A between         two QTLs with a large effect on A on chromosomes 4
accessions in the world rice core collection and a           and 8 using an indica/japonica cross population, and
20 Page 12 of 23 Mol Breeding (2020) 40:20 these QTLs also increased gs and the leaf N content. different genetic backgrounds; the others were identified These results suggest that QTLs for A may be closely in one background, meaning that the photosynthetic associated with the leaf N content, with gs, or with both. QTLs were strongly affected by the genetic background Adachi et al. (2019) recently performed a large-scale of a cultivar. This suggests the potential risk of a loss of QTL study using leaf gas-exchange measurements. To function when these alleles are introduced into different comprehensively discover the QTLs behind the varia- rice cultivars. tion in A, the authors used two mapping populations: The underlying genes in the identified QTLs have CSSLs and BILs from a ‘Koshihikari’ (japonica)/ been determined in some follow-up studies by ‘Takanari’ (indica) cross. Each mapping population in- conducting fine-scale genetic mapping. The Green for cluded a series of lines, two with a ‘Koshihikari’ back- Photosynthesis (GPS) gene was isolated from the culti- ground and two with a ‘Takanari’ background (a total of var ‘Takanari’ (Takai et al. 2013). The ‘Takanari’ GPS four series of lines). They identified 10 QTLs for A that allele results from a partial loss of function of NARROW were robust across experimental years, and these are LEAF 1(NAL1) gene, which affects the expression of a expected to be targets for MAS (Fig. 4). Interestingly, PIN transporter protein that regulates polar transport of only 2 of the 10 QTLs could be detected across the auxins (Qi et al. 2008; Jiang et al. 2015). Substitution of Fig. 4 Comprehensive quantitative trait locus (QTL) analysis for net CO2 assimilation rate (A). The A was measured by portable gas photosynthesis reprinted from Adachi et al. (2019). a Graphical exchange system (LI-6400, LI-COR, USA) under atmospheric genotypes of mapping populations. Orange, homozygous for CO2 concentration (370 μmol mol−1) and saturating light Koshihikari; blue, homozygous for Takanari. Backcrossed inbred (2000 μmol photon m−2 s−1) conditions. Ten QTLs with specific lines (BILs) (BKTs and BTKs) were used in 2009 and 2010, and names were repeatedly identified in the same locations in different chromosome segment substitution lines (CSSLs) (T-CSSLs and years K-CSSLs) were used in 2011 and 2012. b Locations of QTLs for
Mol Breeding       (2020) 40:20                                                                      Page 13 of 23   20

the ‘Takanari’ GPS allele into ‘Koshihikari’ increased         indica ‘Takanari’ increased A by 20% compared with a
leaf thickness and the number of mesophyll cells per           wild-type ‘Takanari’ parent with a high photosynthetic
unit leaf area, which increased the leaf N and Rubisco         rate (Adachi et al. 2013). We also observed some en-
contents and thus increased A. Another example of              hancements of gs, gm, nitrogen and Rubisco contents per
genetic screening using gas-exchange measurements              unit leaf area in these pyramided lines (Adachi et al.
was identification of the Carbon Assimilation Rate             2013, 2014). These experiments clearly showed the
(CAR8) gene (Adachi et al. 2017). This gene was iden-          large potential for enhancement by pyramiding natural
tical to DTH8/Ghd8/LHD1, which has been reported to            alleles using artificial crosses. Further enhancements
be a gene that regulates flowering time (Yan et al. 2011;      would be expected by combining these alleles using
Dai et al. 2012). The indica allele of CAR8 increased the      transgenic approaches to permit (for example) overex-
leaf N content, gs, and hydraulic conductivity in a ja-        pression of genes for Calvin cycle enzymes and the
ponica rice background. GPS and CAR8 were different            introduction of photorespiratory bypass. To find the best
from genetic components of the photosynthetic appara-          combination of genes to maximize the increase of A will
tus such as the genes involved in the Calvin cycle or          be the next challenge after we identify the key genes that
electron transport, supporting the hypothesis that these       regulate the photosynthetic rate.
natural alleles indirectly control variations in the factors
that regulate photosynthesis.                                  Delaying leaf senescence
    Several efforts to identify QTLs and genes for pho-
tosynthesis using alternative indexes have been report-        Inhibiting the decrease of photosynthesis that occurs
ed. For example, carbon isotope discrimination (Δ13C)          during leaf senescence is another approach to maximize
in leaf dry matter can reflect the balance between gs and      εc. The most convenient phenotyping method for deter-
biochemical photosynthetic capacity, because the dis-          mining the degree of leaf senescence is recording the
crimination by the leaves increases with increasing gs         change of leaf color over time, as this reflects changes in
and decreasing biochemical capacity. The screening for         the chlorophyll content and can be measured using a
Δ13C identified a QTL that improved both gs and A              compact SPAD meter. Due to the simplicity of this
(Takai et al. 2009). Screening of canopy temperature by        method, many trials for genetic analysis of leaf senes-
capturing thermographic images from 2.0 to 4.5 m               cence have been conducted. From rice mutant screen-
above the rice canopy in the field also identified a           ings, several kinds of mutations have been isolated,
QTL that regulates gs and A (Fukuda et al. 2018).              including chlorina, lesion mimic, albino, and “stay
Kasajima et al. (2011) evaluated NPQ values in de-             green” (Cha et al. 2002; Kusaba et al. 2007; Morita
tached leaves using a chlorophyll fluorescence imaging         et al. 2009; Jiang et al. 2011; Yamatani et al. 2013).
system and found the differences among OsPsbS1 al-             Many QTL studies for leaf senescence have also been
leles responsible for the NPQ variation. Most indica           published because leaf color differences are often ob-
cultivars with lower NPQ values carried an OsPsbS1             served between indica and japonica cultivars (Jiang
allele with a 0.4-kb deletion in the upstream of the gene,     et al. 2004; Abdelkhalik et al. 2005). By referring to
suggesting that the deletion decreased OsPsbS1 expres-         advanced research conducted in Arabidopsis, re-
sion and NPQ levels. OsPsbS1 was also detected using a         searchers have analyzed the relationship between
GWAS approach with a panel of 529 diverse rice acces-          flowering or chlorophyll mutants and the mechanism
sions grown in the field (Wang et al. 2017a). This gene        of chlorophyll degradation based on plant hormones
appears to be a key regulator of variations in NPQ in          such as jasmonic acid and ethylene (Jiang et al. 2007;
rice.                                                          Lee et al. 2015; Sakuraba et al. 2016; Huang et al. 2016;
    Gene pyramiding is a straightforward approach that         Chen et al. 2018). In recent research, GWAS analysis of
can be used to further improve photosynthetic capacity.        the degree of chlorophyll degradation among diverse
Adachi et al. (2014) pyramided the GPS and CAR8                rice accessions revealed that a gene that regulates gluta-
alleles from indica cultivars in the japonica cultivar         thione metabolism was involved in senescence at matu-
‘Koshihikari’, and found increased A values in the             rity, and this gene appears to play an important role in
pyramided line compared with A in the single-QTL               rice adaptation to northern areas (Zhao et al. 2019).
near-isogenic lines. In addition, pyramiding of four dif-      Thus, knowledge of time-dependent molecular mecha-
ferent alleles from the japonica ‘Koshihikari’ in the          nisms responsible for changing of leaf color has been
20 Page 14 of 23 Mol Breeding (2020) 40:20
accumulated, but despite this, researchers have not yet joint (San et al. 2018a). The morphological characteris-
designed a strategy for breeding high-yielding rice by tics of the cells would be primarily regulated by phyto-
maintaining photosynthetic capacity at maturity. One hormones. A phytohormone brassinosteroid was strongly
reason may be that previous experiments focused on associated with leaf angle in rice (Yamamuro et al. 2000;
mutant alleles having negative phenotypic direction in Morinaka et al. 2006; Sakamoto et al. 2006; Tong et al.
photosynthetic capacity or yielding, which could not 2014). A BRASSINOSTEROID INSENSITIVE1 mutant
produce useful allele contributing positive improve- with a semi-dwarf phenotype and erect leaves had 35%
ment. It is therefore necessary to search for mutant higher biomass production than the wild-type at a high
alleles capable of suppressing senescence compared transplanting density (Morinaka et al. 2006). Other phyto-
with the wild-type (Fu et al. 2011), and to perform hormones, including gibberellins and auxins, have been
genetic analysis of high-yielding accessions capable of shown to affect the leaf angle, due in part to the interaction
delaying senescence at maturity (Yamamoto et al. with brassinosteroids (Zhao et al. 2013; Tong et al. 2014;
2017). Zhang et al. 2015). These results suggest that the identified
QTLs for leaf angle are associated with phytohormone
Improving canopy structure activity at the lamina joint.
A canopy structure that reduces light absorption in
Improving photosynthesis to increase food production the top layers of the canopy by minimizing the chloro-
ultimately means maximizing the photosynthetic effi- phyll antennae size would let more radiation penetrate to
ciency of the crop canopy rather than that of individual the lower layers (Ort et al. 2011). Researchers have
plants. The whole-canopy CO2 acquisition represents estimated the benefit provided by a reduced chlorophyll
photosynthetic carbon uptake integrated across the content in the upper layers using simulation models
whole plant, from the sunlit leaves that receive solar (Song et al. 2017; Walker et al. 2018). These estimates
radiation at levels above their light-saturation point to are supported by research on a soybean mutant with a
shaded leaves that are operating below their full photo- chlorophyll b deficiency that allowed more sunlight to
synthetic capacity (Yamori et al. 2016a). The ideal crop reach the lower leaves, resulting in a 30% increase in the
plant structure should optimize the light-use efficiency cumulative daily photosynthesis (Pettigrew et al. 1989).
at each leaf level to maximize the production of carbo- However, this concept has not been explored using
hydrates at the whole-canopy level. Thus, creating a natural genetic resources. Finding an optimal combina-
more uniform light distribution from the top to the tion of genes for leaf chlorophyll content and leaf erect-
bottom of the canopy that can provide shaded leaves ness would contribute to efforts to improve canopy
with a higher light intensity would increase the total photosynthesis.
canopy photosynthesis. Two main approaches have
been employed to distribute sunlight more evenly Improving translocation
throughout the canopy: adjusting the leaf angle and
modifying the leaf chlorophyll content. Translocation is a function of the transportation of car-
Erect leaves can improve light penetration of the crop bohydrate products synthesized in the leaf blade and
canopy (Long et al. 2006). Efforts have been made to their accumulation in the leaf sheath, stem, or grains.
discover QTLs and genes that regulate the leaf angle in Despite the importance of translocation in plant energy
rice (Hu et al. 2012; Cai et al. 2015). A qLIA3 near- systems, its genetic mechanisms remain unclear. Posi-
isogenic line that carries a single chromosome segment tron imaging allows direct observation of translocation
from a donor parent with high leaf erectness showed an of elements in the plant (Matsuhashi et al. 2006). How-
decreased canopy light-extinction coefficient by 13– ever, this method is difficult to apply to many samples to
18% and improved grain yield compared by 5–13% to account for different growing conditions or genetic
a recipient cultivar (San et al. 2018a, b). This supports backgrounds. Instead, many researchers focus on the
the hypothesis that newly developed rice cultivars with a amount of non-structural carbohydrates (NSCs) or the
higher grain yield should be equipped with more erect time course of grain weight (i.e., during grain filling), as
leaves (Yang and Hwa 2008). Leaf angle of rice can be both parameters depend directly on translocation, and
determined by differences in cell division and elonga- can therefore function as proxies for translocation. Sev-
tion between the abaxial and adaxial sides at the lamina eral relevant QTLs were reported by Takai et al. (2005).Mol Breeding (2020) 40:20 Page 15 of 23 20
In addition, Liu et al. (2015) studied the time course of biomass production and yield of crops including rice
grain filling and identified several relevant genomic under free-air CO2 enrichment conditions with en-
regions by means of GWAS. However, there have been hanced photosynthesis rate of individual leaves (Sun
no reports of genetic factors involved in pure transloca- et al. 2009).
tion that can be distinguished from pleiotropic changes Recent studies have clarified the potential genes that
caused by morphological genes. On the other hand, a lot may improve the source capacity, as described in this
of genetic researches using mutants have been conduct- review. Among them, upregulating the genes that regu-
ed, and some effective gene alleles have been identified. late FBPase, facilitating the recovery of NPQ, and in-
These include GIF1, which relates to cell-wall invertase troducing photorespiratory bypass are promising strate-
(Wang et al. 2008); GIF2, which relates to ADP-glucose gies to increase biomass production. Many useful alleles
pyrophosphorylase (Wei et al. 2017); and Flo2, which for source capacity are involved in regulation of photo-
relates to floury endosperm (She et al. 2010; Qiao et al. synthesis, senescence, canopy architecture, and translo-
2010). Increasing knowledge of plant physiology pro- cation, and these have been identified in natural rice
vided evidence that the SWEET family (Ma et al. 2017) genetic resources. These are good examples of the ad-
and the sucrose transporter SUT (Scofield et al. 2007) vances that have been made possible by the “post-ge-
control translocation, and that a transcription factor, nomics era” in rice science. However, large gaps remain
OsDOF11, regulates their expression (Wu et al. between the potential revealed by these genetic tools
2018c). In addition to these findings, a conceptually and improved crop productivity in the field. In most
different approach based on a model of the panicle’s cases, the potential genes have been introduced into
branching structure is being developed (Seki et al. model plants such as Arabidopsis and tobacco, and their
2014). The multifaceted information provided by these influences have been evaluated under controlled envi-
studies will help us to find a “master gene” or “key ronmental conditions or in a greenhouse. These envi-
device” that controls translocation, which in turn will ronments differ greatly from field conditions, with fluc-
improve our understanding of translocation and provide tuating weather and non-uniform soil properties.
clues on how to improve translocation. To estimate the actual genetic gain from photosyn-
thetic QTLs under field conditions, our research group
Challenges to increase rice productivity in the field has conducted field studies using a series of rice lines
that carry one to five QTLs associated with A that were
The ultimate goal of biotechnology and genetic analysis identified by Adachi et al. (2019). The A values in
for source capacity is to increase biomass production pyramided lines increased with an increasing number
and the harvestable yield of crops. Models that estimate of accumulated QTLs (Fig. 5a). However, the biomass
the potential increase of εc showed that strategies such production did not increase (Fig. 5b), which seemed to
as Rubisco modification, improved electron transport, be attributable to the trade-off between A and leaf size.
inhibition of photorespiration, creation of a C4 physiol- The trade-off found in the pyramided lines would be
ogy, and improving canopy structure may increase εc by responsible for the reduced carbon allocation into the
10–30%, and that combining these approaches could photosynthetic organs as a result of increased nutrient
potentially double εc relative to the current level (Long and water resources per unit leaf area (Adachi et al.,
et al. 2006; Zhu et al. 2010a; Long et al. 2015). Simi- unpublished data). Thus, this suggests that breeding to
larly, Yin and Struik (2017) used the GECROS crop improve a single photosynthetic trait risks disrupting the
model to estimate that rice biomass production could be carbon allocation balance between the plant’s organs.
greatly increased by combining several genetic engi- This contradiction is not envisaged in crop models such
neering approaches. The same research group estimated as GECROS (Gu et al. 2014). Without accounting for
that the 25% genetic variation in A among rice cultivars resource balances and the plant’s interaction with its
could be scaled up to a crop level, thereby increasing environment, these attempts to enhance source capacity
biomass by 22–29% across locations and years (Gu will have only limited success.
et al. 2014). More complex models that account for To bridge the gap between biotechnology or genetic
canopy architecture and leaf arrangement have also been mapping trials for source capacity and rice performance
developed (Evens et al. 2010; Wu et al. 2018a). in the field, further research will be necessary. First,
These estimates have been supported by the increased QTL analysis should provide a more sophisticated andYou can also read