Validation of Sentinel-5P TROPOMI tropospheric NO2 products by comparison with NO2 measurements from airborne imaging DOAS, ground-based ...
←
→
Page content transcription
If your browser does not render page correctly, please read the page content below
Atmos. Meas. Tech., 16, 1357–1389, 2023
https://doi.org/10.5194/amt-16-1357-2023
© Author(s) 2023. This work is distributed under
the Creative Commons Attribution 4.0 License.

Validation of Sentinel-5P TROPOMI tropospheric NO2 products by
comparison with NO2 measurements from airborne imaging DOAS,
ground-based stationary DOAS, and mobile car DOAS
measurements during the S5P-VAL-DE-Ruhr campaign
Kezia Lange1 , Andreas Richter1 , Anja Schönhardt1 , Andreas C. Meier1 , Tim Bösch1 , André Seyler1 , Kai Krause1 ,
Lisa K. Behrens1 , Folkard Wittrock1 , Alexis Merlaud2 , Frederik Tack2 , Caroline Fayt2 , Martina M. Friedrich2 ,
Ermioni Dimitropoulou2 , Michel Van Roozendael2 , Vinod Kumar3 , Sebastian Donner3 , Steffen Dörner3 ,
Bianca Lauster3 , Maria Razi3 , Christian Borger3 , Katharina Uhlmannsiek3 , Thomas Wagner3 , Thomas Ruhtz4 ,
Henk Eskes5 , Birger Bohn6 , Daniel Santana Diaz7 , Nader Abuhassan8 , Dirk Schüttemeyer9 , and John P. Burrows1
1 Institute of Environmental Physics, University of Bremen, Bremen, Germany
2 BIRA-IASB,     Royal Belgian Institute for Space Aeronomy, Brussels, Belgium
3 Satellite Remote Sensing, Max Planck Institute for Chemistry, Mainz, Germany
4 Institute for Space Science, FU Berlin, Berlin, Germany
5 KNMI, Royal Netherlands Meteorological Institute, De Bilt, the Netherlands
6 Institute of Energy and Climate Research, IEK-8: Troposphere, Forschungszentrum Jülich GmbH, Jülich, Germany
7 LuftBlick, Innsbruck, Austria
8 Joint Center for Earth Systems Technology, University of Maryland, Baltimore County (UMBC), Baltimore, Maryland, USA
9 European Space Agency, ESA-ESTEC, Noordwijk, the Netherlands

Correspondence: Kezia Lange (klange@iup.physik.uni-bremen.de)

Received: 27 September 2022 – Discussion started: 25 October 2022
Revised: 9 January 2023 – Accepted: 12 January 2023 – Published: 14 March 2023

Abstract. Airborne imaging differential optical absorption     instruments. Stationary measurements were conducted by
spectroscopy (DOAS), ground-based stationary DOAS, and         two Pandora, two Zenith-DOAS, and two MAX-DOAS in-
car DOAS measurements were conducted during the S5P-           struments. Ground-based stationary and car DOAS measure-
VAL-DE-Ruhr campaign in September 2020. The campaign           ments are used to evaluate the AirMAP tropospheric NO2
area is located in the Rhine-Ruhr region of North Rhine-       VCDs and show high Pearson correlation coefficients of 0.88
Westphalia, western Germany, which is a pollution hotspot      and 0.89 and slopes of 0.90 ± 0.09 and 0.89 ± 0.02 for the
in Europe comprising urban and large industrial sources. The   stationary and car DOAS, respectively.
DOAS measurements are used to validate spaceborne NO2             Having a spatial resolution of about 100 m × 30 m, the
tropospheric vertical column density (VCD) data products       AirMAP tropospheric NO2 VCD data create a link between
from the Sentinel-5 Precursor (S5P) TROPOspheric Moni-         the ground-based and the TROPOMI measurements with a
toring Instrument (TROPOMI).                                   nadir resolution of 3.5 km × 5.5 km and are therefore well
   Seven flights were performed with the airborne imaging      suited to validate the TROPOMI tropospheric NO2 VCD.
DOAS instrument for measurements of atmospheric pollu-         The observations on the 7 flight days show strong NO2 vari-
tion (AirMAP), providing measurements that were used to        ability, which is dependent on the three target areas, the day
create continuous maps of NO2 in the layer below the air-      of the week, and the meteorological conditions.
craft. These flights cover many S5P ground pixels within an       The AirMAP campaign data set is compared to the
area of 30 km × 35 km and were accompanied by ground-          TROPOMI NO2 operational offline (OFFL) V01.03.02 data
based stationary measurements and three mobile car DOAS        product, the reprocessed NO2 data using the V02.03.01 of

Published by Copernicus Publications on behalf of the European Geosciences Union.
1358                                      K. Lange et al.: Validation of Sentinel-5P TROPOMI tropospheric NO2 products

the official level-2 processor provided by the Product Algo-       temporal distribution of NO2 in the troposphere is therefore
rithm Laboratory (PAL), and several scientific TROPOMI             required to better understand tropospheric chemistry.
NO2 data products. The AirMAP and TROPOMI OFFL                        Atmospheric NO2 is remotely observed on a variety of
V01.03.02 data are highly correlated (r = 0.87) but show           platforms, including ground-based stations; moving plat-
an underestimation of the TROPOMI data with a slope of             forms such as cars, ships, or aircraft; and environmental
0.38 ± 0.02 and a median relative difference of −9 %. With         satellites. Applying the DOAS (differential optical absorp-
the modifications in the NO2 retrieval implemented in the          tion spectroscopy) technique (Platt and Stutz, 2008) in the
PAL V02.03.01 product, the slope and median relative dif-          UV and visible spectral range, the absorption signature of
ference increased to 0.83 ± 0.06 and +20 %. However, the           NO2 can be identified and column densities can be retrieved.
modifications resulted in larger scatter and the correlation          While earlier satellite missions observed stratospheric
decreased significantly to r = 0.72. The results can be im-        NO2 , NO2 in the troposphere has been retrieved from
proved by not applying a cloud correction for the TROPOMI          space observations since the launch of GOME in 1995
data in conditions with high aerosol load and when cloud           (see, e.g., Burrows et al., 1999; Richter and Burrows, 2002;
pressures are retrieved close to the surface. The influence        Beirle et al., 2010; Boersma et al., 2011; Hilboll et al.,
of spatially more highly resolved a priori NO2 vertical pro-       2013a) to investigate stratospheric O3 chemistry (Dubé et al.,
files and surface reflectivity are investigated using scientific   2020). As NO2 has high spatial variability in the tropo-
TROPOMI tropospheric NO2 VCD data products. The com-               sphere, the spatial resolution has been gradually improved
parison of the AirMAP campaign data set to the scientific          from GOME (ground footprint 320 km × 40 km) to SCIA-
data products shows that the choice of surface reflectivity        MACHY (60 km × 30 km), GOME-2 (80 km × 40 km), OMI
database has a minor impact on the tropospheric NO2 VCD            (13 km × 24 km), and the recent TROPOspheric Monitor-
retrieval in the campaign region and season. In compari-           ing Instrument (TROPOMI) instrument (5.5 km × 3.5 km at
son, the replacement of the a priori NO2 profile in combi-         nadir). With a focus on diurnal variations, projects with geo-
nation with the improvements in the retrieval of the PAL           stationary instruments are now being deployed, such as the
V02.03.01 product regarding cloud heights can further in-          Korean instrument GEMS (Kim et al., 2020), launched in
crease the tropospheric NO2 VCDs. This study demonstrates          February 2020, NASA’s TEMPO (Zoogman et al., 2017)
that the underestimation of the TROPOMI tropospheric NO2           planned for launch in 2023, and ESA’s Sentinel-4 (Ingmann
VCD product with respect to the validation data set has been       et al., 2012) planned for launch in 2024.
and can be further significantly improved.                            To ensure the accuracy of satellite data products for use
                                                                   in research, policy making, or other applications, each data
                                                                   product from satellite sensors needs to be validated and its
                                                                   accuracy determined. Validation measurements are needed in
1   Introduction                                                   polluted and clean regions by independent instruments op-
                                                                   erating on different platforms. Measurements from ground-
                                                                   based sites provide continuous validation data from different
The reactive nitrogen oxides, nitrogen monoxide (NO)               locations for the trace gas products, retrieved from satellite
and nitrogen dioxide (NO2 ), collectively known as NOx             instruments (e.g., Verhoelst et al., 2021). Measurements from
(= NO + NO2 ), are important tropospheric air pollutants and       mobile ground-based platforms like cars enable the observa-
have a strong impact on the tropospheric chemistry. In ad-         tion of the spatial variability in addition to its temporal evolu-
dition to emissions from soils, natural biomass burning, and       tion. Thus, they are used for the comparison with satellite ob-
lightning, they are largely released into the troposphere by a     servations (Wagner et al., 2010; Constantin et al., 2013; Wu
variety of human activities. These include fossil fuel combus-     et al., 2013) and the validation of airborne remote sensing
tion processes of power plants, traffic, and industrial areas,     measurements (Meier et al., 2017; Tack et al., 2017; Merlaud
as well as anthropogenic biomass burning. NOx is primar-           et al., 2018). Airborne remote sensing measurements are an
ily emitted as NO, which reacts with ozone (O3 ) and rapidly       additional valuable source of validation data. Airborne map-
forms NO2 . The NOx sources are spatially and temporally           ping experiments have been performed in the recent years
highly variable, and nitrogen compounds are reactive and           using different aircraft imaging DOAS instruments such as
short lived. As a result, the spatial and temporal variabil-       AMAXDOAS, APEX, AirMAP, SWING, SBI, GeoTASO,
ity of NO2 is large, especially in regions characterized by        or GCAS (e.g., Heue et al., 2005; Popp et al., 2012; Schön-
a variety of NOx emission sources. NOx in the troposphere          hardt et al., 2015; Meier et al., 2017; Tack et al., 2019; Judd
is toxic and impacts the chemical composition and environ-         et al., 2020). The aircraft viewing geometry is similar to that
mental condition, e.g., through tropospheric ozone catalytic       of a satellite, but airborne measurements are able to mea-
production cycles (Chameides and Walker, 1973; Fishman             sure at higher spatial resolution than the satellite sensors.
and Crutzen, 1978; Jacob et al., 1996) or its reaction with the    Airborne observations are only available for short periods
hydroxyl radical, OH, the most important tropospheric day-         and are concentrated on the campaign region, but compared
time oxidizing agent. Accurate knowledge of the spatial and        to measurements from ground-based sites offer the advan-

Atmos. Meas. Tech., 16, 1357–1389, 2023                                              https://doi.org/10.5194/amt-16-1357-2023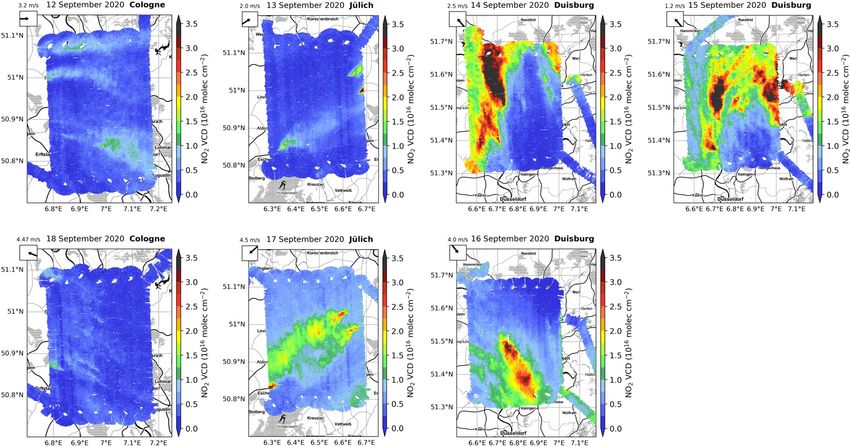
K. Lange et al.: Validation of Sentinel-5P TROPOMI tropospheric NO2 products                                                 1359

tage that larger areas and full satellite ground pixels are ob-    served values. This campaign utilized the mapping capabili-
served in a relatively short period around the satellite over-     ties of the Airborne imaging DOAS instrument for Measure-
pass. Thus, spatiotemporal variations of trace gas data prod-      ments of Atmospheric Pollution (AirMAP) and includes a
ucts become visible at sub-satellite ground pixel resolution.      ground-based component for the evaluation of the AirMAP
The combination of airborne imaging and ground-based sta-          data set, comprised of three mobile car DOAS and six sta-
tionary and mobile measurements enables the validation of          tionary DOAS devices. AirMAP is used for regional map-
satellite data products over a long period and at a high spatial   ping of areas large enough to contain several TROPOMI pix-
resolution.                                                        els. Possible reasons for the bias of the TROPOMI tropo-
   Focusing on TROPOMI, Verhoelst et al. (2021) have com-          spheric NO2 VCD product are investigated by a systematic
pared TROPOMI tropospheric NO2 vertical column densi-              variation in the relevant input parameters in the satellite re-
ties (VCDs) of offline (OFFL) V01.02–V01.03.02 to tro-             trieval.
pospheric NO2 VCD data from a total of 19 MAX-DOAS                    The field campaign site and setup are described in Sect. 2.
ground stations. Depending on the level of pollution, the          The instruments and data sets are explained in Sect. 3. Af-
TROPOMI tropospheric NO2 VCD data show a negative bias             ter a thorough comparison of AirMAP to stationary DOAS
compared to the ground-based observations. Recent studies          (Sect. 4) and car DOAS data (Sect. 5), the campaign data
by Tack et al. (2021) and Judd et al. (2020), comparing air-       set is used to evaluate TROPOMI tropospheric NO2 products
borne tropospheric NO2 VCD data products to TROPOMI                (Sect. 6), including the operational OFFL V01.03.02 product
tropospheric NO2 VCD data of V01.02 and V01.03.01, also            active during the campaign phase and the reprocessed data
show a significant underestimation of TROPOMI compared             PAL V02.03.01. Starting from these base versions, scientific
to the airborne observations.                                      products are developed that enable a dedicated assessment of
   Modifications in the TROPOMI NO2 retrieval led to               the retrieval issues described above and the assumptions used
V02.02, operational since 1 July 2021. The main changes in-        about the NO2 profile, clouds, and surface reflectivity.
fluencing the tropospheric NO2 VCD are that (1) cloud pres-
sures are derived from the new FRESCO-wide algorithm,
leading to lower cloud pressures and thus larger tropospheric      2   The S5P-VAL-DE-Ruhr campaign
NO2 VCDs over polluted scenes with small cloud fractions,
and (2) over cloud-free scenes a surface albedo correction         The objective of the Sentinel-5 Precursor (S5P)-VAL-DE-
leads to larger tropospheric NO2 VCDs. On average, ground-         Ruhr campaign, an activity within the ESA QA4EO project,
based validation shows an improvement of the negative bias         was to perform comprehensive field studies optimized for
of the tropospheric NO2 VCDs from −32 % to −23 % (van              TROPOMI tropospheric NO2 VCD validation including air-
Geffen et al., 2022b).                                             borne, ground-based stationary and mobile car DOAS mea-
   Different aspects that influence the tropospheric NO2           surements.
VCD determination and possible reasons for the underesti-             The campaign activities took place in September 2020 in
mation of the TROPOMI tropospheric NO2 VCD data, com-              North Rhine-Westphalia, including the Ruhr area, a densely
pared to the validation data, are discussed in several studies     populated and strongly polluted urban agglomeration in the
(e.g., Judd et al., 2020; Tack et al., 2021; Verhoelst et al.,     west of Germany. The Ruhr area itself has a population of
2021; van Geffen et al., 2022b; Douros et al., 2023). The lim-     5 million. Together with the populated surroundings and
ited knowledge of the NO2 profiles and differences in the av-      metropolitan centers along the Rhine, the region is called
eraging kernels between instruments having different view-         Metropolitan area Rhine-Ruhr (MRR). It comprises a pop-
ing geometries are identified as significant potential sources     ulation of more than 10 million inhabitants, large power
of disagreement between satellite and validation data. Simi-       plants, energy-intensive industrial facilities and several large
larly, inaccuracies in the knowledge of the aerosol load and       highways. NO2 pollution in the MRR is clearly visible in
aerosol vertical profile lead to both underestimations and         TROPOMI maps of Europe showing widespread enhanced
overestimations of the tropospheric NO2 VCD depending on           NO2 amounts. Figure 1 shows the monthly average for
the viewing geometry. In addition, knowledge about the sur-        September 2020 of the tropospheric NO2 VCD using the
face reflectivity and cloud conditions and their treatment in      TROPOMI PAL V02.03.01 product for central Europe (left)
satellite retrieval algorithms needs to be taken into account.     and a close-up of the S5P-VAL-DE-Ruhr campaign region
   In the present study, results from a comprehensive field        (right).
study conducted in North Rhine-Westphalia in September                A key contribution to the campaign is the airborne
2020 are presented. The campaign area is located in the west       AirMAP instrument explained below in Sect. 3.2. AirMAP
of Germany and includes the highly polluted Ruhr Area,             was installed on a Cessna T207A aircraft that was based
a metropolitan region with large cities, industrial facilities,    at an airport close to Dinslaken, North Rhine-Westphalia.
power plants, and arterial highways. Background areas with         Within the designated campaign area, three research flight
low pollution, as well as moderately polluted regions, are         areas were defined (see Fig. 1), in which AirMAP performed
also observed, which increases the dynamic range of ob-            a total of seven flights on 7 consecutive days. The aircraft ob-

https://doi.org/10.5194/amt-16-1357-2023                                             Atmos. Meas. Tech., 16, 1357–1389, 2023
1360                                      K. Lange et al.: Validation of Sentinel-5P TROPOMI tropospheric NO2 products

Figure 1. S5P TROPOMI tropospheric NO2 VCD taken from the PAL V02.03.01 product for the month of September 2020 in central
Europe (a) and a close-up map of the campaign target area in North Rhine-Westphalia (b). The three research flight target areas and the
ground-based measurement sites are shown.

servations covered a large number of neighboring TROPOMI
ground pixels reasonably close in time to the TROPOMI ob-
servations.
   Figure 2 shows a map of the region in which flights were
made during the campaign, including examples of the flight
patterns flown in the three research flight areas within the
region: around Jülich in the southwest (blue track), around
Cologne in the southeast (red track) and around Duisburg in
the north (green track). The research flight area around Jülich
is expected to be dominated by the emissions of three large
lignite-fired power plants located in the area (see European
Pollutant Release and Transfer Register, https://industry.eea.
europa.eu/, last access: 18 November 2022). The research
flight area around Cologne is a mixed urban and industrial
area. The flight area around Duisburg has a similar character
to that of the Cologne area but includes the central metropoli-
tan Ruhr area, which has a large variety of pollution sources.
The individual research flight area on each of the campaign           Figure 2. Overview of the flight area of the Ruhr campaign, in-
days was selected after assessment of the weather and at-             cluding exemplary flight patterns in the three target areas and loca-
mospheric conditions, in particular wind direction and the            tions of the stationary instruments in Jülich (blue), Cologne (red),
objective of measuring all of the three research flight areas         Dinslaken airport (purple), Gelsenkirchen (cyan), and Duisburg
on a clear-sky day. For the flight days, the weather condi-           (green).
tions were favorable, having mostly cloud-free scenes over
the particular target area.
   The selected flight area is covered with straight flight           the target area. The transfer flights between airport and target
tracks in a lawnmower style. Neighboring flight legs are              areas were used to overpass nearby stationary instruments.
flown in opposite directions and have an overlap of approx-           Flight schedules used the S5P overpass times to optimize the
imately 30 % at the edges of the airborne instrument swath.           amount of data for validation. In general, it was planned to
For each flight, 13 to 15 flight tracks, each having a width and      have the S5P overpass in the middle of the flight. On days
length of approximately 3 and 35 km, were performed above             where two overpasses per day occurred in the target area, the
                                                                      flight schedules were optimized towards the overpass time at

Atmos. Meas. Tech., 16, 1357–1389, 2023                                                 https://doi.org/10.5194/amt-16-1357-2023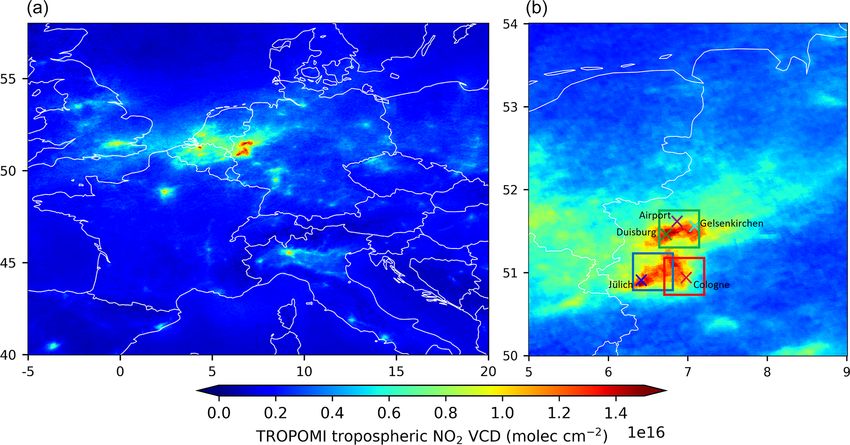
K. Lange et al.: Validation of Sentinel-5P TROPOMI tropospheric NO2 products                                                          1361

Table 1. List of the aircraft activities, including S5P overpass information. All times are in UTC. On days with two S5P overpasses over the
area, flights were arranged to coincide with the overpass at smaller VZA of TROPOMI.

                  Date                   Flight time     Flight      S5P overpass (UTC)               Comments
                                         (UTC)           area        with VZA
                  12 September 2020      10:17–13:37     Cologne     10:51 (67.4◦ ), 12:31 (15.9◦ )
                  13 September 2020      10:20–13:36     Jülich      12:12 (8.8◦ )
                  14 September 2020      10:14–13:47     Duisburg    11:53 (30.7◦ ), 13:35 (64.9◦ )   No TROPOMI data
                  15 September 2020      09:15–12:44     Duisburg    11:35 (46.7◦ ), 13:15 (55.4◦ )
                  16 September 2020      10:37–14:05     Duisburg    11:16 (57.7◦ ), 12:56 (41.9◦ )   Only one car DOAS
                  17 September 2020      10:45–14:16     Jülich      10:57 (65.5◦ ), 12:37 (22.6◦ )
                  18 September 2020      10:48–14:08     Cologne     12:18 (1.6◦ )

the smaller viewing zenith angle (VZA) of TROPOMI. More                 spectral spectrometer measuring radiation in the ultravio-
details of the flights are given in Table 1.                            let, visible, and near and shortwave infrared spectral regions
   The campaign delivered validation measurements by a                  (Veefkind et al., 2012). TROPOMI provides observations be-
mobile and a stationary component. In addition to the mea-              tween 10:50 and 13:45 UTC over the campaign region, mea-
surements made by AirMAP, the mobile component included                 suring the distribution of atmospheric columns from trace
three car DOAS devices. The stationary component com-                   gases such as NO2 , HCHO, CHOCHO, BrO, SO2 , O3 , CO,
prised six ground-based remote sensing instruments of three             CH4 , and aerosol and cloud properties. Thereby, TROPOMI
different types, i.e., two Pandora instruments, two MAX-                extends a long record of satellite-based observations. With its
DOAS instruments, and two fixed Zenith-DOAS devices. All                good signal-to-noise ratio and a spatial resolution at nadir of
the instruments were placed at suitable locations within the            3.5 km × 5.5 km (initially 3.5 km × 7 km, changed on 6 Au-
selected research flight areas shown in Fig. 2. With this com-          gust 2019), which is more than 10 times better than that of its
bination of measurements, a comprehensive comparison of                 predecessor, the Ozone Monitoring Instrument (OMI; Levelt
the airborne measurements with different types of ground-               et al., 2006), it is currently the best instrument for monitoring
based instruments is made possible. This provides a basis               small-scale emission sources of NOx from space.
for the evaluation of the TROPOMI tropospheric NO2 VCD
products with the airborne data, which cover the satellite              3.1.1    TROPOMI NO2 operational OFFL V01.03.02
pixel areas well. The airborne imaging data link the ground-                     product
based observations with restricted spatial but good tempo-
ral coverage to satellite observations that have large swath            During the campaign activities in September 2020, the
widths at a single instance in time.                                    TROPOMI level-2 NO2 OFFL V01.03.02 product was gen-
                                                                        erated operationally. For the retrieval of NO2 slant column
                                                                        densities (SCDs) the measured spectra are analyzed using
3     Instruments and data sets
                                                                        the DOAS technique in the fitting window 405–465 nm.
During the S5P-VAL-DE-Ruhr campaign, tropospheric                       The SCDs are separated into their stratospheric and tropo-
VCDs of NO2 were retrieved from instruments mounted                     spheric parts, using the TM5-MP global chemistry trans-
on satellite, airborne, car, and stationary ground-based plat-          port model. The tropospheric SCDs are converted into tro-
forms. All of these instruments are passive remote sensing              pospheric VCDs by applying tropospheric air mass fac-
spectrometers using the DOAS technique (Platt and Stutz,                tors (AMFs), estimated using a look-up table of altitude-
2008) by analyzing visible and UV spectra of scattered sun-             dependent AMFs, the OMI Lambertian equivalent reflectiv-
light. The instruments involved in the S5P-VAL-DE-Ruhr                  ity (LER) climatology (Kleipool et al., 2008), NO2 vertical
campaign activities are listed in Table 2. The data analysis            profiles from the TM5 model, and cloud fraction and pres-
was done independently by the operating institutes, and the             sure information from the FRESCO-S algorithm (van Geffen
DOAS fitting window was chosen based on the spectrome-                  et al., 2022a).
ter’s spectral wavelength range and from the groups experi-                Validation by comparison with other observations has
ence with their instrument.                                             shown that NO2 data versions V01.02–01.03 are biased low
                                                                        by up to 50 % over highly polluted regions (e.g., Verhoelst
3.1    S5P TROPOMI                                                      et al., 2021). As discussed in several validation studies (see,
                                                                        e.g., Judd et al., 2020; Verhoelst et al., 2021; van Geffen
The Copernicus satellite S5P was launched into a Sun-                   et al., 2022b), this underestimation could be related to biases
synchronous orbit at 824 km in October 2017. S5P carries                in the cloud pressure retrieval, to a too high cloud pressure
a single instrument, TROPOMI, which comprises a hyper-                  from the FRESCO-S algorithm, in particular when the cloud

https://doi.org/10.5194/amt-16-1357-2023                                                    Atmos. Meas. Tech., 16, 1357–1389, 2023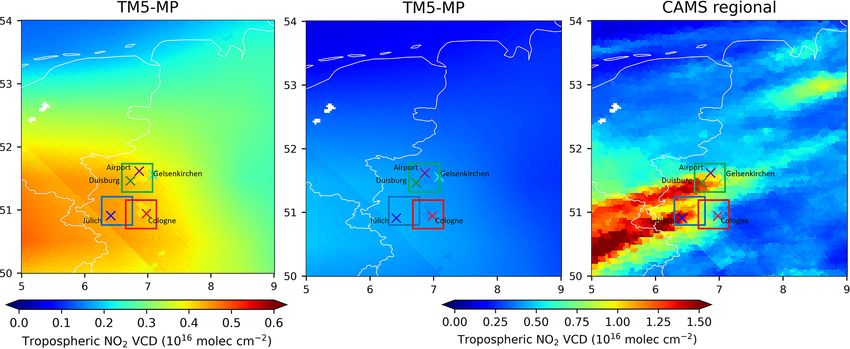
1362                                          K. Lange et al.: Validation of Sentinel-5P TROPOMI tropospheric NO2 products

Table 2. List of instruments included in S5P-VAL-DE-Ruhr campaign activities with location and observation geometry. Car DOAS instru-
ments are operated by three different institutes: the Institute of Environmental Physics, University of Bremen (IUP); the Max Planck Institute
for Chemistry in Mainz (MPIC); and the Royal Belgian Institute for Space Aeronomy (BIRA).

  Instrument              Location/platform                        Observation            Spectral     Fitting   VCD retrieval and
                                                                   geometry                 range     window     AMF information
                                                                                             (nm)        (nm)    (columns in molec. cm−2 )
  TROPOMI                 Sentinel-5P                              Push-broom, nadir     310–500     405–465     van Geffen et al. (2022a)
  AirMAP                  FU-Berlin Cessna T207A aircraft          Push-broom, nadir     429–492     429–492     VCDtrop, ref = 1 × 10¹⁵
                                                                                                                 radiative transfer model
                                                                                                                 SCIATRAN
  IUP car DOAS            Mobile car                               Zenith-sky            290–550     425–490     VCDtrop, ref = 1 × 10¹⁵
                                                                                                                 AMF (90◦ ) = 1.3
  MPIC car DOAS           Mobile car                               Zenith-sky and 22◦    300–460     400–460     Using dSCD (22◦ ),
                                                                                                                 Wagner et al. (2010)
                                                                                                                 AMF (90◦ ) = 1.3
                                                                                                                 AMF (22◦ ) = 3
  BIRA car DOAS           Mobile car                               Zenith-sky and 30◦    200–750     450–515     dSCD (30◦ ) with
                                                                                                                 sequential 90◦ reference
                                                                                                                 AMF (90◦ ) = 1.3
                                                                                                                 AMF (30◦ ) = 2.5
  Zenith-DOAS JUE         Jülich (50.91◦ N, 6.41◦ E)               Zenith-sky            290–550     425–490     SCDref = 1 × 10¹⁶
                                                                                                                 AMF (90◦ ) = 1.3
  Zenith-DOAS GEL         Gelsenkirchen (51.56◦ N, 7.09◦ E)        Zenith-sky            290–550     425–490     SCDref = 1.7 × 10¹⁶
                                                                                                                 AMF (90◦ ) = 1.3
  MAX-DOAS DUI            Duisburg (51.46◦ N, 6.73◦ E)             Multi-axis            282–414     338–370     dSCD (30◦ ) with
                                                                                                                 sequential 90◦ reference
                                                                                                                 AMF (90◦ ) = 1.3
                                                                                                                 AMF (30◦ ) = 2.5
  MAX-DOAS AIRPT          Airport Dinslaken (51.62◦ N, 6.87◦ E)    Multi-axis            300–463     411–445     MMF inversion algorithm
                                                                                                                 Friedrich et al. (2019)
  Pandora COL             Cologne (50.94◦ N, 6.98◦ E)              Multi-axis            270–520     435–490     Cede et al. (2022)
  Pandora JUE             Jülich (50.91◦ N, 6.41◦ E)               Multi-axis            281–523     435–490     Cede et al. (2022)

fractions are low and/or during periods of high aerosol load-            trieval in the NO2 fit window and to the NIR-FRESCO cloud
ing. Other stated factors that could contribute to the underes-          retrieval (Eskes and Eichmann, 2022). Since V02.04 is not
timation are (1) the low spatial resolution of the used a priori         yet reprocessed and thus not available for the campaign pe-
NO2 profiles from the TM5 global chemistry transport model               riod, it is not included and discussed in this study.
(e.g., Judd et al., 2020; Tack et al., 2021), (2) the use of the
OMI LER climatology given on a grid of 0.5◦ × 0.5◦ for the               3.1.2    Scientific TROPOMI NO2 V01.03.02 CAMS
AMF and cloud fraction retrieval in the NO2 fit window, and                       product
(3) the GOME-2 LER climatology (0.25◦ × 0.25◦ ) measured
at mid-morning used for the NIR-FRESCO cloud retrieval                   The scientific TROPOMI NO2 V01.03.02 CAMS product is
(van Geffen et al., 2022b). These LER climatologies are not              based on the operational OFFL V01.03.02 product. The orig-
optimal for TROPOMI because of TROPOMI’s higher spa-                     inal 1◦ × 1◦ TM5 a priori NO2 profiles are replaced by the
tial resolution and the missing consideration of the viewing             Copernicus Atmospheric Monitoring Service (CAMS) anal-
angle dependency in the LER products (Lorente et al., 2018;              yses. AMFs and tropospheric NO2 VCDs were recalculated
van Geffen et al., 2022b). In V02.04, operational since July             using the averaging kernels and other quantities available in
2022, a directionally dependent LER (DLER) climatology                   the level-2 NO2 files, following the approach described in
derived from TROPOMI observations given on a resolution                  the TROPOMI product user manual (Eskes et al., 2022). Be-
of 0.125◦ × 0.125◦ is applied for AMF and cloud fraction re-             tween the surface and 3 km the CAMS European regional

Atmos. Meas. Tech., 16, 1357–1389, 2023                                                     https://doi.org/10.5194/amt-16-1357-2023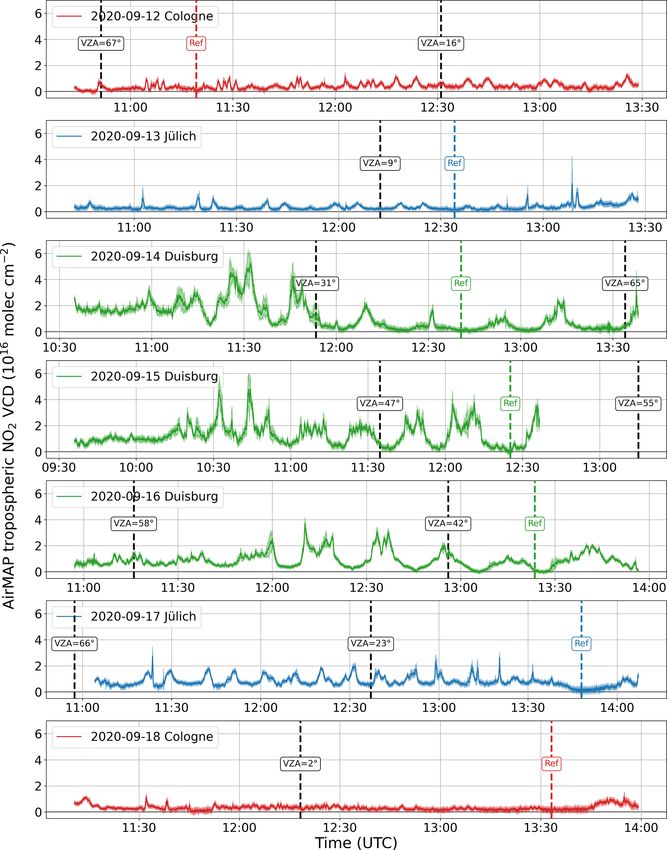
K. Lange et al.: Validation of Sentinel-5P TROPOMI tropospheric NO2 products                                                1363

analyses with an improved resolution of 0.1◦ × 0.1◦ are used.     tropospheric NO2 VCDs from on average −32 % to −23 %
For altitudes between 3 km and the tropopause the CAMS            (van Geffen et al., 2022b).
global analyses (0.4◦ × 0.4◦ ) are used. More detailed expla-
nations can be found in Douros et al. (2023).                     3.1.4   Scientific TROPOMI NO2 IUP V02.03.01 product

3.1.3   TROPOMI NO2 PAL V02.03.01 product                         For the evaluation of the influence of auxiliary data on the
                                                                  TROPOMI NO2 product, we developed a customized scien-
Modifications in the TROPOMI NO2 retrieval led to the             tific product rebuilding the V02.03.01 data product, named
OFFL V02.02 product, which was operationally produced             IUP V02.03.01. The IUP V02.03.01 gives the possibility to
from 1 July to 14 November 2021. To obtain a harmo-               change the a priori assumptions such as surface reflectance,
nized data set, a complete mission reprocessing was per-          which cannot be done using the averaging kernel approach
formed using the latest operational product OFFL V02.03.01        used for V01.03.02 CAMS.
of 14 November 2021. The reprocessed data version avail-              The a priori NO2 vertical profile shapes for the operational
able from 1 May 2018 to 14 November 2021 provided by              TROPOMI NO2 retrieval are taken from the TM5 model and
the Product Algorithm Laboratory (PAL) is labeled as PAL          have a resolution of 1◦ × 1◦ (∼ 100 km × 100 km), which is
V02.03.01. This provided the opportunity to compare the           much coarser than the TROPOMI data (3.5 km × 5.5 km at
campaign data set to the OFFL V01.03.02 and the new               nadir). In highly polluted regions, such as the campaign area,
PAL V02.03.01. The main change compared to the OFFL               high spatial variability of NO2 VCDs are observed. The NO2
V01.03.02 impacting the tropospheric NO2 VCD data is the          plumes from sources, such as power plants, industrial com-
use of the FRESCO-wide algorithm instead of the FRESCO-           plexes, or cities, cannot be resolved in the model. To demon-
S algorithm, which was already introduced in V01.04 and           strate the impact of more highly resolved a priori NO2 verti-
was operational from 29 November 2020 to 1 July 2021.             cal profiles, we recalculated AMFs and the tropospheric NO2
The FRESCO-wide algorithm provides lower and therefore            VCDs with a lookup-table created with the radiative transfer
more realistic cloud pressures (i.e., clouds are at higher al-    model SCIATRAN (Rozanov et al., 2014) using a priori tro-
titudes), especially for scenes when cloud fractions are low.     pospheric profiles from the 0.1◦ × 0.1◦ CAMS regional anal-
This change results in decreased tropospheric AMFs, which         yses for altitudes between the surface and 3 km. For altitudes
leads to higher tropospheric NO2 VCDs (van Geffen et al.,         between 3 km and the tropopause, where horizontal variabil-
2022b). Another update that can have a significant impact is      ity is in general small, the TM5 model analyses are used. Two
the correction of the surface albedo over cloud-free scenes       maps showing the NO2 distribution of the CAMS regional
by using the observed reflectance. This increases the tropo-      and the TM5 analyses for the campaign region can be found
spheric NO2 VCDs by about 15 % over polluted regions in           in Appendix A (Fig. A1). In the following, this data version
case the retrieved cloud fraction is zero (van Geffen et al.,     using the CAMS regional analyses is called IUP V02.03.01
2022b). For this study the effect is negligible since only 1      REG.
out of the 117 TROPOMI pixels analyzed here is observed               The surface reflectivity information from the 5-year OMI
as cloud free. van Geffen et al. (2022b) also describes the       LER climatology used for the operational TROPOMI AMF
following other modifications, which have only a small or no      calculations has a resolution of 0.5◦ × 0.5◦ . After more
impact on the tropospheric NO2 VCD data. Level-1b v2.0            than 3 years of TROPOMI data acquisition, a TROPOMI
(ir)radiance spectra are updated in the new version and are       surface reflectivity database, estimated from 36 months of
increasing the NO2 SCD of about 3 %, from which most of           TROPOMI v1.0.0 level-1b data, provides LER data as a
it ends up in a slightly increased stratospheric VCD. The im-     function of month, wavelength, latitude, and longitude and at
proved level-1b v2.0 also leads to a small increase in com-       a finer spatial resolution of 0.125◦ × 0.125◦ (Tilstra, 2022).
pletely cloud-free pixels and to slightly lower cloud pres-       The recalculation of AMFs and tropospheric NO2 VCDs us-
sures for pixels with a small cloud fraction, resulting in        ing the regional CAMS NO2 profiles and the TROPOMI
tropospheric NO2 VCDs being about 5 % higher for these            LER results in the product named IUP V02.03.01 REG
ground pixels. An introduced outlier removal is increasing        TROPOMI LER. The use of the TROPOMI LER in this data
the amount of good-quality retrievals over the South Atlantic     set is limited to the NO2 AMFs and not extended to the cloud
Anomaly and over bright clouds where saturation can occur.        retrieval.
The change to new spatially more highly resolved snow and             In addition to the traditional LER database, a DLER
ice information is increasing the amount of valid retrievals at   database has been generated using TROPOMI data. The
high latitudes. On average, the new data version increased the    DLER database is in addition a function of the TROPOMI
tropospheric NO2 VCDs by 10 % to 40 % compared to the             viewing direction and provides generally higher values than
V1.x data, depending on season and pollution. The largest         the LER database, which does not take into account the direc-
increase is found in wintertime at midlatitudes and high lati-    tional dependence of the surface reflectance (Tilstra, 2022).
tudes. The first comparisons to ground-based measurements         Recalculating AMFs and tropospheric NO2 VCDs with the
show an improvement of the negative bias of the TROPOMI           regional CAMS NO2 profiles and the TROPOMI DLER

https://doi.org/10.5194/amt-16-1357-2023                                            Atmos. Meas. Tech., 16, 1357–1389, 2023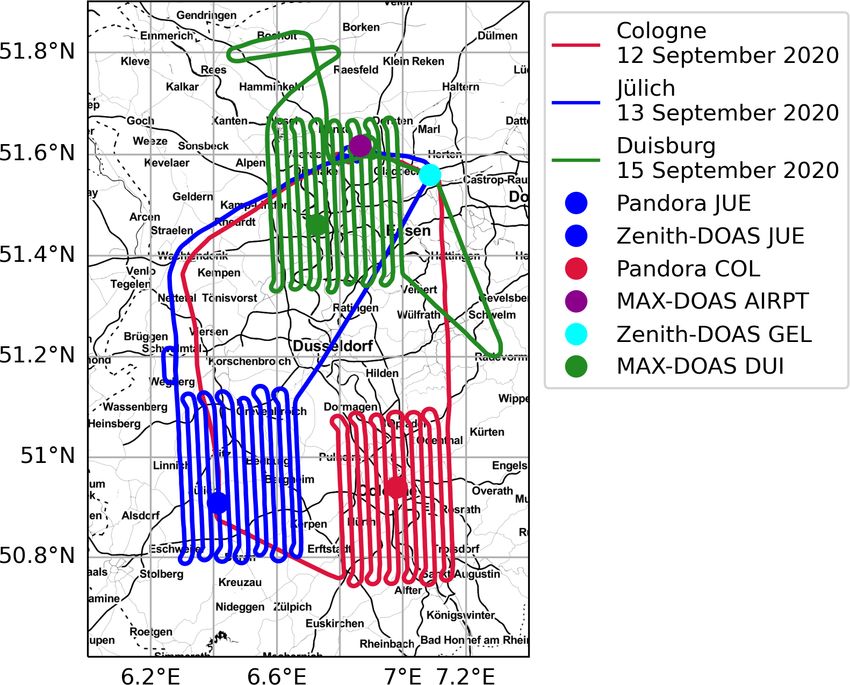
1364                                    K. Lange et al.: Validation of Sentinel-5P TROPOMI tropospheric NO2 products

yields the IUP V02.03.01 REG DLER product, which again           a flight altitude of 3300 m, this results in a typical ground
does not recalculate cloud parameters.                           scene having a footprint of around 100 m × 30 m. More de-
   The different TROPOMI NO2 products with their most            tails about AirMAP can be found in Schönhardt et al. (2015),
important differences are summarized in Table 3.                 Meier et al. (2017) and Tack et al. (2019).

3.1.5    TROPOMI data set                                        3.2.1   AirMAP data retrieval

In the present study, we evaluate the TROPOMI tropo-             For the NO2 retrieval, the DOAS method is applied to the
spheric NO2 VCD product from 12 to 18 September 2020 of          measured spectra in a fitting window of 438–490 nm. The
the two described data products OFFL V01.03.02 and PAL           NO2 differential SCDs (dSCDs) are retrieved relative to in-
V02.03.01, as well the described scientific data products.       flight-measured reference background spectra, which were
   Each TROPOMI pixel has a quality assurance value              measured over a region with small NO2 concentrations dur-
(qa_value) indicating the quality of the processing and re-      ing the same flight. The dSCD is converted into a tropo-
trieval result. Following the recommendation by Eskes and        spheric SCD (SCDtrop ) by correcting for the amount of NO2
Eichmann (2022), we only use observations with a qa_value        in the reference background measurement (SCDref ):
above 0.75 for all used TROPOMI data products. This re-
                                                                 SCDtrop = dSCD + SCDref
moves problematic retrievals and observations with cloud ra-
diance fractions of more than 50 %. Since the campaign mea-              = dSCD + VCDtrop, ref · AMFtrop, ref .             (1)
surement days were mostly cloud free, the cloud radiance
fraction retrieved in the TROPOMI NO2 spectral window            For the conversion to the desired tropospheric VCD
was on average 0.21 ± 0.10 with a maximum of 0.48, and           (VCDtrop ), the SCDtrop is divided by the tropospheric air
thus all data can be used.                                       mass factor (AMFtrop ):
   Large tropospheric NO2 VCDs are observed in central Eu-
                                                                            SCDtrop
rope, e.g., over Paris, London, Milan, and Antwerp, with the     VCDtrop =
largest values of 1.6 × 10¹⁶ molec. cm−2 in the campaign re-                AMFtrop
gion in North Rhine-Westphalia (see Fig. 1). The campaign                   dSCD + VCDtrop, ref · AMFtrop, ref
area is clearly distinguished from surrounding rural areas,               =                                    .            (2)
                                                                                     AMFtrop
which have low tropospheric NO2 VCDs below approxi-
mately 3 × 10¹⁵ molec. cm−2 .                                    Since the AMF of the actual measurement (AMFtrop ) and
                                                                 of the reference background measurement (AMFtrop, ref ) are
3.2     AirMAP                                                   usually not the same, simply adding the VCDtrop, ref would
                                                                 introduce additional uncertainties. To correct for the NO2 in
AirMAP, an airborne imaging spectrometer developed by the        the reference spectrum (SCDref ), we assume a tropospheric
Institute of Environmental Physics in Bremen (IUP-Bremen),       VCD of 1×10¹⁵ molec. cm−2 over the reference background
has been used in several campaigns for trace gas measure-        region, which is a typical value during summer in Europe
ments and pollution mapping (Schönhardt et al., 2015; Meier      (Popp et al., 2012; Huijnen et al., 2010). This assump-
et al., 2017; Tack et al., 2019; Merlaud et al., 2020). During   tion can be supported by the car DOAS measurements; see
the campaign, AirMAP was installed on a Cessna 207-Turbo,        Sect. 3.3.1. All measurements of the campaign were per-
operated by the Freie Universität Berlin. AirMAP is a push-      formed around noon close to the S5P overpass. The max-
broom imaging DOAS instrument with the ability to create         imum difference between the time of the reference back-
spatially continuous and nearly gap-free measurements. The       ground and the actual measurement is of around 3 h, which is
scattered sunlight from below the aircraft is collected with a   the total measurement time. We assume that the effect of the
wide-angle entrance optic resulting in an across track field     changing solar zenith angle (SZA) and the diurnal variation
of view of around 52◦ . This leads to a swath width of ap-       of the stratospheric NO2 concentration are small (Schreier
proximately 3 km, about the same size as the flight altitude,    et al., 2019), and a stratospheric correction of the data is
during the campaign. With a sorted fiber bundle of 35 fibers,    therefore not necessary.
vertically stacked at the spectrometer entrance slit and or-        The AMF calculated using SCIATRAN estimates the rela-
thogonally oriented to the flight direction, the radiation is    tive light path length through the absorbing layer by account-
coupled into the UV-Vis imaging grating spectrometer. The        ing for the effects of sun and viewing geometry, surface re-
400 g mm−1 grating, blazed at 400 nm, provides measure-          flectance, aerosols, and the NO2 profile assuming cloud-free
ments in the 429–492 nm wavelength range, with a spectral        conditions. As only limited information about the NO2 pro-
resolution between 0.9 and 1.6 nm full width at half maxi-       file is available in the campaign area and the profile shape
mum. The spectrometer is temperature stabilized at 35 ◦ C.       is expected to vary strongly within each flight region every
The along-track resolution depends on the speed of the air-      day, we assume a typical urban NO2 profile, which is based
craft (around 60 m s−1 ) and the exposure time (0.5 s). At       on an old WRF-Chem (Weather Research and Forecasting

Atmos. Meas. Tech., 16, 1357–1389, 2023                                           https://doi.org/10.5194/amt-16-1357-2023
K. Lange et al.: Validation of Sentinel-5P TROPOMI tropospheric NO2 products 1365
Table 3. TROPOMI NO2 product versions with the most important differences between the analyzed products.
TROPOMI NO2 NO2 vertical profile Reflectivity Clouds Comments, availability
product versions
OFFL V01.03.02 TM5 OMI LER FRESCO-S operational 26 June 2019–29 November 2020
OFFL V01.03.02 CAMS regional < 3 km OMI LER FRESCO-S scientific, based on OFFL V01.03.02
CAMS CAMS global > 3 km
PAL V02.03.01 TM5 OMI LER FRESCO-W operational 4 November 2021–17 July 2022
as OFFL V02.03.01,
reprocessed 1 May 2018–14 November 2021
as PAL V02.03.01
IUP V02.03.01 TM5 OMI LER FRESCO-W scientific, similar to PAL V02.03.01,
a priori assumptions can be changed,
campaign period
IUP V02.03.01 REG CAMS regional < 3 km OMI LER FRESCO-W scientific, campaign period
TM5 > 3 km
IUP V02.03.01 REG CAMS regional < 3 km TROPOMI LER FRESCO-W scientific, campaign period
TROPOMI LER TM5 > 3 km
IUP V02.03.01 REG CAMS regional < 3 km TROPOMI DLER FRESCO-W scientific, campaign period
TROPOMI DLER TM5 > 3 km
model coupled with Chemistry) run and scaled to a height Bright surfaces enhance the relative contribution of light
of 1 km (see Fig. A2). This assumption is supported by typi- reflected from the surface to the signal received by the air-
cal boundary layer heights in the measurement area and time borne instrument, increasing the sensitivity to NO2 near the
of approximately 1 km (ERA5 reanalysis; Hersbach et al., ground. Therefore, areas of high surface reflectance in the
2018). Input parameters related to aerosols (single-scattering fitting window generally show larger dSCDs for the same
albedo, asymmetry factor, and aerosol optical thickness) amount of NO2 . Thus, differences in the surface reflectivity
were extracted from the AERONET station FZJ-JOYCE at must be accounted for in the AMF calculations. As far as we
the Jülich research center (Löhnert et al., 2015), which is the are aware, reflectance data that have a sufficient spatial reso-
only known source providing local ground-based aerosol in- lution are not available for the region of our flight campaign.
formation in the campaign area. During the campaign mea- Therefore, we use the individual AirMAP-recorded intensi-
surement days, the daily averages of aerosol optical thickness ties together with a method based on a reference area with a
(AOT) at 440 nm measured at FZJ-JOYCE ranged between known surface reflectance taken from the ADAM database (a
0.235 and 0.398 with a mean value of 0.285. This informa- surface reflectance database for ESA’s Earth observation mis-
tion is spatially constrained, and the situation can differ dur- sion; Prunet et al., 2013) and a look-up table of AirMAP ra-
ing the flights in the Duisburg and Cologne area. A sensitiv- diances. Detailed information about the derivation of the sur-
ity study using AMFs for a range of AOTs between 0.003 face reflectance and also about the general conversion from
and 0.6 for the AirMAP NO2 VCD retrieval demonstrated dSCDs to tropospheric NO2 VCDs can be found in Meier
that the influence on the AirMAP tropospheric NO2 VCD et al. (2017).
data set is small (< 1 %, comparing AirMAP tropospheric The total uncertainty on the tropospheric NO2 VCD com-
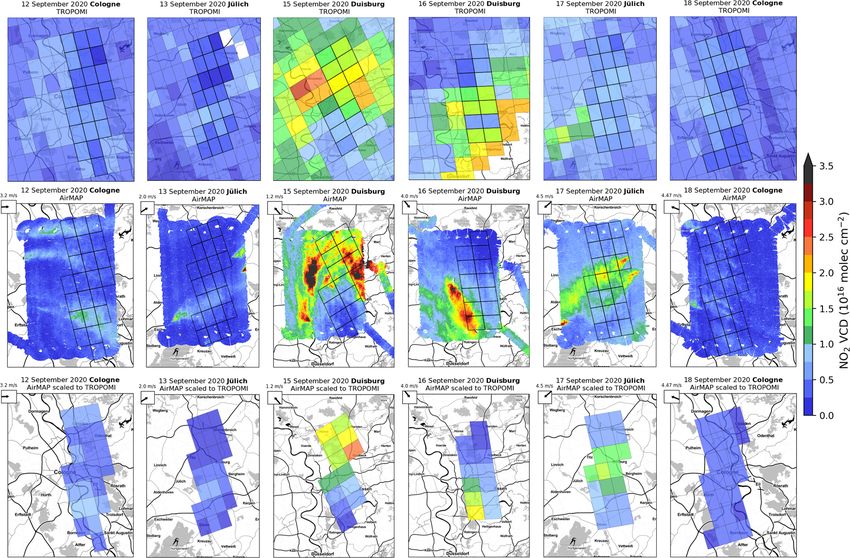
NO2 VCDs assuming AOTs of 0.003 and 0.6). TROPOMI prises error sources of the dSCD retrieval, the estimation of
and AirMAP tropospheric NO2 VCD scatter plots for AOTs the NO2 in the reference background spectrum, and the AMF
of 0.003, 0.3, and 0.6 can be found in Appendix A (Fig. A3). calculation. We follow the same approach for error estima-
Considering the mean AOT of 0.285 from the AERONET tion and thus the same assumptions as were made in Meier
station and the results from the sensitivity study, the AirMAP et al. (2017) and Tack et al. (2019).
data set was retrieved using an AOT of 0.3 for all measure- The total uncertainty of the AirMAP tropospheric NO2
ment days. In following discussions we also consider the VCD follows the error propagation of the three error sources
pre-operational TROPOMI AOT product (de Graaf, 2022),
which can provide a larger picture of the aerosol situation
(see Fig. A4). In general it shows AOT values in the same
range as investigated within the sensitivity study.
https://doi.org/10.5194/amt-16-1357-2023 Atmos. Meas. Tech., 16, 1357–1389, 2023
1366 K. Lange et al.: Validation of Sentinel-5P TROPOMI tropospheric NO2 products
given by plumes, which have enhanced tropospheric NO2 VCDs com-
pared to low background VCDs outside of the plume, are
σVCDtrop =
v blown in the mean wind direction (shown in the top left cor-
u
u σ 2
σSCDtrop, ref 2 SCDtrop
!2 ner of the maps) determined from ERA5 10 m wind data
dSCD
t + · σAMFtrop . (3) (Hersbach et al., 2018) for the flight area and in the middle
AMFtrop AMFtrop AMF2trop of the flight time. Differences between the 2 measurement
The error from the dSCD retrieval is estimated from the fit days over the Jülich flight area are related to wind condi-
residual and is a direct output of the DOAS retrieval algo- tions potentially enhanced by a weekend effect. On Sunday
rithm. Since no direct measurements of the NO2 column in 13 September, there was a weak wind coming from the south-
the reference ground scene exist, we assume a systematic er- west blowing the plumes to the northeast, and thus two out of
ror with an uncertainty of 100 % on the estimated value of three plumes were mostly outside the flight area and cleaner
1 × 10¹⁵ molec. cm−2 . The error resulting from the AMF de- air from a rural area was prevalent. On Thursday 17 Septem-
termination depends in large part on the values of the uncer- ber, a stronger wind coming from the opposite direction, the
tainty attributed to the surface reflectance, the accuracy of the northeast, was blowing the plumes to the southwest.
NO2 vertical profile, and the aerosol optical depth as a func- The three maps from flights over the Duisburg flight area
tion of altitude and location. Following Meier et al. (2017), show the strong NOx emissions from power plants and the
the total error on the AMF is estimated to be smaller than industrial area in Duisburg with plumes oriented depending
26 %. Taking the mean dSCD value (1.2×10¹⁶ molec. cm−2 ) on wind direction.
and the mean dSCD error (2 × 10¹⁵ molec. cm−2 ) as typi- The two AirMAP flights in the Cologne area show only
cal values, the total error of the tropospheric NO2 VCD is slightly enhanced NO2 amounts compared to the background
∼ 35 %. More details on error contributions can be found in tropospheric NO2 VCD on both days.
Meier et al. (2017).
3.3 Car DOAS instruments
3.2.2 AirMAP campaign data set
During the S5P-VAL-DE-Ruhr campaign, mobile car DOAS
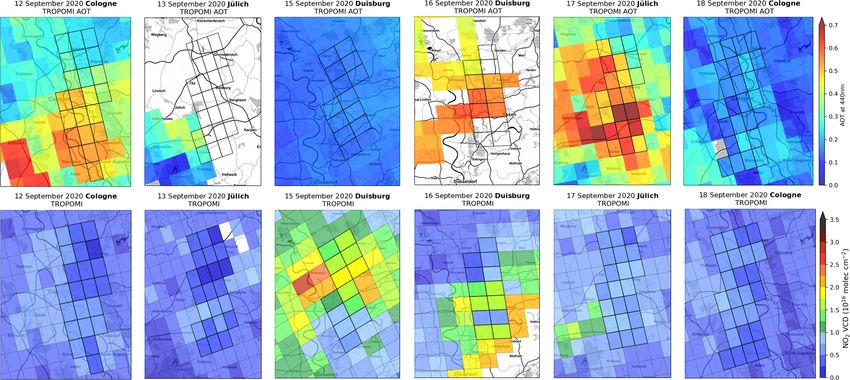
Figure 3 shows a time series of tropospheric NO2 VCDs measurements were performed by three institutions, the IUP-
measured by AirMAP for each of the 7 flight days of the Bremen, the Max Planck Institute for Chemistry in Mainz
campaign. The mean over the 35 viewing directions is shown (MPIC), and the Royal Belgian Institute for Space Aeron-
in dark colors, and their standard deviation is shown in light omy (BIRA). More information about the car DOAS instru-
colors. The colors red, blue, and green represent the respec- ments can be found in Schreier et al. (2019), Donner (2016),
tive research flight areas around Cologne, Jülich, and Duis- and Merlaud (2013). The measurement elevation angle was
burg. The S5P overpass times with respective VZA and the for the majority of measurements in zenith-sky with some
times of the AirMAP reference background measurement are off-zenith measurements. The off-zenith measurements are
marked by the vertical dashed lines. Two flights were per- used in the estimation of the NO2 SCD in the reference spec-
formed in the research flight area around Cologne (red), two trum and the stratospheric NO2 contribution for the BIRA
flights were performed in the Jülich area (blue), and three and MPIC car DOAS measurements. The focus on zenith-
flights were performed in the Duisburg area (green). The first sky measurements during driving has the advantage of a sta-
two flights shown in Fig. 3 are weekend days, a Saturday ble viewing direction when the direction of travel changes.
and a Sunday. The columns show strong variability between Variations from relative azimuth changes are avoided, and
the three target areas and from day to day with the highest measurements cannot be blocked by buildings, which can be
tropospheric NO2 VCDs being ∼ 5 × 10¹⁶ molec. cm−2 over a large problem in cities. In addition, the highest horizontal
the Duisburg area on Monday 14 September and Tuesday resolution is achieved with this viewing geometry.
15 September 2020 and much lower values for both flights in
the Cologne area, having tropospheric NO2 VCDs of up to 3.3.1 IUP car DOAS instrument and data retrieval
2.5×10¹⁶ molec. cm−2 . Maps of the tropospheric NO2 VCD
for each flight are displayed in Fig. 4. The IUP car DOAS instrument uses an experimental setup,
The tropospheric NO2 VCD over the Jülich flight area is which comprises an Avantes spectrometer and a light fiber
smaller during the flight on Sunday 13 September than on with a fixed viewing direction to the zenith measuring scat-
Thursday 17 September, where several peaks in the NO2 tered sunlight in the UV-Vis range (see also Schreier et al.,
VCD up to 2.5 × 10¹⁶ molec. cm−2 are visible. These peaks 2019). Collected spectra are averaged over 10 s, which corre-
are caused by plumes of NO2 coming from three large power sponds to traveled distances of around 80–300 m, depending
plants, located in the Jülich research flight area, which are on the driving speed. The DOAS method is applied to the
clearly visible in the maps of the AirMAP NO2 VCD in measured spectra in a fitting window of 425–490 nm. The
Fig. 4. Two power plants are located in the northeast of the tropospheric NO2 VCD from car DOAS zenith-sky measure-
Jülich flight area, while one is located in the southwest. The ments is determined in a similar manner to that used for the
Atmos. Meas. Tech., 16, 1357–1389, 2023 https://doi.org/10.5194/amt-16-1357-2023K. Lange et al.: Validation of Sentinel-5P TROPOMI tropospheric NO2 products 1367
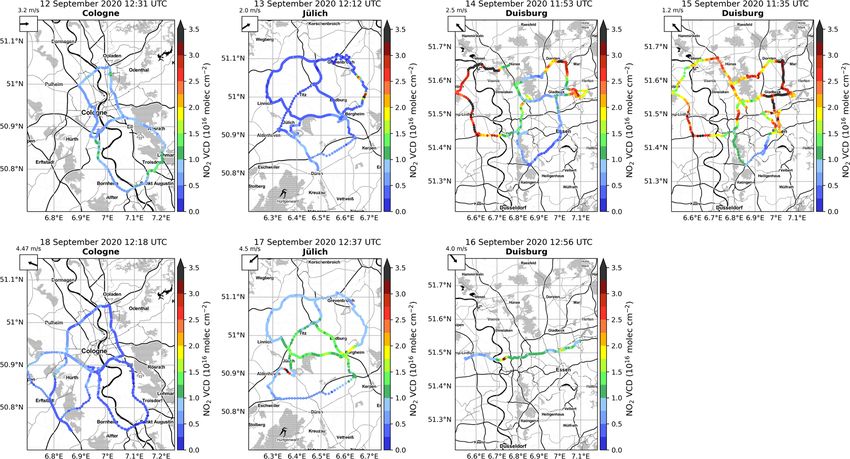
Figure 3. Plots of the AirMAP time series of tropospheric NO2 VCD (mean over the 35 viewing directions and standard deviation as a
dark line and bright area, respectively) for the 7 flight days from Saturday 12 September–Friday 18 September 2020. These show strong
variability from day to day (weekday vs. weekend) and between the three target areas (Cologne, Jülich, Duisburg). The dashed black vertical
lines indicate S5P overpass times with their viewing zenith angle. The dashed colored vertical lines indicate the times of the AirMAP
reference measurement.
AirMAP measurements by the following equation. be measured directly. Similar to the AirMAP VCD deter-
mination, the NO2 in the reference background spectrum
dSCD + SCDref − VCDstrat · AMFstrat is corrected for by assuming a tropospheric NO2 VCD of
VCDtrop = (4)
AMFtrop 1 × 10¹⁵ molec. cm−2 over the reference background region.
The other car DOAS instruments do not rely on this value
with: as they use dedicated measurements taken at lower ele-
vation angle to directly estimate the tropospheric column
SCDref = VCDtrop, ref · AMFtrop, ref + VCDstrat, ref · AMFstrat, ref
in the reference measurement. Thus, the assumption of a
VCDtrop, ref of 1 × 10¹⁵ molec. cm−2 can be supported by a
The dSCD are retrieved relative to reference background
comparison of co-located car DOAS measurements of the
spectra, measured in a region with small NO2 concentra-
three instruments, which shows a very good agreement (see
tions on 13 September around noon. The SCDref cannot
https://doi.org/10.5194/amt-16-1357-2023 Atmos. Meas. Tech., 16, 1357–1389, 20231368 K. Lange et al.: Validation of Sentinel-5P TROPOMI tropospheric NO2 products Figure 4. Maps of VCD NO2 from AirMAP flights from 12 to 18 September 2020. Two flights in the research flight area around Cologne (left column), two flights in the flight area around Jülich (second column), and three flights in the flight area around Duisburg (third and fourth column). The mean wind direction and speed in the flight area, determined from ERA5 10 m wind data for the middle of the flight, are given in the top left corner. Fig. A5). Using a larger VCDtrop, ref in the IUP car DOAS re- 3.3.2 MPIC car DOAS instrument and data retrieval trieval would increase the offset compared to the MPIC and BIRA car DOAS data. Since we used a fixed reference back- The MPIC car DOAS instrument uses an Avantes spectrom- ground measurement for all car DOAS measurement days, a eter with an active temperature stabilization and takes off- stratospheric correction based on the Bremen 3D chemistry axis measurements at 22◦ elevation in addition to the zenith- transport model (B3dCTM; Hilboll et al., 2013b), provid- sky measurements (see Donner, 2016). During the validation ing a daily diurnal cycle of the stratospheric NO2 VCDs and measurement period, only zenith-sky measurements were scaled to TROPOMI stratospheric VCDs in the measurement used to increase spatial and temporal coverage. The integra- area, is applied to the car DOAS data. Stratospheric AMFs tion time was 30 s. Before and after the validation measure- are calculated with the radiative transfer model SCIATRAN ments, the elevation angles alternate between 22◦ elevation (Rozanov et al., 2014) as a function of the SZA. For the con- and zenith-sky (90◦ ). The combination of both angles allows version of tropospheric SCDs to tropospheric NO2 VCDs, a the determination of the absorption in the reference spec- constant tropospheric AMF of 1.3 was used. The AMF of 1.3 trum SCDref , as well as the absorption in the stratosphere. for an elevation angle of 90◦ is closer to the true AMF (de- The DOAS analysis is performed in a wavelength interval of rived from radiative transfer simulations) than the geomet- 400–460 nm using a daily fixed reference background at 90◦ ric approximation for the tropospheric AMF of 1 (Shaiganfar elevation and at low SZA in a region with small NO2 con- et al., 2011; Merlaud, 2013; Schreier et al., 2019). Merlaud centrations. NO2 dSCDs retrieved from the DOAS analysis (2013) analyzed the AMF distribution for a large number of are converted to tropospheric NO2 VCDs by using Eq. (4) simulations, resulting in a mean of 1.33 ± 0.2 for measure- (see also Wagner et al., 2010; Ibrahim et al., 2010). Radiative ments in 90◦ viewing zenith angle. Since we only analyze transfer model calculations for NO2 box profiles of 500 or data close to the AirMAP overpass, which was performing 1000 m and moderate aerosol loads provide on average tro- measurements around noon, the SZA does not vary much. pospheric AMFs of 3 and 1.3 with an assumed uncertainty Following the mentioned studies, we assume an uncertainty of 20 % for the 22 and 90◦ elevation angle measurements, of 20 % for the AMF. respectively (Shaiganfar et al., 2011; Merlaud, 2013). Atmos. Meas. Tech., 16, 1357–1389, 2023 https://doi.org/10.5194/amt-16-1357-2023
K. Lange et al.: Validation of Sentinel-5P TROPOMI tropospheric NO2 products                                             1369

3.3.3   BIRA car DOAS instrument and data retrieval               3.4     Ground-based instruments

The BIRA car DOAS instrument consists of two Avantes              During the campaign period, six ground-based instruments,
spectrometers measuring simultaneously scattered light in         two Zenith-DOAS, two MAX-DOAS, and two Pandora in-
90 and 30◦ elevation (see also Merlaud, 2013). Individual         struments were measuring in the three target areas. The in-
spectra are co-added, and the DOAS analysis is performed          strument locations are marked on the map of the TROPOMI
in a wavelength interval of 450–515 nm on spectra averaged        tropospheric NO2 VCDs in Fig. 1 and the flight overview
every 30 s using a single pair of time-coincident low SZA         map in Fig. 2.
zenith reference spectra for all measurement days. The mea-
surements on both channels being simultaneous, the retrieval      3.4.1    Zenith-DOAS
of tropospheric NO2 VCDs follows the MAX-DOAS princi-
ple (see Eq. 5), using the differences in dSCDs and AMFs          Two Zenith-DOAS instruments were deployed and operated
for two elevation angles. For the AMFs, a sun-position-           within the Ruhr area for several months. The instruments use
dependent look-up table (LUT) is used. This LUT was cal-          an experimental setup, which comprises an Avantes spec-
culated using DISORT and provides AMFs of 2.5 and 1.3             trometer (290–550 nm) and a light fiber with a fixed viewing
for the 30 and 90◦ elevation angle measurements, respec-          direction to the zenith measuring scattered sunlight in the
tively (Merlaud, 2013). An additional zenith-DOAS instru-         UV-Vis spectral range (similar as in Schreier et al., 2019).
ment was operated for SO2 measurements, results are not           One instrument is located at the Jülich research center next
shown in this study.                                              to the Pandora (Zenith-DOAS JUE) and the second at a lo-
                                                                  cal residence in Gelsenkirchen (Zenith-DOAS GEL), in the
3.3.4   Car DOAS campaign data set                                Duisburg research flight area. The tropospheric NO2 VCDs
                                                                  are estimated from the dSCDs resulting from the DOAS fit
For the verification of the car measurements, regular co-
                                                                  using Eq. (4). For the reference background spectra in the
locations of the cars were used at selected meeting points and
                                                                  DOAS fit, we use a fixed spectrum taken in summer on a
overlapping measurement routes. Figure A5 in Appendix A
                                                                  clean day around noon. The amount of NO2 in the reference
shows a scatter plot of the co-located car DOAS measure-
                                                                  background spectrum, SCDref , is determined from the long
ments, demonstrating a good agreement between the three
                                                                  time series using the lowest measured NO2 . For the mea-
instruments. In general, the car DOAS measurements were
                                                                  surements made by the Zenith-DOAS GEL, this is a SCDref
planned in a way that each car made measurements during
                                                                  of 1.7 × 10¹⁶ molec. cm−2 . For the Zenith-DOAS JUE, the
a round trip of a large part of the research flight area. The
                                                                  SCDref is determined as 1.0 × 10¹⁶ molec. cm−2 using the
routes were also chosen to pass by the ground-based mea-
                                                                  same approach. The SCDsref given here include the strato-
surement stations. The duration of the car measurements was
                                                                  spheric and tropospheric NO2 in the reference background
typically around 4 h per day. This enabled measurements to
                                                                  spectrum. Since the reference measurements were taken dur-
be made during the complete AirMAP flight and the S5P
                                                                  ing summer, a relatively large part is stratospheric NO2 .
overpass times to gather many closely co-located measure-
                                                                  An uncertainty of 30 % for the SCD in the reference spec-
ments. Several round trips, about three to four, were per-
                                                                  trum is assumed. The VCDstrat is estimated from twilight
formed, depending on traffic conditions. In addition to spatial
                                                                  Langley fits (e.g., Constantin et al., 2013) with an uncer-
variations of NO2 , temporal changes are also observed.
                                                                  tainty of 2 × 10¹⁴ molec. cm−2 , and the stratospheric AMFs
   Figure 5 shows maps of car DOAS tropospheric NO2
                                                                  are obtained from SCIATRAN calculations. For the tropo-
VCDs for the 7 d in the research flight areas around Cologne,
                                                                  spheric AMF we use the same value of 1.3 as for the car
Jülich, and Duisburg. Measurements are within ±1 h of the
                                                                  DOAS. Since we only analyze the measurements close to the
S5P overpass time given in the map title. As already seen in
                                                                  AirMAP overpass, i.e., around noon, the SZA does not vary
the AirMAP data, strong variability between the three target
                                                                  much and the influence on the AMF is small (see Sect. 3.3.1).
areas is observed. The highest amounts of NO2 are visible
around Duisburg with high spatial variability within the tar-
                                                                  3.4.2    MAX-DOAS measurement truck
get area. The lowest amounts of NO2 are found in the area
around Cologne, which confirms the findings of the AirMAP
                                                                  From 7 to 19 September 2020, the IUP Bremen measurement
measurements. The car DOAS measurements in the Jülich
                                                                  truck performed MAX-DOAS measurements in the harbor
area show enhanced NO2 values where the AirMAP mea-
                                                                  area of Duisburg close to the Rhine River (MAX-DOAS
surements also see the plumes of the two power plants lo-
                                                                  DUI). This MAX-DOAS instrument uses a UV spectrome-
cated in the northeast of the flight area.
                                                                  ter (282–412 nm) with a light fiber connected to a telescope
                                                                  on a pan-tilt head and was scanning in multiple elevation an-
                                                                  gles. The tropospheric NO2 VCDs are estimated from the
                                                                  dSCD measurements in 30◦ elevation angle with a sequential
                                                                  zenith-sky reference spectrum (interpolated from the zenith-

https://doi.org/10.5194/amt-16-1357-2023                                           Atmos. Meas. Tech., 16, 1357–1389, 2023
You can also read