Validation of methane and carbon monoxide from Sentinel-5 Precursor using TCCON and NDACC-IRWG stations
←
→
Page content transcription
If your browser does not render page correctly, please read the page content below
Atmos. Meas. Tech., 14, 6249–6304, 2021
https://doi.org/10.5194/amt-14-6249-2021
© Author(s) 2021. This work is distributed under
the Creative Commons Attribution 4.0 License.

Validation of methane and carbon monoxide from Sentinel-5
Precursor using TCCON and NDACC-IRWG stations
Mahesh Kumar Sha1 , Bavo Langerock1 , Jean-François L. Blavier2 , Thomas Blumenstock3 , Tobias Borsdorff4 ,
Matthias Buschmann5 , Angelika Dehn6 , Martine De Mazière1 , Nicholas M. Deutscher7 , Dietrich G. Feist8,9,10 ,
Omaira E. García11 , David W. T. Griffith7 , Michel Grutter12 , James W. Hannigan13 , Frank Hase3 , Pauli Heikkinen14 ,
Christian Hermans1 , Laura T. Iraci15 , Pascal Jeseck16 , Nicholas Jones7 , Rigel Kivi14 , Nicolas Kumps1 ,
Jochen Landgraf4 , Alba Lorente4 , Emmanuel Mahieu17 , Maria V. Makarova18 , Johan Mellqvist19 ,
Jean-Marc Metzger20 , Isamu Morino21 , Tomoo Nagahama22 , Justus Notholt5 , Hirofumi Ohyama21 , Ivan Ortega13 ,
Mathias Palm5 , Christof Petri5 , David F. Pollard23 , Markus Rettinger24 , John Robinson23 , Sébastien Roche25 ,
Coleen M. Roehl26 , Amelie N. Röhling3 , Constantina Rousogenous27 , Matthias Schneider3 , Kei Shiomi28 ,
Dan Smale23 , Wolfgang Stremme12 , Kimberly Strong25 , Ralf Sussmann24 , Yao Té16 , Osamu Uchino21 ,
Voltaire A. Velazco7 , Corinne Vigouroux1 , Mihalis Vrekoussis27,5 , Pucai Wang29,30 , Thorsten Warneke5 ,
Tyler Wizenberg25 , Debra Wunch25 , Shoma Yamanouchi25 , Yang Yang31,29,1 , and Minqiang Zhou1
1 Royal  Belgian Institute for Space Aeronomy (BIRA-IASB), Brussels, Belgium
2 Jet Propulsion Laboratory, California Institute of Technology, Pasadena, CA, USA
3 Karlsruhe Institute of Technology, IMK-ASF, Karlsruhe, Germany
4 SRON Netherlands Institute for Space Research, Utrecht, the Netherlands
5 Institute of Environmental Physics, University of Bremen, Bremen, Germany
6 European Space Agency, ESA/ESRIN, Frascati, Italy
7 Centre for Atmospheric Chemistry, School of Earth, Atmospheric and Life Sciences, University of Wollongong,

Wollongong, Australia
8 Ludwig-Maximilians-Universität München, Lehrstuhl für Physik der Atmosphäre, Munich, Germany
9 Deutsches Zentrum für Luft- und Raumfahrt, Institut für Physik der Atmosphäre, Oberpfaffenhofen, Germany
10 Max Planck Institute for Biogeochemistry, Jena, Germany
11 Izaña Atmospheric Research Centre (IARC), State Meteorological Agency of Spain (AEMET),

Santa Cruz de Tenerife, Spain
12 Centro de Ciencias de la Atmósfera, Universidad Nacional Autonoma de Mexico, UNAM, Mexico City, Mexico
13 National Center for Atmospheric Research, Boulder, CO, USA
14 Finnish Meteorological Institute, FMI, Sodankylä, Finland
15 NASA Ames Research Center, Moffett Field, CA, USA
16 LERMA-IPSL, Sorbonne Université, CNRS, Observatoire de Paris, PSL Université, Paris, France
17 Institut d’Astrophysique et de Géophysique, Université de Liège, Liège, Belgium
18 Department of Atmospheric Physics, Faculty of Physics, St. Petersburg State University, Saint Petersburg, Russia
19 Earth and Space Sciences, Chalmers University of Technology, Gothenburg, Sweden
20 UAR 3365 – OSU Réunion, Université de La Réunion, Saint-Denis, Réunion, France
21 National Institute for Environmental Studies (NIES), Tsukuba, Japan
22 Institute for Space-Earth Environmental Research (ISEE), Nagoya University, Nagoya, Japan
23 National Institute of Water and Atmospheric Research Ltd (NIWA), Lauder, New Zealand
24 Karlsruhe Institute of Technology, IMK-IFU, Garmisch-Partenkirchen, Germany
25 Department of Physics, University of Toronto, Toronto, Ontario, Canada
26 Division of Geological and Planetary Sciences, California Institute of Technology, Pasadena, CA, USA
27 Climate and Atmosphere Research Center (CARE-C), the Cyprus Institute, Nicosia, Cyprus
28 Earth Observation Research Center (EORC), Japan Aerospace Exploration Agency (JAXA), Tsukuba, Japan
29 LAGEO, the Institute of Atmospheric Physics, Chinese Academy of Sciences, Beijing, China

Published by Copernicus Publications on behalf of the European Geosciences Union.
6250                                                                           M. K. Sha et al.: S5P CH4 and CO validation

30 University  of Chinese Academy of Sciences, Beijing, China
31 Shanghai   Ecological Forecasting and Remote Sensing Center, Shanghai, China

Correspondence: Mahesh Kumar Sha (mahesh.sha@aeronomie.be)

Received: 9 February 2021 – Discussion started: 6 April 2021
Revised: 17 August 2021 – Accepted: 18 August 2021 – Published: 28 September 2021

Abstract. The Sentinel-5 Precursor (S5P) mission with              13:30 local solar time. The TROPOMI instrument is a
the TROPOspheric Monitoring Instrument (TROPOMI) on                nadir-viewing hyperspectral spectrometer measuring solar
board has been measuring solar radiation backscattered by          radiation reflected by the Earth’s atmosphere and its sur-
the Earth’s atmosphere and surface since its launch on 13 Oc-      face from the ultraviolet–visible (270–495 nm), near-infrared
tober 2017. In this paper, we present for the first time the S5P   (675–775 nm) and shortwave–infrared (2305–2385 nm) with
operational methane (CH4 ) and carbon monoxide (CO) prod-          daily global coverage for monitoring atmospheric trace gases
ucts’ validation results covering a period of about 3 years        and aerosol (Veefkind et al., 2012). Methane (CH4 ) and car-
using global Total Carbon Column Observing Network (TC-            bon monoxide (CO) are retrieved from shortwave–infrared
CON) and Infrared Working Group of the Network for the             (SWIR) and near-infrared (NIR) measurements.
Detection of Atmospheric Composition Change (NDACC-                   Methane is the second most important anthropogenic
IRWG) network data, accounting for a priori alignment and          greenhouse gas (GHG) after carbon dioxide (CO2 ). It has
smoothing uncertainties in the validation, and testing the sen-    a global warming potential that is about 28 times larger
sitivity of validation results towards the application of ad-      than CO2 over a 100-year time period. It is less abundant in
vanced co-location criteria. We found that the S5P standard        the atmosphere and has a significantly shorter lifetime than
and bias-corrected CH4 data over land surface for the rec-         CO2 (Stocker et al., 2013). Reduction in CH4 will affect the
ommended quality filtering fulfil the mission requirements.        Earth’s radiation budget on a short timescale. CH4 is also rel-
The systematic difference of the bias-corrected total column-      evant in atmospheric chemistry, where it reacts with hydroxyl
averaged dry air mole fraction of methane (XCH4 ) data with        radicals (OH), thereby reducing the oxidation capacity of the
respect to TCCON data is −0.26 ± 0.56 % in comparison to           atmosphere and producing ozone (Kirschke et al., 2013).
−0.68 ± 0.74 % for the standard XCH4 data, with a corre-              Carbon monoxide is a poisonous reactive gas considered
lation of 0.6 for most stations. The bias shows a seasonal         principally an anthropogenic atmospheric pollutant. Volatile
dependence. We found that the S5P CO data over all sur-            organic compounds (VOCs) are emitted to the atmosphere by
faces for the recommended quality filtering generally fulfil       incomplete combustion (e.g. vehicles, industry and biomass
the missions requirements, with a few exceptions, which are        burning) and have an important role in the production of CO.
mostly due to co-location mismatches and limited availabil-        The lifetime of CO is relatively short and ranges from weeks
ity of data. The systematic difference between the S5P total       to months (Novelli et al., 1998). CO reacts with atmospheric
column-averaged dry air mole fraction of carbon monoxide           oxidants, ozone (O3 ), hydroperoxy (HO2 ) and hydroxyl rad-
(XCO) and the TCCON data is on average 9.22 ± 3.45 %               icals (OH). It is the largest direct sink of OH affecting the
(standard TCCON XCO) and 2.45 ± 3.38 % (unscaled TC-               self-cleansing capacity of the atmosphere. An increase in CO
CON XCO). We found that the systematic difference be-              would imply a higher OH loss through chemical reaction and
tween the S5P CO column and NDACC CO column (exclud-               therefore less availability of OH for the depletion of other
ing two outlier stations) is on average 6.5±3.54 %. We found       atmospheric constituents such as CH4 . CO is therefore af-
a correlation of above 0.9 for most TCCON and NDACC sta-           fecting the concentrations of primary greenhouse gases and
tions. The study shows the high quality of S5P CH4 and CO          has an indirect but important influence in determining the
data by validating the products against reference global TC-       chemical composition and radiative properties of the atmo-
CON and NDACC stations covering a wide range of latitudi-          sphere. It is therefore considered as an indirect greenhouse
nal bands, atmospheric conditions and surface conditions.          gas (Stocker et al., 2013).
                                                                      Continuous precise and accurate global measurements of
                                                                   these gases are very important for long-term monitoring and
                                                                   their use by the inverse models such that the inferred sur-
1   Introduction                                                   face fluxes can be better constrained. This paper focuses
                                                                   on the quality assessment of the operational S5P CH4 and
The Sentinel-5 Precursor (S5P) mission with the TROPO-
                                                                   CO products by performing validation of the total columns
spheric Monitoring Instrument (TROPOMI) on board was
                                                                   of these two products with the reference data from all sta-
launched on 13 October 2017. The S5P is orbiting in a
                                                                   tions in the ground-based Total Carbon Column Observing
Sun-synchronous polar orbit with an Equator crossing at

Atmos. Meas. Tech., 14, 6249–6304, 2021                                             https://doi.org/10.5194/amt-14-6249-2021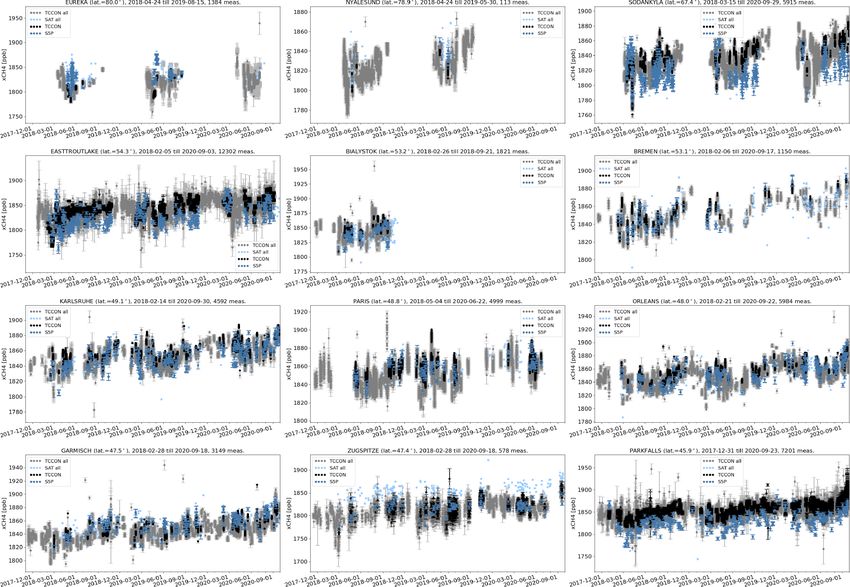
M. K. Sha et al.: S5P CH4 and CO validation                                                                                  6251

Network (TCCON) and Infrared Working Group of the Net-            correction here, and the details of the bias correction can
work for the Detection of Atmospheric Composition Change          be found in Sect. 5.6 of the algorithm theoretical baseline
(NDACC-IRWG) networks. The systematic and random er-              document (ATBD) for S5P methane retrieval (Hasekamp et
ror requirements of the CH4 and CO products are checked           al., 2019). The operational S5P CH4 product has been com-
based on 2.8 years of S5P data, and possible reasons are          pared to co-located Greenhouse Gases Observing Satellite
given where large deviations are observed.                        (GOSAT) proxy measurements. The S5P-GOSAT XCH4
   The paper is organised as follows: Sect. 2 describes the       ratio shows a high correlation to the retrieved surface albedo
satellite and ground-based reference data used in this study.     in the SWIR. The highest correlation is for low surface
Section 3 gives the details of the validation methodology.        albedo scenes. A posteriori bias correction has been applied
Section 4 gives the validation results for CH4 , and Sect. 5      to the S5P CH4 product using a second-order polynomial
gives the validation results for CO. Section 6 summarises our     fit. The effect of the bias correction is an increase of the re-
results and conclusions.                                          trieved CH4 for scenes with relatively low albedo conditions
                                                                  (e.g. forest scenes) and a decrease of CH4 for scenes with
                                                                  high albedo conditions (e.g. desert scenes). In the paper, we
2     Data                                                        will show the validation results of both standard and bias-
                                                                  corrected S5P CH4 products. The latest product versions
In this section, we present an overview of the input data from    of S5P CH4 data for the reprocessed (RPRO) and offline
the S5P and the reference ground-based data from the TC-          (OFFL) data from the start of the mission to 30 September
CON and NDACC-IRWG, herewith referred to as NDACC,                2020 are used in this work. The version numbers and the
which are used for the validation of the S5P operational CH4      respective dates are listed in Table 1, and further details
and CO products.                                                  on the relevant improvements are given in the product
                                                                  readme file (PRF; https://sentinel.esa.int/documents/247904/
2.1    S5P methane and carbon monoxide data sets                  3541451/Sentinel-5P-Methane-Product-Readme-File, last
                                                                  access: 14 July 2020). The quality assurance (QA) value is
TROPOMI is the unique payload of the ESA/Copernicus               provided as part of the CH4 data product. QA > 0.5 is used
Sentinel-5 Precursor mission orbiting in a low-Earth Sun-         as recommended by the PRF to filter out the S5P CH4 data
synchronous polar orbit with a wide swath of 2600 km across       to be used for the validation studies. This selection filters out
track resulting in daily global coverage. The TROPOMI ra-         measurements performed with surface albedo < 0.02, solar
diometric measurements of the Earth’s radiance and solar ir-      zenith angle (SZA) > 70◦ , viewing zenith angle > 60◦ and
radiance are processed using an on-ground data processor to       some other criteria as mentioned in the PRF.
retrieve the atmospheric abundances of ozone (O3 ), nitrogen          The operational processing to retrieve the total column
dioxide (NO2 ), sulfur dioxide (SO2 ), formaldehyde (HCHO),       density of carbon monoxide (CO) simultaneously with
methane (CH4 ), carbon monoxide (CO), as well as cloud and        interfering trace gases and effective cloud parameters
aerosol properties. The spatial resolution of the operational     (cloud height and optical thickness) is performed by the
level 2 (L2) CH4 and CO products was originally 7 × 7 km2         shortwave infrared carbon monoxide retrieval (SICOR)
and was increased to 5.5 × 7 km2 on 6 August 2019.                algorithm (Landgraf et al., 2016). The details describing the
   The operational processing to retrieve the total column-       theoretical baseline of the algorithm, the input and ancillary
averaged dry air mole fraction of methane (XCH4 ) is              data needed, example plots of averaging kernel and the
performed by the RemoTeC-S5P algorithm. The information           output generated are described in detail in Landgraf et al.
describing the theoretical baseline of the algorithm, the input   (2018). The bias requirement for total column-averaged
and ancillary data needed, averaging kernel and the output        dry air mole fraction of carbon monoxide (XCO) is 15 %
generated is described in detail in Hu et al. (2016) and          and the random error requirement is < 10 % (as reported
Hasekamp et al. (2019). The use of satellite measurements         in the official ESA document ESA-EOPG-CSCOP-PL,
for estimating sources and sinks of CH4 strongly depends on       2017, Table 1, p. 14). The CO total column L2 data
the precision and accuracy achieved. Systematic biases or         products are available as the OFFL and near-real-time
lower precision on regional or seasonal scales can jeopardise     (NRTI) timeliness data products. The version numbers
the usefulness of the satellite measurements for the estima-      and the respective dates are listed in Table 1 and further
tion of source and sink estimates (Bergamaschi et al., 2007).     details on the relevant improvements are given in the
The bias requirement for S5P XCH4 is 1.5 % and the random         PRF (https://sentinel.esa.int/documents/247904/3541451/
error requirement is 1 % (as reported in the official ESA         Sentinel-5P-Carbon-Monoxide-Level-2-Product-Readme-
document ESA-EOPG-CSCOP-PL, 2017, Table 1, p. 14).                File, last access: 14 July 2020). The latest product versions
The current S5P CH4 data are only processed for cloud-free        of S5P CO data for the RPRO and OFFL data from the start
measurements over land. Along with the standard CH4 prod-         of the mission to 30 September 2020 are used in this work.
uct, a bias-corrected CH4 product is also made operationally      The NRTI data stream delivers the CO data product within
available. We provide a brief summary of the CH4 bias             3 h after sensing, whereas the OFFL data are available a

https://doi.org/10.5194/amt-14-6249-2021                                            Atmos. Meas. Tech., 14, 6249–6304, 2021
6252                                                                             M. K. Sha et al.: S5P CH4 and CO validation

Table 1. S5P operational CH4 RPRO and OFFL data versions and CO RPRO and OFFL data versions used in the present work.

                      Product ID   Stream    Version    In operation from           In operation until
                                                        (orbit no., date)           (orbit no., date)
                      L2_CH4       RPRO      01.02.02   0657, 28 November 2017      5346, 25 October 2018
                                             01.03.01   2818, 30 April 2018         5832, 28 November 2018
                                             01.03.02   2463, 4 April 2018          2477, 5 April 2018
                                   OFFL      01.02.02   5833, 28 November 2018      7424, 20 March 2019
                                             01.03.00   7425, 20 March 2019         7906, 23 April 2019
                                             01.03.01   7907, 23 April 2019         8814, 26 June 2019
                                             01.03.02   8812, 26 June 2019          current version
                      L2_CO        RPRO      01.02.02   5236, 17 October 2018       5346, 25 October 2018
                                             01.03.01   2818, 30 April 2018         5832, 28 November 2018
                                             01.03.02   2463, 4 April 2018          2477, 5 April 2018
                                   OFFL      01.02.00   5346, 25 October 2018       5832, 28 November 2018
                                             01.02.02   5833, 28 November 2018      7424, 20 March 2019
                                             01.03.00   7425, 20 March 2019         7906, 23 April 2019
                                             01.03.01   7907, 23 April 2019         8814, 26 June 2019
                                             01.03.02   8815, 26 June 2019          current version

few days after sensing. Due to the different timeliness, the       validation of the CO product and also because a small
NRTI products are given in 5 min data granules, whereas            number of pixels < 5 % are affected by it. The striping effect
the OFFL data products are given per satellite orbit. The          is analysed in detail by Borsdorff et al. (2019). The effect on
consecutive data granules of the NRTI product show an              the TCCON validation was small. The destriping approach
overlap of about 12 scan lines. The NRTI processing chains         suggested by this work is planned to be implemented
employ the same algorithm as the OFFL since processor              by the operational TROPOMI CO processing in the near
version 01.03.02 starting from orbit no. 8906 on 3 July            future. Furthermore, the effect of updating the spectral
2019 (see Sect. 9.4 of Lambert et al., 2020, for validation        cross-sections in the TROPOMI CO processing for clear-sky
results showing the equivalence of S5P NRTI and OFFL               and cloudy conditions was analysed with ground-based
CO products). More details on the two processing streams           Fourier transform infrared (FTIR) measurements from 12
of the two data sets are given in the ATBD (Landgraf et al.,       stations of the TCCON network (Borsdorff et al., 2019).
2018). In this paper, we show the detailed validation results         In addition to the operational S5P CH4 and CO products,
of the S5P OFFL CO product. Data with QA values > 0.5              a scientific version of the products (TROPOMI/WFMD) us-
are used as recommended by the PRF. This selection filters         ing the weighting function modified differential optical ab-
out measurements performed with SZA ≥ 80◦ , sensor zenith          sorption spectroscopy (WFM-DOAS) has been developed
angle ≥ 80◦ , two most westward pixels due to unresolved           by the University of Bremen (http://www.iup.uni-bremen.
calibration issues and some other criteria as mentioned in the     de/carbon_ghg/products/tropomi_wfmd/, last access: 1 June
PRF. Furthermore, we also separated retrievals performed for       2021). The details of the TROPOMI/WFMD CH4 and
measurements under clear-sky (CLSKY; cloud optical thick-          CO products, their validation against reference ground-
ness < 0.5 and cloud height < 500 m, over land) and cloudy         based measurements and operational TROPOMI products,
conditions (CLOUD; cloud optical thickness ≥ 0.5 and               as well as use cases of the products to address important
cloud height < 5000 m, over land and ocean) as suggested           scientific applications can be found in Schneising et al.
by Borsdorff et al. (2018b). The clear-sky observations over       (2019, 2020a, b), Vellalassery et al. (2021).
the ocean have too-low signal intensities in the SWIR and
therefore cannot be used for the data interpretation. Unlike       2.2      Ground-based TCCON reference data set
the S5P CH4 a priori profiles which are available in the
L2 files, the S5P a priori profiles for CO were downloaded         The TCCON represents a network of ground-based Fourier
from ftp://ftp.sron.nl/pub/jochen/TROPOMI_apriori/ (last           transform spectrometers (FTSs), of the type Bruker IFS
access: 1 December 2020). Among the known data quality             125HR (some long-existing sites also use Bruker 120/5HR),
issues of the CO product, single overpasses of S5P show            that records direct solar absorption spectra in the NIR spec-
stripes of erroneous CO values < 5 % in the flight direction,      tral range to retrieve accurate and precise column-averaged
probably due to calibration issues of S5P. We did not do any       abundances of atmospheric constituents including CO2 , CH4
correction of this stripe pattern as we show the operational       and CO amongst other species (Wunch et al., 2011, 2015).

Atmos. Meas. Tech., 14, 6249–6304, 2021                                              https://doi.org/10.5194/amt-14-6249-2021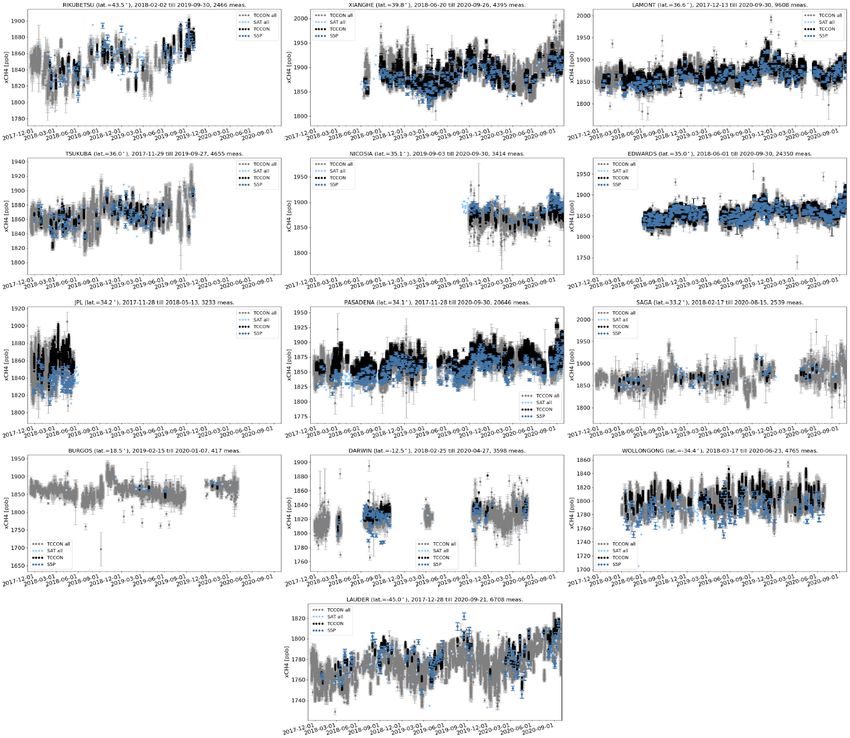
M. K. Sha et al.: S5P CH4 and CO validation                                                                                6253

It is the current state-of-the-art validation system for total    gaseous atmospheric components, including ozone (O3 ), ni-
column measurements of important GHGs by remote sens-             tric acid (HNO3 ), hydrogen chloride (HCl), hydrogen flu-
ing. TCCON data from several stations have been used in           oride (HF), carbon monoxide (CO), nitrous oxide (N2 O),
previous studies for the validation of trace gas data prod-       methane (CH4 ), hydrogen cyanide (HCN), ethane (C2 H6 )
ucts from satellite platforms such as OCO-2 (O’Dell et al.,       and chlorine nitrate (ClONO2 ) (https://www2.acom.ucar.
2018; Wunch et al., 2017), GOSAT (Iwasaki et al., 2017;           edu/irwg, last access: 1 June 2021). NDACC CH4 and CO
Kulawik et al., 2016), S5P (Sha et al., 2018a; Borsdorff          data from several stations have been used in previous studies
et al., 2018a, 2019), MOPITT (Hedelius et al., 2019) and          for satellites validation (Borsdorff et al., 2020; Hedelius et
SCIAMACHY (Borsdorff et al., 2016; Hochstaffl et al.,             al., 2019; Hochstaffl et al., 2018; Sha et al., 2018b; Buchholz
2018). Data from all stations (23 in the Northern Hemi-           et al., 2017; Olsen et al., 2017). In this study, data from all
sphere and 5 in the Southern Hemisphere) are used in this         stations (19 in the Northern Hemisphere and 5 in the South-
study and are listed in Table 2. The stations cover various       ern Hemisphere) are used and are listed in Table 3. Several
atmospheric conditions (humid, dry, polluted, presence of         of the stations are located in high-latitude regions and many
aerosol), various surface conditions (range of albedo, flat       stations are located at high altitudes to reduce the interfer-
terrain, high-altitude locations) and the latitudinal distribu-   ence of water vapour in the measurements. Some of these
tion from 80◦ N to 45◦ S. The stations at Nicosia and Xi-         stations (e.g. Karlsruhe, Garmisch, Sodankylä, Porto Velho)
anghe are not yet officially part of TCCON but perform ob-        are not officially part of NDACC but performs observations
servations and data analysis fully compatible with TCCON          and data analysis fully compatible with NDACC guidelines.
guidelines. GGG2014 (the current standard TCCON retrieval         The co-located NDACC and TCCON stations often share
code) XCH4 systematic errors for TCCON are below 0.5 %            one FTIR instrument, applying the respective detector and
for SZAs below 85◦ . The XCO errors are below 4 % and de-         filter settings. The spectra are analysed either with the SFIT4
crease with SZA (Wunch et al., 2015). The uncertainty in the      algorithm, an evolution of SFIT2 (Pougatchev et al., 1995)
scaling slope for XCO is 6 % (2σ ) (Hedelius et al., 2019).       or the PROFFIT9 algorithm (Hase et al., 2004) to retrieve
Previous studies have shown that the scaling factor of ∼ 7 %      vertical profiles of CH4 and CO. The retrieval allows the
used in GGG2014 to tie the TCCON XCO measurements to              derivation of a tropospheric and a stratospheric column of
the World Meteorological Organization (WMO) in situ scale         the target gases (Sepúlveda et al., 2012, 2014). The NDACC
is large compared to the current uncertainty in spectroscopy      CO column values can be used directly to validate the S5P
(Sha et al., 2018b; Hedelius et al., 2019; Zhou et al., 2019).    CO column values. However, for the S5P XCH4 validation,
A scaling factor of 7 % provided the best scaling to the in       the NDACC XCH4 values need to be calculated. Due to the
situ data available when the scaling for GGG2014 was cal-         NDACC measurements being performed in the MIR range,
culated. There is currently an ongoing effort within the TC-      the oxygen (O2 ) total column is not available from the spec-
CON community to determine whether the scaling factor is          trum for calculating the column-averaged dry air mole frac-
appropriate. These results are very important to decide on        tions of the target gas (Xgas), similar to what is done for
the choice of spectroscopic cross-sections that should be im-     TCCON (see Eq. A9 of Wunch et al., 2011). Therefore, the
plemented for the future improved S5P CO product (Bors-           total column of dry air is computed as described in Eq. (1) of
dorff et al., 2019). In this work, we use the official TCCON      Deutscher et al. (2010). The surface pressure (Ps ) is recorded
XCO product as well as an XCO product without the appli-          at the local weather station of the FTS stations and H2 O to-
cation of the empirical scaling factor, herewith referred to      tal column (TCH2 O ) is derived from the National Centers for
as unscaled XCO. The unscaled XCO was calculated fol-             Environmental Prediction (NCEP) reanalysis data set. In the
lowing Eq. (2) of Wunch et al. (2015), where the TCCON            event that there is no surface pressure available, we extrap-
data without the scaling to the WMO scale were obtained           olate the pressure grid to the surface. The XCH4 calculated
from the site PIs. The validation work is done using the stan-    values for NDACC measurements are then used for the vali-
dard and rapid delivery of TCCON data from the whole net-         dation of the S5P XCH4 data. Unlike TCCON data, where a
work. The publicly available TCCON data can be accessed           species-specific scaling factor is applied to tie the measure-
via https://tccondata.org/ (last access: 1 June 2021).            ments to the WMO in situ scale, the NDACC data do not ap-
                                                                  ply any scaling of the retrieved results. The typical accuracy
2.3   Ground-based NDACC-IRWG reference data set                  and precision of the NDACC CH4 data are about 3 % and
                                                                  1.5 %, respectively. The typical accuracy and precision of the
The IRWG of the NDACC represents a network of high-               NDACC CO data are about 3 % and 1 %, respectively. High
resolution Fourier transform spectrometers that records so-       systematic uncertainty is mainly due to the too-conservative
lar absorption spectra in the mid-infrared (MIR) spectral         spectroscopic uncertainty component. Both the consolidated
range. It is a multi-national collection of over 20 stations      data available via http://www.ndaccdemo.org/ (last access:
distributed from pole to pole (Eureka at 80◦ N to Arrival         1 June 2021) and the rapid delivery data supported by the
Heights at 77.8◦ S). The solar absorption spectra are used        CAMS27 project (https://cams27.aeronomie.be/, last access:
to retrieve the atmospheric concentrations of a number of         1 June 2021) have been used in this study.

https://doi.org/10.5194/amt-14-6249-2021                                           Atmos. Meas. Tech., 14, 6249–6304, 2021
6254                                                                                     M. K. Sha et al.: S5P CH4 and CO validation

Table 2. List of FTIR stations that are associated with TCCON and contributed to the present work by providing public and rapid delivery
data. The stations marked with an asterisk (∗ ) are not yet associated with TCCON but perform observations and data analysis fully compatible
with TCCON guidelines. Active dates correspond to the dates for which the measurements were provided from the satellite launch until the
present work.

     Station           Latitude   Longitude     Altitude     Active dates                      Data reference
                                               (km a.s.l.)
     Eureka            80.05◦ N   86.42◦ W        0.61       November 2017–Present             Strong et al. (2019)
     Ny-Ålesund        78.90◦ N   11.90◦ E        0.02       November 2017–Present             Notholt et al. (2014b)
     Sodankylä         67.37◦ N   26.63◦ E        0.19       November 2017–Present             Kivi et al. (2014), Kivi and Heikkinen (2016)
     East Trout Lake   54.35◦ N   104.99◦ W       0.50       November 2017–Present             Wunch et al. (2018)
     Białystok         53.23◦ N   23.05◦ E        0.18       November 2017–October 2018        Deutscher et al. (2019)
     Bremen            53.10◦ N   8.85◦ E         0.03       November 2017–Present             Notholt et al. (2014a)
     Karlsruhe         49.10◦ N   8.44◦ E         0.12       November 2017–Present             Hase et al. (2015)
     Paris             48.85◦ N   2.36◦ E         0.06       November 2017–Present             Té et al. (2014)
     Orléans           47.97◦ N   2.11◦ E         0.13       November 2017–Present             Warneke et al. (2019)
     Garmisch          47.48◦ N   11.06◦ E        0.74       November 2017–Present             Sussmann and Rettinger (2018a)
     Zugspitze         47.42◦ N   10.98◦ E        2.96       November 2017–Present             Sussmann and Rettinger (2018b)
     Park Falls        45.95◦ N   90.27◦ W        0.44       November 2017–Present             Wennberg et al. (2017)
     Rikubetsu         43.46◦ N   143.77◦ E       0.38       November 2017–Present             Morino et al. (2018c)
     Xianghe∗          39.75◦ N   116.96◦ E       0.05       November 2017–Present             Yang et al. (2019)
     Lamont            36.60◦ N   97.49◦ W        0.32       November 2017–Present             Wennberg et al. (2016b)
     Tsukuba           36.05◦ N   140.12◦ E       0.03       November 2017–Present             Morino et al. (2018a)
     Nicosia∗          35.14◦ N   33.38◦ E        0.19       August 2019–Present               Petri et al. (2019)
     Edwards           34.96◦ N   117.88◦ W       0.70       May 2018–Present                  Iraci et al. (2016)
     JPL               34.20◦ N   118.18◦ W       0.39       November 2017–May 2018            Wennberg et al. (2016a)
     Pasadena          34.14◦ N   118.13◦ W       0.23       November 2017–Present             Wennberg et al. (2015)
     Saga              33.24◦ N   130.29◦ E       0.01       November 2017–Present             Kawakami et al. (2014)
     Izaña             28.30◦ N   16.50◦ W        2.37       November 2017–Present             Blumenstock et al. (2017)
     Burgos            18.53◦ N   120.65◦ E       0.04       November 2017–Present             Morino et al. (2018c), Velazco et al. (2017)
     Ascension         7.92◦ S    14.33◦ W        0.01       November 2017–Present             Feist et al. (2014)
     Darwin            12.46◦ S   130.93◦ E       0.04       November 2017–Present             Griffith et al. (2014a)
     Réunion           20.90◦ S   55.49◦ E        0.09       November 2017–Present             De Mazière et al. (2017)
     Wollongong        34.41◦ S   150.88◦ E       0.03       November 2017–Present             Griffith et al. (2014b)
     Lauder            45.04◦ S   169.68◦ E       0.37       November 2017–Present             Sherlock et al. (2014), Pollard et al. (2019)

3    Validation methodology                                                    The validation of the S5P methane and carbon monoxide
                                                                            data is performed based on the reference data sets from the
S5P provides the total column density of CO, which can be                   ground-based TCCON and NDACC networks. We present
directly validated against the NDACC CO total column den-                   the results for both of the networks with different co-location
sity product. However, we need to calculate the correspond-                 criteria applied to the data sets. The differences in the valida-
ing XCO values in order to compare to the TCCON XCO                         tion results are also based on whether or not a common prior
products. The S5P XCO is calculated by taking the ratio of                  has been used for the satellite and ground-based FTIR data
the total column of CO (TCCO ) divided by the total column                  sets; details are discussed in Appendix A.
of the dry air (TCdry,air ) (following Eq. 1 in Deutscher et al.,              S5P provides daily global coverage with a huge data set
2010).                                                                      having a wide swath at a high spatial resolution for every
                                                                            overpass. Therefore, the selection of good co-location crite-
            TCCO                                                            ria is a crucial task in finding the best strict criteria while
XCO =
           TCdry,air                                                        ensuring sufficient co-located data for a statistically signif-
                           TCCO                                             icant validation. We tried several co-location criteria to test
 =                                                     ,         (1)        the sensitivity of the method in relation to the choice of the
     Ps /(g × mdry,air ) − TCH2 O × (mH2 O /mdry,air )
                                                                            parameter (e.g. time, distance, line of sight). The best co-
where Ps is the surface pressure, TCH2 O is the total column                location criteria will be such that the bias is robust and not
of H2 O, g is the column-averaged acceleration due to grav-                 sensitive to small changes in the co-location criteria. In the
ity, mdry,air and mH2 O are the molecular masses of dry air                 next sections, the results of the application of these criteria
and H2 O, respectively. Ps and TCH2 O are taken from the S5P                are shown for the case with the reduction of uncertainty due
files.                                                                      to smoothing and in relation to direct comparisons.

Atmos. Meas. Tech., 14, 6249–6304, 2021                                                      https://doi.org/10.5194/amt-14-6249-2021
M. K. Sha et al.: S5P CH4 and CO validation                                                                                            6255

Table 3. List of FTIR stations that are associated with NDACC-IRWG and contributed to the present work by providing public and rapid
delivery data. The stations marked with an asterisk (∗ ) are not yet associated with NDACC but perform observations and data analysis fully
compatible with NDACC guidelines. The location of the stations and the teams involved are indicated for the respective stations.

        Station               Latitude   Longitude      Altitude     Active dates             Teams
                                                       (km a.s.l.)
        Eureka                80.05◦ N   86.42◦ W         0.61       November 2017–Present    U. of Toronto; Batchelor et al. (2009)
        Ny-Ålesund            78.90◦ N   11.90◦ E         0.02       November 2017–Present    U. of Bremen
        Thule                 76.52◦ N   68.77◦ W         0.22       November 2017–Present    NCAR; Hannigan et al. (2009)
        Kiruna                67.84◦ N   20.40◦ E         0.42       November 2017–Present    KIT-ASF; IRF Kiruna
        Sodankylä∗            67.37◦ N   26.63◦ E         0.19       November 2017–Present    FMI; BIRA-IASB
        Harestua              60.20◦ N   10.80◦ E         0.60       November 2017–Present    Chalmers
        St. Petersburg        59.88◦ N   29.83◦ E         0.02       November 2017–Present    SPbU; Makarova et al. (2015)
        Bremen                53.10◦ N   8.85◦ E          0.03       November 2017–Present    U. of Bremen
        Karlsruhe∗            49.10◦ N   8.44◦ E          0.12       November 2017–Present    KIT-ASF
        Garmisch∗             47.48◦ N   11.06◦ E         0.74       November 2017–Present    KIT-IFU
        Zugspitze             47.42◦ N   10.98◦ E         2.96       November 2017–Present    KIT-IFU
        Jungfraujoch          46.55◦ N   7.98◦ E          3.58       November 2017–Present    U. of Liège
        Toronto               43.60◦ N   79.36◦ W         0.17       November 2017–Present    U. of Toronto; Wiacek et al. (2007)
        Rikubetsu             43.46◦ N   143.77◦ E        0.38       November 2017–Present    Nagoya U.; NIES
        Boulder               40.04◦ N   105.24◦ W        1.61       November 2017–Present    NCAR; Ortega et al. (2019)
        Izaña                 28.30◦ N   16.50◦ W         2.37       November 2017–Present    AEMET; KIT-ASF
        Mauna Loa             19.54◦ N   155.57◦ W        3.40       November 2017–Present    NCAR
        Altzomoni             19.12◦ N   98.66◦ W         3.98       November 2017–Present    UNAM
        Paramaribo            5.81◦ N    55.21◦ W         0.03       November 2017–Present    U. of Bremen
        Porto Velho∗          8.77◦ S    296.13◦ E        0.09       November 2017–Present    BIRA-IASB
        La Réunion–Maïdo      21.08◦ S   55.38◦ E         2.16       November 2017–Present    BIRA-IASB
        Wollongong            34.41◦ S   150.88◦ E        0.03       November 2017–Present    U. of Wollongong
        Lauder                45.04◦ S   169.68◦ E        0.37       November 2017–Present    NIWA
        Arrival Heights       77.82◦ S   166.65◦ E        0.20       November 2017–Present    NIWA

4   Validation of S5P methane products                                   anghe site in China, located in a heavily populated region,
                                                                         is a new site, which is operated following the recommenda-
                                                                         tions of TCCON but is not yet affiliated as a TCCON sta-
The validation of the S5P methane products with the ground-              tion. The NDACC stations are often located at high altitude
based FTIR data is discussed in this section. The TCCON                  (e.g. Altzomoni, Jungfraujoch, Mauna Loa, Zugspitze, Izaña,
stations cover a wide range of varying ground conditions                 Maïdo, Boulder). Several of the NDACC stations are located
and topography. The high-latitude stations (e.g. Eureka, Ny-             at high latitudes (e.g. Eureka, Ny-Ålesund, Thule, Kiruna,
Ålesund, Sodankylä, East Trout Lake) challenge the satel-                Sodankylä). Several of the NDACC stations are located near
lite algorithm for measurements at very high SZAs, high air              or in urban areas (e.g. Bremen, St. Petersburg, Toronto, Boul-
masses and scenes with snow or ice coverage. The Edward                  der, Altzomoni – close to Mexico City). The NDACC station
site is adjacent to a very bright playa. The Park Falls and La-          at Arrival Heights is the only site on the Antarctic continent.
mont stations have relatively uniform surface properties but             TCCON provides dry-air column-averaged mole fractions of
the ground cover can vary seasonally. The TCCON stations at              methane similar to the S5P product, whereas NDACC pro-
Izaña and Zugspitze are located at high altitude. Izaña along            vides concentration profiles of methane with sensitivities up
with Ascension, Réunion and Burgos are located on small                  to about 20 km. As the characteristics of the two reference
islands, remote from large landmasses but with significant               ground-based data sets are different, two slightly different
topography. Several stations are located near or in urban re-            comparison methods were applied for the validation study
gions with a large population (e.g. Pasadena, Paris, Tsukuba).           which are discussed in this section.
The Darwin site has the ocean to the north. The Wollongong
site has the ocean on one side and a sharp escarpment on the             4.1   Validation of S5P bias-corrected vs. standard
other. The Lauder site is surrounded by hills. Nicosia is a                    methane data using TCCON and NDACC data sets
new site, operational since August 2019, using a FTIR which
was moved from the Białystok TCCON station after its clo-                The validation results of the S5P bias-corrected and stan-
sure in October 2018. The TCCON observatory at Nicosia                   dard methane products with reference TCCON and NDACC
has been calibrated by vertical aircraft profiling at its former         data are discussed in this section. The S5P observations co-
location in Białystok but not at its current location. The Xi-           located with the ground-based reference measurements are

https://doi.org/10.5194/amt-14-6249-2021                                                   Atmos. Meas. Tech., 14, 6249–6304, 2021
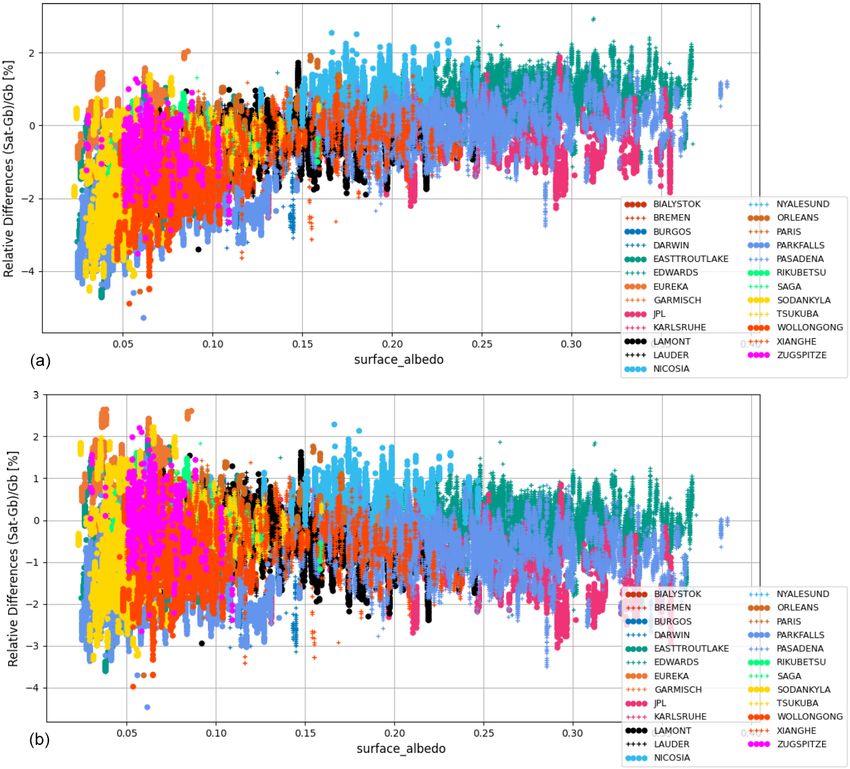
6256                                                                             M. K. Sha et al.: S5P CH4 and CO validation

found by selecting all filtered S5P pixels within a radius of       rection of the S5P XCH4 product being a function of the
100 km around each site and with a maximal time difference          surface albedo acts differently at the different TCCON sta-
of 1 h for TCCON and 3 h for NDACC observations. The                tions. Figure 2 shows the relative difference of the bias for
1 h time difference for TCCON can be justified by noting            the standard (top panel) and bias-corrected (bottom panel)
that TCCON instruments acquire only one type of spectra             S5P XCH4 products as a function of the retrieved S5P SWIR
and from each good spectrum methane is retrieved, while             surface albedo at the TCCON stations. The bias correction of
NDACC instruments are required to measure different types           the S5P XCH4 product brings the high negative relative dif-
of spectra with different optical filter configurations, making     ferences closer to zero for low surface albedo conditions and
the number of methane observations more sparse. An effec-           the high positive relative differences closer to zero for high
tive location of the FTIR measurement on the line of sight          surface albedo conditions. The low surface albedo conditions
(i.e. at a 5 km altitude) is used to do the co-location. The        also show a high scatter in the relative difference plots. The
co-located pixels can therefore differ from measurement to          latter is mainly because the scenes with low surface albedo
measurement. For each of the ground-based measurements              are challenging for satellite-retrieved products due to large
which are co-located with the S5P measurements, an aver-            measurement noise. The difference of the mean relative bias
age of all S5P pixels is done. Co-located pairs are created be-     between the S5P bias-corrected and the standard XCH4 prod-
tween ground-based and averaged S5P only if a minimum of            uct for each TCCON station is shown as a magenta bar in the
five pixels is found in applying the coincidence criteria. In the   middle panel plot (labelled – diff_bcvsstd) of Fig. 1. It shows
comparison, the a priori profiles in the TCCON and NDACC            the overall direction of change is positive for most stations
retrievals have been substituted with the S5P methane a pri-        (low surface albedo conditions) and negative for few stations
ori following Eq. (A1). The a priori alignment, i.e. align-         like Edwards, JPL and Pasadena (high surface albedo con-
ing the a priori profile to a common one, is done to com-           ditions). The standard deviations of the relative bias for the
pensate/correct its contribution to the smoothing equation          S5P standard and bias-corrected XCH4 products are compa-
(Rodgers and Connor, 2003). The TCCON results with the              rable. Scenes with low and high albedos pose specific chal-
S5P prior substituted are then compared directly to the S5P         lenges for S5P CH4 retrieval. Validation of S5P CH4 data
XCH4 data. However, the NDACC CH4 concentration profile             at additional sites with different conditions (e.g. high sur-
with the S5P prior substituted is additionally smoothed with        face albedo, high humidity, regions not covered by TCCON
the S5P column-averaging kernel following Eq. (A2). The             and NDACC) using portable FTIR spectrometers (Sha et al.,
NDACC XCH4 is derived as discussed in Sect. 2.3 and then            2020) will give further insight into the S5P CH4 product
compared to the S5P XCH4 data. Furthermore, each valida-            quality.
tion run also includes the adaptation of the S5P columns to            The relative biases are plotted as mosaic plots and shown
the altitude of the ground-based FTIR instruments for cases         in Fig. 3, where the top panel shows the bias for S5P standard
where satellite averaging kernel is not applied or when col-        XCH4 product, while the bottom panel shows the bias for
umn boundaries may differ (see Appendix B for details).             S5P bias-corrected XCH4 product relative to TCCON. Each
   Table 4 provides the validation results for the S5P bias-        bar in the mosaic plots represents the weekly averages of the
corrected and standard XCH4 data with the a priori aligned          relative bias values. The high-latitude stations show a high
TCCON data at each TCCON station. The systematic differ-            positive bias during the spring, which is then reduced and
ence (the mean of all relative differences) between the S5P         even switched sign to show negative bias during the autumn.
and TCCON data is on average −0.68 ± 0.74 % (S5P stan-              Lorente et al. (2021), while analysing the improvements of
dard XCH4 product) and −0.26±0.56 % (S5P bias-corrected             their scientific S5P XCH4 product, found similar seasonality
XCH4 product). Only at a few TCCON stations (Sodankylä,             in the bias at the high-latitude sites of Sodankylä and East
East Trout Lake, Park Falls and Wollongong) is the bias             Trout Lake and indicated correlations of high bias during
slightly higher than 1.5 % for the S5P standard XCH4 prod-          spring time with the presence of snow (low surface albedo
uct. The albedo dependence correction of the S5P XCH4               in the SWIR but high surface albedo in the NIR). In addition,
product shows a reduced bias relative to the TCCON data             the high-latitude sites are also influenced by the polar vortex,
and are within the 1.5 %. The standard deviation of the rela-       which is difficult to be represented by the a priori profile. The
tive bias, which is a measure of the random error, is well be-      difference of the a priori profile from the true atmospheric
low 1 % for both standard (0.59±0.17 %) and bias-corrected          profile will also add to the bias. This will be discussed fur-
(0.57 ± 0.18 %) S5P XCH4 products.                                  ther in the next section. Since measurements rely on direct
   Figure 1 shows the bar plots for the S5P XCH4 mean               line of sight of the Sun, data are not available during the win-
relative bias with respect to the TCCON XCH4 data at all            ter months for high-latitude stations. The time series of the
stations (left panel) and the standard deviation of the rela-       S5P bias-corrected XCH4 product and TCCON data for each
tive bias (right panel). The comparisons relative to the S5P        site are shown in Figs. 4 and 5. The ground-based TCCON
bias-corrected XCH4 product (labelled – bcsm100k1h) are             XCH4 data are represented in grey and the S5P data during
the blue bars and those for the standard XCH4 product (la-          that period are shown in light blue. The S5P data co-located
belled – stdsm100k1h) are the magenta bars. The bias cor-           with TCCON data are shown in blue and the co-located TC-

Atmos. Meas. Tech., 14, 6249–6304, 2021                                              https://doi.org/10.5194/amt-14-6249-2021
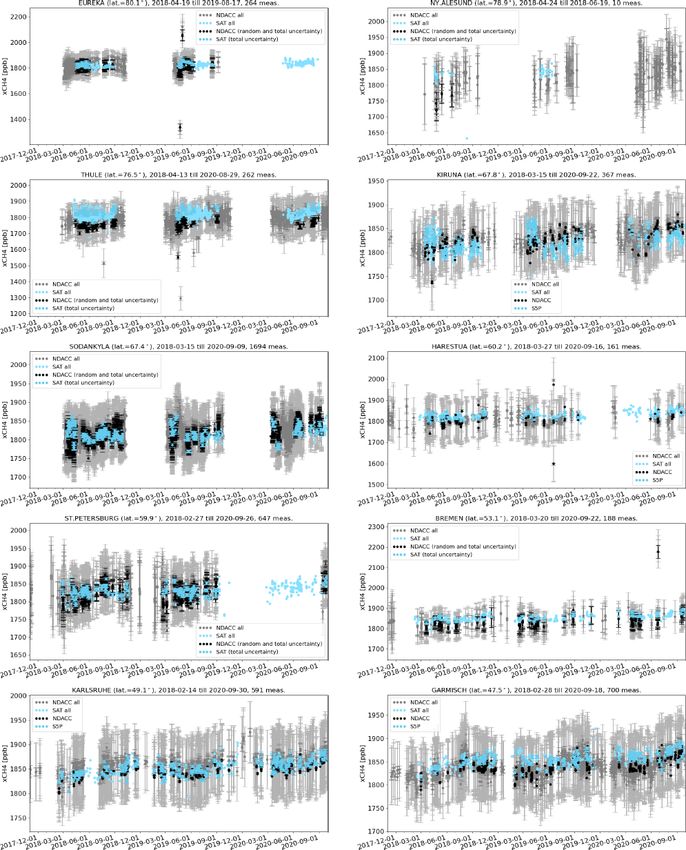
Table 4. S5P XCH4 validation results against TCCON XCH4 data at 25 stations for the period between November 2017 and September 2020. Spatial co-location with radius of 100 km
                                           or cone with 1◦ opening angle along the FTIR line of sight and time co-location of ±1 h around the satellite overpass were used. TCCON station (column 1) are sorted according to the
                                           decreasing latitude (column 2). The column with title “No.” represents the number of co-located measurements, column title “SD” represents the standard deviation of the time series of
                                           the ground-based data relative to the standard deviation of the time series of the S5P data, column title “Corr” represents the correlation coefficient between the S5P and the reference
                                           ground-based data, column title “Rel diff bias” represents the relative difference ((SAT – GB)/GB) bias in percent, and column title “Rel diff SD” represents the standard deviation of
                                           the relative bias in percent.

                                            Site                     Lat       S5P bc XCH4 smooth 100 km 1 h             S5P XCH4 smooth 100 km 1 h               S5P bc XCH4 100 km 1 h            S5P bc XCH4 smooth cone 100 km 1 h
                                                                             No.    SD    Corr    Rel diff   Rel diff   SD    Corr    Rel diff   Rel diff   SD      Corr    Rel diff   Rel diff     No.    SD     Corr    Rel diff   Rel diff
                                                                                                 bias (%)    SD (%)                  bias (%)    SD (%)                    bias (%)    SD (%)                            bias (%)    SD (%)

https://doi.org/10.5194/amt-14-6249-2021
                                            Eureka                    80    1384      1   0.62       0.8        0.77    0.8   0.79      0.22        0.67      1     0.66      0.87        0.72       648   0.9    0.74      0.83        0.66
                                            Ny-Ålesund              78.9      113     1   0.97      0.63        0.13      1   0.95     −0.23        0.17    0.9     0.95      0.71        0.17        11   2.8   −0.56      0.89        0.09
                                                                                                                                                                                                                                                M. K. Sha et al.: S5P CH4 and CO validation

                                            Sodankylä               67.4    5915    0.9   0.37     −0.84        0.99    0.9   0.36     −1.87        1.01    0.9      0.4      −0.7        0.96     4681    0.9    0.42     −0.92        0.93
                                            East Trout Lake         54.3   12 302   0.8   0.64      −0.9        0.93    0.8   0.62     −1.85        0.95    0.9     0.67     −0.72        0.91    10 358   0.9    0.65     −0.98        0.88
                                            Białystok               53.2    1821    0.7   0.46     −0.46        0.56    0.8   0.37     −0.99        0.57    0.8     0.49     −0.21        0.56     1623    0.8    0.41     −0.35        0.54
                                            Bremen                  53.1    1150    0.9   0.81     −0.15        0.49      1   0.79     −0.68        0.49      1     0.82      0.03         0.5     1081    0.9     0.8     −0.17         0.5
                                            Karlsruhe               49.1    4592    0.8   0.79     −0.36        0.48    0.8   0.82     −1.04        0.49    0.8     0.79     −0.13        0.48     4114    0.8    0.81     −0.35        0.45
                                            Paris                   48.8    4999      1   0.67     −0.03        0.49    0.8   0.55     −0.67        0.63      1     0.69      0.18        0.48     4370    0.9    0.67      0.01        0.53
                                            Orléans                   48    5984    0.8   0.79     −0.34        0.52    0.6   0.79     −0.94        0.65    0.8     0.79     −0.15        0.52     5712    0.8    0.79     −0.44        0.52
                                            Garmisch                47.5    3149    0.9   0.77      0.19        0.49    0.8   0.77     −0.61        0.51    0.9     0.79      0.41        0.48     1520    0.9    0.83       0.1        0.43
                                            Zugspitze               47.4      578   1.3   0.59      0.03        0.73    1.4   0.62     −0.78        0.69    1.4     0.61      0.23        0.75       290   1.5    0.48      0.09        0.69
                                            Park Falls              45.9    7201    0.8    0.7     −1.46        0.75    0.8   0.67     −2.35        0.77    0.8     0.71     −1.27        0.74     6671    0.8     0.7     −1.43        0.77
                                            Rikubetsu               43.5    2466    0.8   0.83      −0.1        0.59    0.9    0.8     −0.81        0.62    0.9     0.85      0.05        0.55     2206    0.8    0.83      −0.1         0.6
                                            Xianghe                 39.8    4395      1   0.87     −0.45        0.61    1.2   0.81     −0.52        0.68      1     0.87     −0.23        0.61     3706    0.9    0.88     −0.47         0.6
                                            Lamont                  36.6    9608    0.9   0.84     −0.36        0.53    0.9   0.84     −0.58        0.53    0.9     0.84     −0.22        0.52     8053    0.9    0.85     −0.25        0.49
                                            Tsukuba                   36    4655    0.9   0.84     −0.02        0.43      1   0.84     −0.46        0.43      1     0.86       0.1        0.42     4494    0.9    0.86      0.03        0.43
                                            Nicosia                 35.1    3414    0.9   0.85      0.62        0.41    0.8   0.83      0.89        0.52      1     0.85      0.65        0.41     3325    0.9    0.85       0.6        0.41
                                            Edwards                   35   24 350   0.9   0.85     −0.07        0.45      1   0.83      0.82        0.47    0.9     0.85     −0.01        0.44    22 987   0.9    0.86     −0.09        0.44
                                            JPL                     34.2    3233    1.1   0.33     −1.34        0.63      1    0.4     −0.54        0.65    1.1     0.34      −1.2        0.62     1954    0.9    0.27     −1.14        0.67
                                            Pasadena                34.1   20 646   0.9   0.79     −0.73        0.57    0.9   0.74     −0.03        0.61    0.9     0.81     −0.67        0.55    15 868   0.9    0.85     −0.55        0.52
                                            Saga                    33.2    2539    0.9   0.79      0.09        0.53    0.9   0.79      −0.6        0.51    0.9     0.81      0.21         0.5     1943    0.9    0.83      0.27        0.49
                                            Burgos                  18.5      417     1   0.76      0.23        0.36    0.9   0.77     −0.75        0.37    0.9     0.77      0.28        0.34       269   0.8    0.76      0.26        0.33
                                            Darwin                 −12.5    3598    0.5   0.23     −0.32        0.71    0.5    0.3     −0.53        0.71    0.5     0.27     −0.24        0.69     3267    0.5    0.24     −0.33         0.7
                                            Wollongong             −34.4    4765    0.9   0.55     −0.88        0.69    0.8   0.56     −1.57        0.69    0.8     0.54     −0.81        0.69     4677    0.9    0.56     −0.86        0.67
                                            Lauder                  −45     6708      1    0.8     −0.18         0.5    0.9   0.84      −0.6        0.47    0.9      0.8     −0.12        0.51     1771    0.9    0.92     −0.48        0.37
                                            Mean of all stations                    0.9    0.7     −0.26        0.57    0.9    0.7     −0.68        0.59    0.9     0.71     −0.12        0.57               1    0.65     −0.23        0.55
                                            SD of all stations                      0.2   0.19      0.56        0.18    0.2   0.18      0.74        0.17    0.2     0.18      0.55        0.17             0.4    0.32      0.58        0.18

Atmos. Meas. Tech., 14, 6249–6304, 2021
                                                                                                                                                                                                                                                    6257
6258                                                                                    M. K. Sha et al.: S5P CH4 and CO validation

Figure 1. S5P XCH4 validation results against TCCON XCH4 data at 25 stations within the period between November 2017 and September
2020. (a) Bar chart of mean relative bias ((SAT – GB)/GB) in percent; (c) standard deviation of the relative bias in percent; (b) difference of
the mean relative bias for validation cases (stdsm100k1h, bc100k1h, bcsm100k1hcone) in percent against the reference case (bcsm100k1h)
in percent. Spatial co-location with radius of 100 km or cone with 1◦ opening angle along the FTIR line of sight and time co-location of ±1 h
around the satellite overpass were used. The stations are sorted with decreasing latitude.

CON data with a priori alignment are shown in black. The                  such as Ny-Ålesund, JPL and Białystok are due to the lim-
amplitude of the CH4 seasonal cycle is different at the differ-           ited data sets available for the comparison. The Ny-Ålesund
ent sites. This is related to the variability of the CH4 concen-          station is located on the shore of a bay on the west coast of the
trations in the atmosphere. The CH4 concentration profile de-             island of Spitsbergen in Svalbard, Norway. As a result, only
creases rapidly with increasing altitude above the tropopause             a few valid S5P XCH4 pixels are found around the station,
height. The concentration of CH4 in the stratosphere, along               resulting in limited co-located data available for comparison.
with the troposphere, plays a key role in determining the total           The TCCON instruments from the JPL and Białystok sta-
column of CH4 at the given location. The CH4 seasonal cycle               tions were moved to Edwards and Nicosia, respectively, thus
in the troposphere is driven by the seasonality of both CH4               resulting in limited data sets available from these sites. The
sources and its sinks (mainly due to the reaction with OH),               very low correlation for Darwin and Wollongong is due to
while the CH4 seasonal cycle in the stratosphere is dominated             the low satellite values for some days (see Fig. 5), and for
by the vertical transport (Sepúlveda et al., 2012; Ostler et al.,         high-latitude sites it is due to the jump in the bias between
2014; Bader et al., 2017; Zhou et al., 2018). The time series             the spring and later months (see Fig. 6). The altitude correc-
of the relative bias plots shown in Figs. 6 and 7 indicate a              tion of the pixels works well, as can be seen by the relatively
seasonal cycle, which is clearly seen for stations with a high            good correlation for Zugspitze; however, the scatter in the
density of reference data with a low scatter, e.g. Park Falls,            data is high.
East Trout Lake, Lamont, Edwards and Pasadena.                               Table 5 provides the validation results for the S5P bias-
   Taylor diagrams for the S5P bias-corrected XCH4 and TC-                corrected and standard XCH4 data with the smoothed
CON XCH4 data with a priori alignment are shown in Fig. 8.                NDACC data at each NDACC station. The systematic differ-
The correlation, represented by the angular coordinate, is                ence (the mean of all relative differences) between the S5P
above 0.6 for most stations (see Table 4 for exact values), and           and NDACC data is on average −0.11 ± 1.19 % (S5P stan-
the distance to the origin of the ground-based dot relative to            dard XCH4 product) and 0.57 ± 0.83 % (S5P bias-corrected
the satellite dot (ratio of SD of ground-based data to the SD             XCH4 product). The mean of all stations is calculated by
of S5P) is below 1 for most stations, implying that the satel-            excluding outliers, which are stations with a low number
lite data are more variable than the ground-based data. The               of co-locations (Ny-Ålesund, Rikubetsu), high scatter in
correlation is mostly dominated by the seasonal cycle, and                the ground-based data (Toronto) and unexpected high bias
low correlations are seen for high-latitude sites where a bias            (Thule, Arrival Heights). Thule is located on the western
jump is seen between spring and summer periods. Outliers                  coastline of Greenland. The valid S5P XCH4 pixels within

Atmos. Meas. Tech., 14, 6249–6304, 2021                                                      https://doi.org/10.5194/amt-14-6249-2021
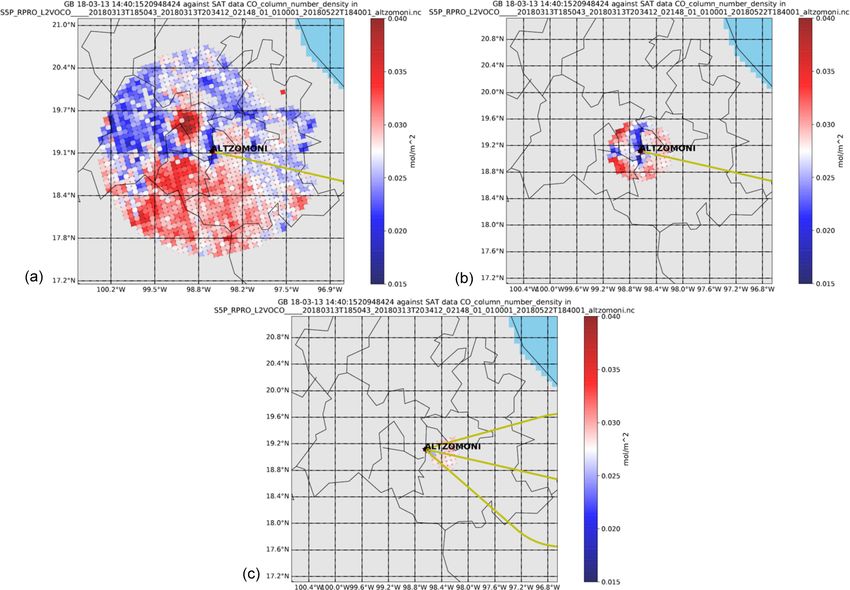
M. K. Sha et al.: S5P CH4 and CO validation                                                                                      6259

Figure 2. Relative biases between co-located S5P (standard XCH4 product – a; bias-corrected XCH4 product – b) and TCCON XCH4 data
with a priori alignment are plotted as a function of the surface albedo retrieved by S5P at 25 TCCON stations within the period between
November 2017 and September 2020. Spatial co-location with radius of 100 km and time of ±1 h around the satellite overpass were used.

the co-location radius around Thule show several pixels with          seen with respect to S5P (see Sect. 4.3 on how using an ad-
high XCH4 values. These high XCH4 values are in general               vanced co-location criterion reduces the bias at Altzomoni).
found along the coastline and regions with altitude variabil-         The mean standard deviation of the relative bias, which is a
ity. Although a filter for the variability of the terrain rough-      measure of the random error, is about 1 % for both the S5P
ness is applied in the QA filter options, these high values           standard (1.05 ± 0.51 %) and bias-corrected (1.04 ± 0.52 %)
along the coastline of Greenland need detailed investigation          XCH4 products. The high-latitude stations in the Northern
and possible optimisation of the filter settings to remove the        Hemisphere show values slightly higher than 1 %.
unexpected high values. We also observe valid pixels with                The S5P XCH4 mean relative bias and the standard de-
unexpected high XCH4 around the coastline and terrains with           viation of the relative bias with respect to the NDACC sta-
altitude variability in Antarctica. This is also the reason for       tions as shown in Table 5 are shown as bar plots in Fig. 9.
the high bias observed at the Arrival Heights station located         The comparisons relative to the S5P bias-corrected XCH4
along the west side of the Hut Point Peninsula on Ross Island,        product (labelled – bcsm100k1h) are the blue bars and those
Antarctica. The bias at Altzomoni is relatively high (2.44 %          for the standard XCH4 product (labelled – stdsm100k3h) are
for S5P XCH4 bias-corrected product), while the random er-            the magenta bars. The standard deviations of the relative bias
ror is comparable to other sites and within 1 %. Bezanilla            (right panel) for the S5P standard and bias-corrected XCH4
et al. (2014) found large variability in CH4 total columns            products are comparable. Figure 10 shows the relative differ-
measured at the Mexico City basin, pointing to significant            ence of the bias for the S5P standard (top panel) and bias-
local emissions affecting the natural background levels. A            corrected (bottom panel) XCH4 products as a function of the
co-location mismatch would contribute partly to the bias              retrieved surface albedo at the NDACC stations. Similar to

https://doi.org/10.5194/amt-14-6249-2021                                                Atmos. Meas. Tech., 14, 6249–6304, 2021
M. K. Sha et al.: S5P CH4 and CO validation
https://doi.org/10.5194/amt-14-6249-2021
Table 5. S5P XCH4 validation results against NDACC XCH4 data at 20 stations for the period between November 2017 and September 2020. Spatial co-location with radius of 100 km
or cone with 1◦ opening angle along the FTIR line of sight and time co-location of ±3 h around the satellite overpass were used. NDACC station (column 1) are sorted according to the
decreasing latitude (column 2). The column with title “No.” represents the number of co-located measurements, column title “SD” represents the standard deviation of the time series of
the ground-based data relative to the standard deviation of the time series of the S5P data, column title “Corr” represents the correlation coefficient between the S5P and the reference
ground-based data, column title “Rel diff bias” represents the relative difference ((SAT – GB)/GB) bias in percent, and column title “Rel diff SD” represents the standard deviation of
the relative bias in percent.
Site Lat S5P bc XCH4 smooth 100 km 3 h S5P XCH4 smooth 100 km 3 h S5P bc XCH4 100 km 3 h S5P bc XCH4 smooth cone 100 km 3 h
No. SD Corr Rel diff Rel diff SD Corr Rel diff Rel diff SD Corr Rel diff Rel diff No. SD Corr Rel diff Rel diff
bias (%) SD (%) bias (%) SD (%) bias (%) SD (%) bias (%) SD (%)
Eureka 80.1 264 2.5 0.37 0.95 2.57 3.4 0.34 0.16 2.56 2.5 0.35 0.41 2.71 67 1.3 0.74 0.88 0.75
Ny-Ålesund 78.9 10 2.9 0.92 4.73 0.98 3 0.82 3.79 1.03 2.9 0.94 2.53 0.9
Thule 76.5 262 1.2 0.7 4.52 1.09 1.2 0.67 3.47 1.12 1.2 0.68 2.66 1.12 65 0.9 0.61 4.98 1.14
Kiruna 67.8 367 0.9 0.14 −0.15 1.43 1 0.16 −1.12 1.37 0.8 0.3 −0.55 1.23 256 1 0.2 −0.4 1.38
Sodankylä 67.4 1694 1.1 0.45 0.15 1.07 1.1 0.42 −0.88 1.09 1.2 0.49 −0.17 1.11 1303 1.1 0.48 0.01 0.96
Harestua 60.2 161 2.2 0.31 0.86 1.57 2.2 0.29 −0.27 1.57 2.3 0.31 0.84 1.67 89 1.2 0.22 0.86 0.99
St. Petersburg 59.9 647 1.3 0.49 0.31 0.9 1.3 0.39 −0.64 0.98 1.4 0.51 −0.21 0.94 529 1.3 0.5 0.43 0.89
Bremen 53.1 188 1.9 0.52 1.44 1.34 1.9 0.5 0.95 1.35 2.1 0.56 1.16 1.42 182 1.1 0.68 1.59 0.82
Karlsruhe 49.1 591 0.9 0.79 0.33 0.47 0.8 0.77 −0.35 0.51 0.9 0.79 −0.37 0.46 485 0.9 0.77 0.42 0.5
Garmisch 47.5 700 1 0.56 0.79 0.75 1 0.51 −0.02 0.8 1.1 0.55 0.53 0.81 141 1 0.71 0.76 0.59
Zugspitze 47.4 485 1.1 0.7 0.65 0.65 1.1 0.69 −0.13 0.65 1.3 0.68 0.58 0.77 86 1 0.63 0.69 0.61
Jungfraujoch 46.6 178 0.9 0.66 −0.23 0.76 0.9 0.64 −0.89 0.76 1.1 0.64 −0.24 0.89 31 1 0.73 −0.12 0.55
Toronto 43.6 337 3.5 −0.13 1.72 3.95 3.6 −0.08 1.14 3.87 3.6 −0.12 0.67 3.98 235 2.5 −0.18 1.78 3.4
Rikubetsu 43.5 31 1.9 −0.02 1.7 2.29 2.2 0.06 0.96 2.17 1.8 0.09 1.56 2.03 24 1.8 0.02 2.1 2.38
Boulder 40 393 1.4 0.26 1.66 0.9 1.3 0.45 2.09 0.79 1.1 0.34 0.83 0.74 289 1.4 0.42 1.76 0.86
Atmos. Meas. Tech., 14, 6249–6304, 2021
Altzomoni 19.1 325 0.9 0.45 2.44 0.68 1 0.23 2.59 0.76 1 0.52 2.52 0.68 188 1.1 0.48 1.95 0.64
Porto Velho −8.8 53 1.4 0.06 −0.76 0.81 1.3 0.06 −1.98 0.82 1.5 0.16 −1.34 0.8 51 1.5 −0.05 −0.82 0.77
Wollongong −34.4 716 0.9 0.62 −0.04 0.78 0.9 0.6 −0.76 0.81 1 0.57 −0.75 0.84 603 0.9 0.65 0 0.74
Lauder −45 561 1.5 0.61 0.08 0.99 1.4 0.68 −0.33 0.9 1.3 0.61 −0.41 0.89 41 1.4 0.71 0.38 0.75
Arrival Heights −77.8 45 0.7 0.64 2.65 0.78 0.7 0.62 1.66 0.8 1 0.81 2.26 0.62 2 0.3 −1 2.22 0.19
Mean of all stations∗ 1.3 0.47 0.57 1.04 1.4 0.45 −0.11 1.05 1.4 0.49 0.19 1.06 1.1 0.52 0.56 0.79
SD of all stations∗ 0.5 0.21 0.83 0.52 0.7 0.21 1.19 0.51 0.5 0.17 0.94 0.55 0.2 0.24 0.79 0.22
∗ The mean of all stations is calculated by excluding outliers which are stations with a low number of co-locations (Ny-Ålesund, Arrival Heights, Rikubetsu), high scatter in the ground-based data (Toronto), high unexpected bias (Thule).
6260You can also read