Sanitary Survey - Review - Poole Harbour 2021 - Carcinus Ltd
←
→
Page content transcription
If your browser does not render page correctly, please read the page content below
Sanitary Survey - Review
Poole Harbour – 2021

               Document No. – J0591/21/05/24

Carcinus Ltd, Wessex House, Upper Market Street, Eastleigh, Hampshire, SO50 9FD.
Tel. 023 8129 0095
https://www.carcinus.co.uk/
Cover image: Low Tide, Poole Harbour. Photo © N Chadwick CC-BY-SA.

Page | i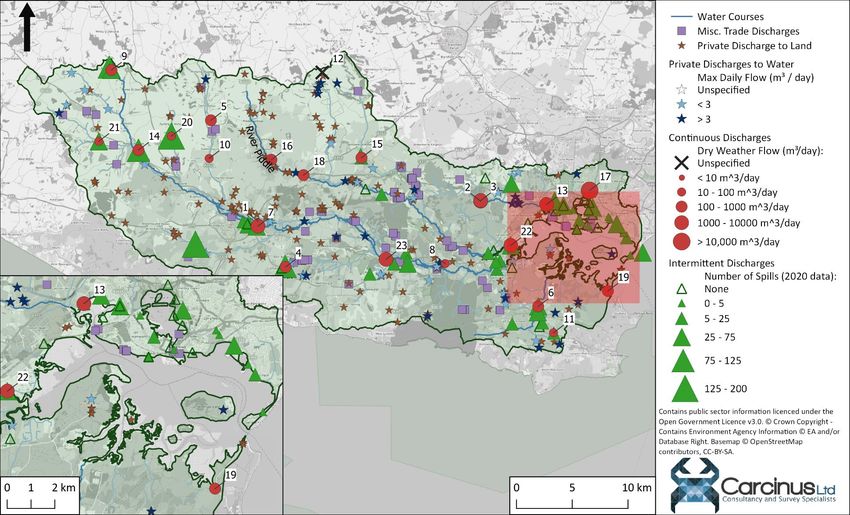
Carcinus Ltd – Document Control Sheet

 Client                         Food Standards Agency (FSA)

 Project Title                  Sanitary Survey Review

 Document Title                 Sanitary Survey - Poole Harbour

 Document Number                J0591/21/05/24

 Revision                       3.0

 Date                           25 January 2022

Revisions
 Revision        Date                   Comment
 No.

 0.1             17 June 2021           Internal Draft

 1.0             18 June 2021           Draft for FSA Review

 2.0             25 June 2021           Draft for secondary consultation

 2.1             11 January 2022        Draft following secondary consultation

 3.0             25 January 2022        Final document

Document QA and Approval
                  Name                       Role                          Date

 Author                 Joshua Baker         Freshwater and Marine         25 January 2022
                                             Ecologist

 Checked                Matthew Crabb        Director                      25 January 2022

 Approved               Matthew Crabb        Director                      25 January 2022

Initial Consultation
 Consultee                       Date of consultation             Date of response

 BCP Council                     05 May 2021                      17 May 2021

 Environment Agency              05 May 2021                      14 May 2021

Page | ii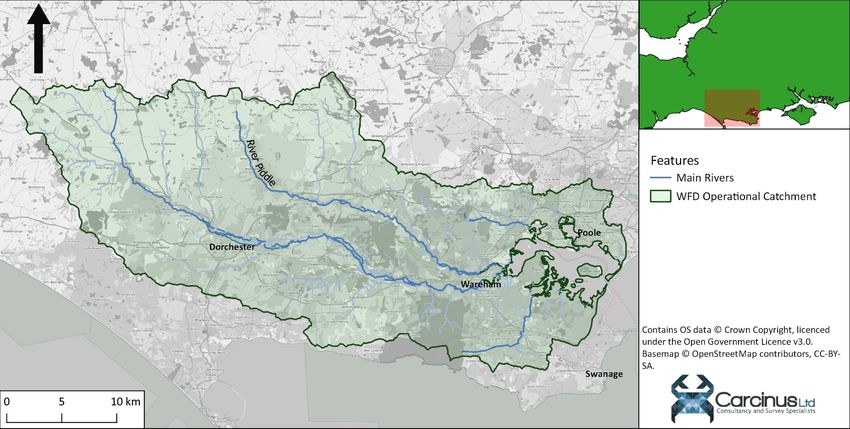
Consultation on draft report
 Consultee                       Date of consultation            Date of response

 BCP Council                     28 June 2021                    03 September 2021

 Environment Agency              28 June 2021                    25 August 2021

Meetings
 Date of Meeting                                 In attendance

 22 November 2021                                Joshua Baker (Carcinus)
                                                 Matthew Crabb (Carcinus)
                                                 FSA colleagues
                                                 BCP colleagues

A sanitary survey relevant to the bivalve mollusc beds in Poole Harbour was undertaken in
2009 in accordance with Regulation (EC) 854/2004 (which was replaced by retained EU Law
Regulation (EU) 2017/625, with sanitary survey requirements now specified in retained EU
Law Regulation (EU) 2019/627). This provided appropriate hygiene classification zoning and
monitoring plan based on the best available information with detailed supporting evidence.
In line with regulatory and EU guidance the Food Standards Agency undertake targeted
sanitary survey reviews to ensure public health protection measures continue to be
appropriate. This report provides a review of information and recommendations for a
revised sampling plan if required. Carcinus Ltd. (Carcinus) undertook this work on behalf of
the FSA. Carcinus Ltd accepts no liability for any costs, losses or liabilities arising from the
reliance upon or use of the contents of this report other than by its client.

Dissemination
Food Standards Agency, Bournemouth, Christchurch & Poole Council. The report is publicly
available via the Carcinus Ltd. website.

Recommended Bibliographic Citation:
Carcinus Ltd., 2021. Review of the Poole Harbour 2009 Sanitary Survey. Carcinus report on
behalf of the Food Standards Agency, to demonstrate compliance with the requirements for
classification of bivalve mollusc production areas in England and Wales under retained EU
Law Regulation (EU) 2019/627.

Page | iii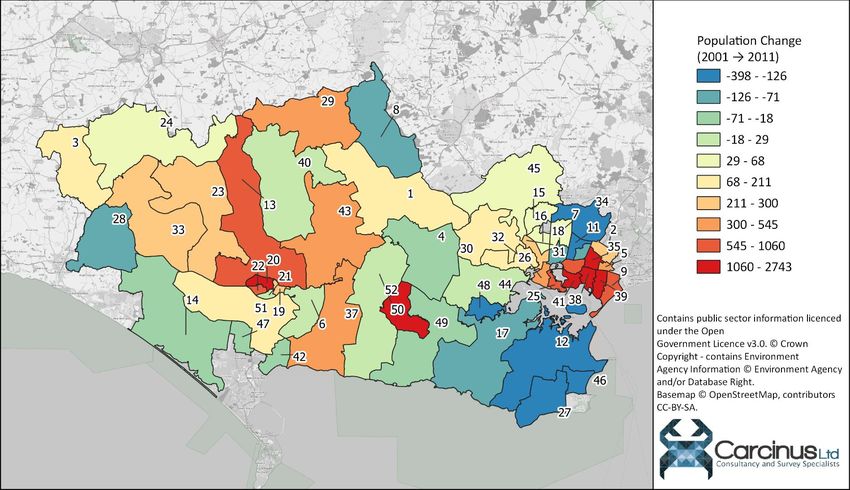
Contents
1     Introduction ........................................................................................................................ 8
    1.1      Background.................................................................................................................. 8
    1.2      Poole Harbour Review................................................................................................. 8
    1.3      Assumptions and limitations ...................................................................................... 9
2     Shellfisheries ..................................................................................................................... 11
    2.1      Description of Shellfishery ........................................................................................ 11
      2.1.1         Cockles ............................................................................................................... 11
      2.1.2         Hard Clams ......................................................................................................... 12
      2.1.3         Mussels .............................................................................................................. 12
      2.1.4         Native oysters .................................................................................................... 12
      2.1.5         Pacific oysters .................................................................................................... 13
      2.1.6         Tapes spp. .......................................................................................................... 13
    2.2      Classification History ................................................................................................. 13
3     Pollution sources .............................................................................................................. 17
    3.1      Human Population .................................................................................................... 17
    3.2      Sewage ...................................................................................................................... 20
    3.3      Agricultural Sources .................................................................................................. 25
    3.4      Wildlife ...................................................................................................................... 30
    3.5      Boats and Marinas..................................................................................................... 31
    3.6      Other Sources of Contamination .............................................................................. 33
4     Hydrodynamics/Water Circulation ................................................................................... 33
5     Rainfall .............................................................................................................................. 33
6     Microbial Monitoring Results ........................................................................................... 35
    6.1      Summary Statistics and geographical variation ........................................................ 35
    6.2      Overall temporal pattern in results........................................................................... 41
    6.3      Seasonal patterns of results ...................................................................................... 44
7     Conclusion and overall assessment .................................................................................. 47
8     Recommendations ............................................................................................................ 48
    8.1      Sampling Plan ............................................................................................................ 48
  8.2 General Information .................................................................................................. 52
Page | iv
8.2.1         Location Reference ............................................................................................ 52
      8.2.2         Shellfishery ......................................................................................................... 52
      8.2.3         Local Enforcement Authority(s) ......................................................................... 52
9     References ........................................................................................................................ 56
Appendices............................................................................................................................... 58
    Appendix I. Breakdown of Population Change.................................................................. 59
    Appendix II.           Details of intermittent discharge Event Duration Monitoring (EDM) data
    for 2020               63
    Appendix III.          Poole Harbour Sanitary Survey Report 2009.............................................. 81
About Carcinus Ltd ................................................................................................................... 82
Contact Us ................................................................................................................................ 82
Environmental Consultancy ..................................................................................................... 82
Ecological and Geophysical Surveys ........................................................................................ 82
Our Vision................................................................................................................................. 82

Page | v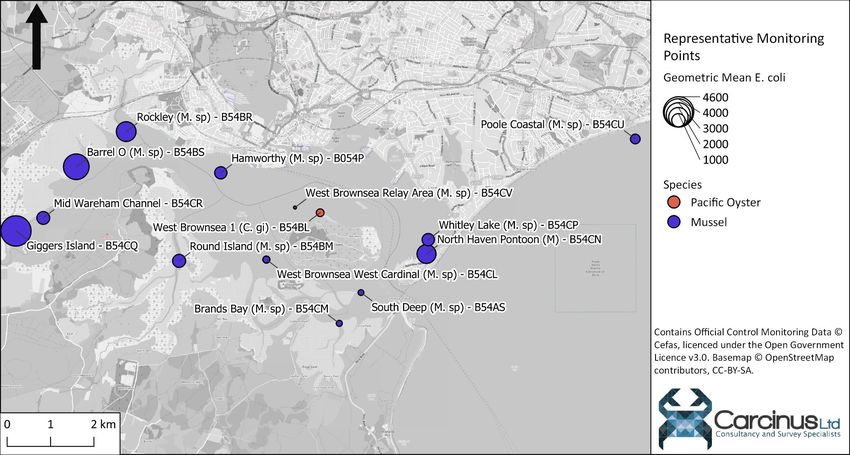
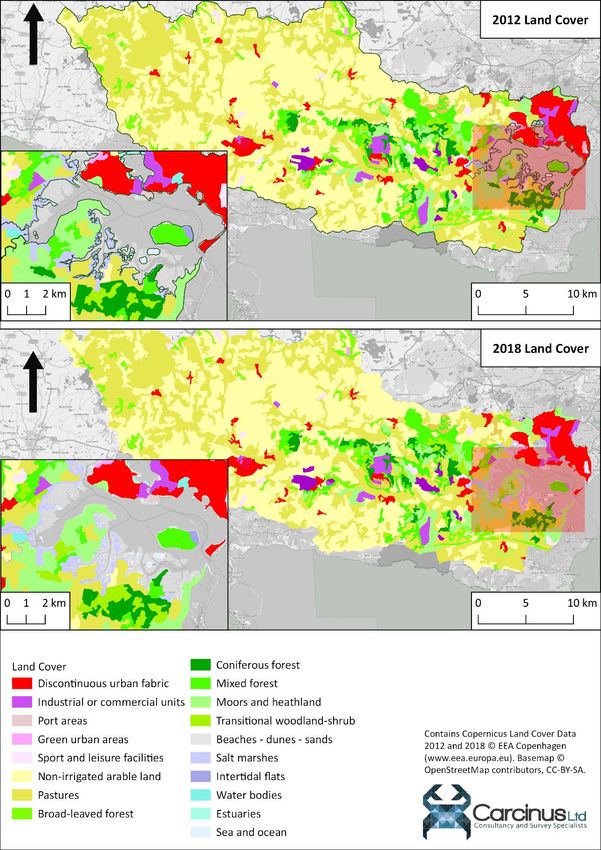
List of figures
Figure 1.1 Location of Poole Harbour. ..................................................................................... 10
Figure 2.1 Current Classification Zones and associated Representative Monitoring Points for
the currently harvested species (A: Cockles; B: M. mercenaria clams; C: Mussels; D: Tapes
spp. clams; E: Native oysters and F: Pacific oysters) within the Poole Harbour BMPA........... 16
Figure 3.1 Human population density in 2001 and 2011 Census Super Output Areas (lower
layer) that intersect the Poole Harbour catchment. ............................................................... 18
Figure 3.2 Population change between the 2001 and 2011 censuses for Wards and Electoral
divisions (based on 2011 boundaries) that are within or partially within the Poole Harbour
catchment. 2001 Census data have been transposed to 2011 wards using the UK Data
Service’s GeoConvert tool (UK Data Service, 2021) to facilitate comparison. Numbers within
wards are identifiers that can be used in combination with Appendix I to provide more detail.
.................................................................................................................................................. 19
Figure 3.3 Locations of all consented discharges in the Poole Harbour catchment. Labels
refer to continuous discharges, details of which can be found in Table 3.1. Details of
intermittent discharges can be found in Appendix II. ............................................................. 24
Figure 3.4 Change in the land cover of the Poole Harbour catchment between 2012 and
2018. ........................................................................................................................................ 26
Figure 3.5 Livestock population change between 2013 and 2016 for Local Authority Districts
wholly or partially contained within the Poole Harbour Catchment. ..................................... 27
Figure 3.6 Locations of moorings, marinas, and other boating activities within Poole
Harbour. ................................................................................................................................... 32
Figure 5.1 Mean daily rainfall (mm) per month for the Frome at East Stoke Total (NGR:
SY867868) for the period (A) 2001 – 2009 and (B) 2010 – 2017. ............................................ 34
Figure 6.1 Geometric mean E. coli results from Official Control Monitoring at bivalve RMPs
within the Poole Harbour BMPA.............................................................................................. 36
Figure 6.2 Boxplots of E. coli levels at mussel RMPs sampled within the Poole Harbour BMPA
2003 – Present. Central line indicates median value, box indicates lower – upper quartile
range and whisker indicates minimum / maximum values excluding outliers (points > 1.5x
the interquartile range). .......................................................................................................... 39
Figure 6.3 Boxplots of E. coli levels at Pacific oyster RMPs sampled within the Poole Harbour
BMPA 2003 – Present. Central line indicates median value, box indicates lower – upper
quartile range and whisker indicates minimum / maximum values excluding outliers (points
> 1.5x the interquartile range). ................................................................................................ 40
Figure 6.4 Timeseries of E. coli levels at mussel RMPs sampled in the Poole Harbour BMPA
2009 – Present. Scatter plots are overlaid with a loess model fitted to the data. .................. 42
Figure 6.5 Timeseries of E. coli levels at Pacific oyster RMPs sampled in the Poole Harbour
BMPA 2003 – Present. Scatter plots are overlaid with a loess model fitted to the data. ....... 43
Figure 6.6 Boxplots of E. coli levels per season at mussel RMPs sampled within the Poole
Harbour BMPA 2003 – Present. ............................................................................................... 45
Page | vi
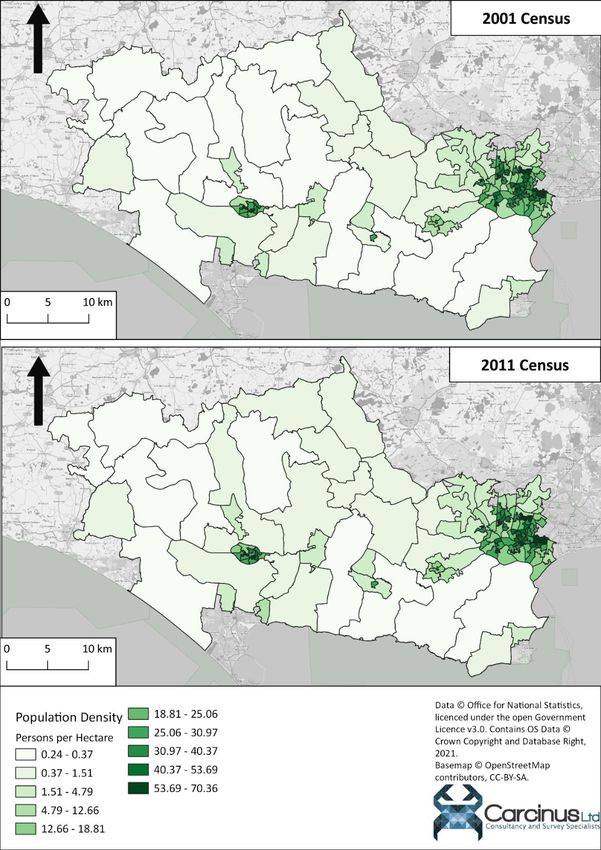
Figure 6.7 Boxplots of E. coli levels per season at Pacific oyster RMPs sampled within the
Poole Harbour BMPA 2003 – Present. ..................................................................................... 46
Figure 8.1 Proposed new oyster classification zone to replace the existing Poole Harbour
North zone for both oyster species. ........................................................................................ 50

List of tables
Table 3.1 Details of continuous discharges in the Poole Harbour catchment. ....................... 21
Table 3.2 Livestock population data for the Poole Harbour catchment between 2013 and
2016. ........................................................................................................................................ 28
Table 5.1 Summary statistics for rainfall before and after the original sanitary survey. ........ 34
Table 6.1 Summary statistics of E. coli (MPN/100 g) from RMPs sampled since the original
sanitary survey. Data was cut off at May 2021. ...................................................................... 37
Table 8.1 Proposed sampling plan for the Poole Harbour BMPA. Suggested changes are
given in bold red type. Struck through text indicates a zone has been superseded by
another..................................................................................................................................... 53

Page | vii
1 Introduction
1.1 Background
In line with Article 58 of retained EU Law Regulation (EU) 2019/627 and the EU Good
Practice Guide (European Commission, 2017), Carcinus is contracted to undertake reviews
of sanitary surveys on behalf of the Food Standards Agency. The FSA undertake targeted
sanitary survey reviews to ensure public health protection measures continue to be
appropriate.
The report considers changes to bacterial contamination sources (primarily from faecal
origin) and the associated loads of the faecal indicator organism Escherichia coli (E. coli) that
may have taken place since the original sanitary survey was undertaken. It does not assess
chemical contamination, or the risks associated with biotoxins. The assessment also
determines the necessity and extent of a shoreline survey based on complexity and risk. The
desktop assessment is completed through analysis and interpretation of publicly available
information, in addition to consultation with stakeholders.

1.2 Poole Harbour Review
This report reviews information and makes recommendations for a revised sampling plan
for existing cockle (Cerastoderma edule), mussel (Mytilus edulis), hard clam (Mercenaria
mercenaria), native oyster (Ostrea edulis), Pacific oyster (Crassostrea gigas) and Tapes spp.
classification zones in Poole Harbour (Figure 1.1). This review explores any changes to the
main microbiological contamination sources that have taken place since the original sanitary
survey was conducted. Data for this review was gathered through a desk-based study and
consultation with stakeholders.
An initial consultation with Local Authorities (LAs) and the Environment Agency (EA)
responsible for the production area was undertaken in April and May 2021. This supporting
local intelligence is valuable to assist with the review and was incorporated in the
assessment process.
Following production of a draft report, a wider external second round of consultation with
LAs and Local Action Group (LAG) members was undertaken in July and August 2021. It is
recognised that dissemination and inclusion of a wider stakeholder group, including local
industry, is essential to sense-check findings and strengthen available evidence. A further
consultation with the LEA was undertaken in November and December 2021 to agree
changes to the sampling plan. The draft report is reviewed taking into account the feedback
received throughout all consultations.
The review updates the assessment originally conducted in 2009 (including the updated
sampling plan of 2012) and sampling plan as necessary and the report should be read in
conjunction with the previous survey.
Specifically, this review considers:
(a) Changes to the shellfishery (if any);
(b) Changes in microbiological monitoring results;
Page | 8
(c) Changes in sources of pollution impacting the production area or new evidence relating
to the actual or potential impact of sources;
(d) Changes in land use of the area; and
(e) Change in environmental conditions;

Sections 2 - 6 detail the changes that have occurred to the shellfishery, environmental
conditions and pollution sources within the catchment since the publication of the original
sanitary survey. A summary of the changes is presented in section 7 and recommendations
for an updated sampling plan are described in section 8.

1.3 Assumptions and limitations
This desktop assessment is subject to certain limitations and has been made based on
several assumptions, namely:
    • Accuracy of local intelligence provided by the Local Authorities and Environment
       Agency
    • The findings of this report are based on information and data sources up to and
       including May 2021;
    • Only information that may impact on the microbial contamination was considered
       for this review;
    • Official Control monitoring data have been taken directly from the Cefas data hub1,
       with no additional verification of the data undertaken. Results up to and including
       May 2021 have been used within this study. Any subsequent samples have not been
       included; and
    • Environment Agency Event Duration Monitoring data has been taken at face value,
       with no additional verification other than linking with the consented discharge
       database.

1
 Cefas shellfish bacteriological monitoring data hub. Available at: https://www.cefas.co.uk/data-and-
publications/shellfish-classification-and-microbiological-monitoring/england-and-wales/.
Page | 9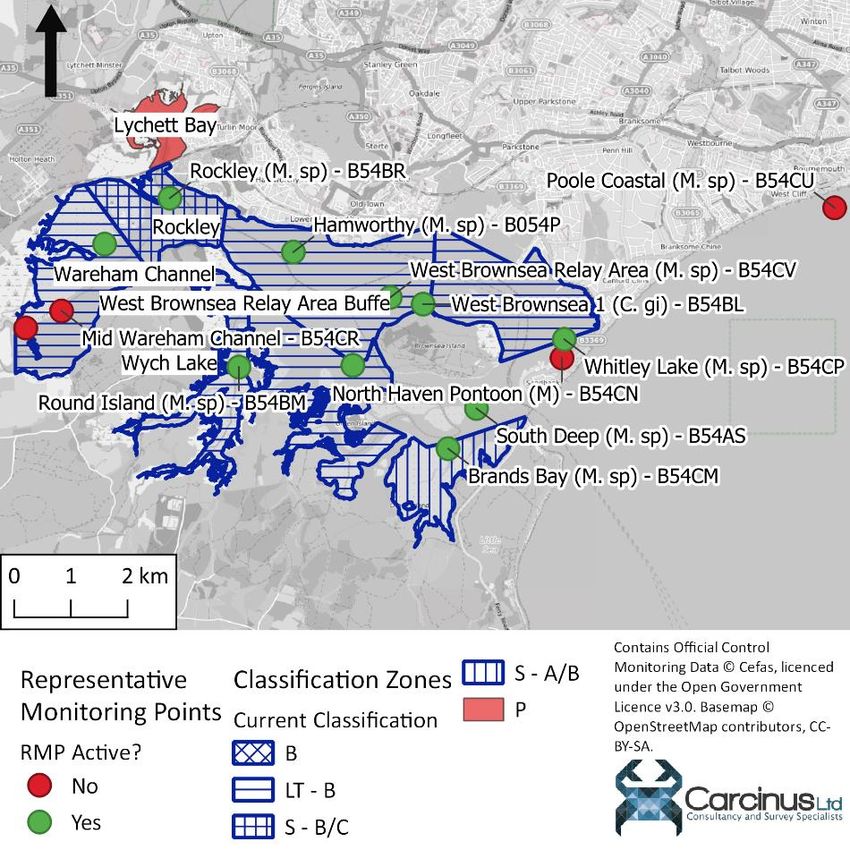
Figure 1.1 Location of Poole Harbour.

Page | 10
2 Shellfisheries
2.1 Description of Shellfishery
Poole Harbour is a large natural harbour located on the south coast of England (Figure 1.1)
and covers an area of approximately 38 km². Harvesting of shellfish within the harbour is
regulated by the Southern Inshore Fisheries and Conservation Authority (SIFCA) under the
Poole Harbour Fishery Order 20152 and byelaws including the Poole Harbour Dredge Permit
Byelaw3 (PHDPB). The Order refers to the southern and western parts of the harbour and
includes the waters north of Brownsea Island. There are some classified areas not within the
Regulated Area, although these are also managed by SIFCA.
The Poole Harbour Bivalve Mollusc Production Area (BMPA) covers the entirety of Poole
Harbour, and from time to time includes areas on adjacent coasts when classifications are
required. There are no other BMPAs particularly near to Poole Harbour; the Solent estuary
lies 47 km to the east and Portland Harbour/Fleet lies about 35 km west. The BMPA involves
both wild culture (principally of cockles and clams) and aquaculture (all harvested species)
and is under the jurisdiction of Bournemouth, Christchurch & Poole Council for food hygiene
purposes (the Local Enforcement Authority (LEA)). The wild fishery is open year-round for
hand-gathering but is seasonally restricted from 25th May to 23rd December each year for
fishermen using a pump scoop dredge (SIFCA, 2021). The aquaculture fishery operates all
year round. The original sanitary survey (conducted in 2009 with a sampling plan updated in
2012) made comprehensive changes to the representative monitoring points (RMPs) and
Classification Zones (CZs). The following paragraphs detail the currently active CZs and stock
assessments (where data are available) for the species harvested in the Poole Harbour
BMPA. The LEA do not hold estimates of current commercial landings for individual
classification zones, however they estimate that the value of harvested shellfish from within
the BMPA is between 1.5 and 2 million pounds (GBP) per year, although it is not clear what
proportion originates from which species. For the 2019/2020 season, the manilla clam
(Tapes spp.) landings were 277.2 tonnes, the cockle landings were 79.8 tonnes and 21.5
tonnes of the other bivalve species were landed (SIFCA, 2021), although it is not clear what
proportion originates from which classification zone.
2.1.1 Cockles
There are currently seven zones classified for cockle harvesting within the Poole Harbour
BMPA, as well as one relay area, and the species is subject to both wild harvest and
aquaculture. All the CZs were proposed in the original sanitary survey. These zones are
Brands Bay, Poole Harbour North, Rockley, SW Brownsea Island, Wareham Channel,
Whiteley Lake, Wych Lake, and the West Brownsea Relay Area. The Poole Coastal zone was

2
  The Poole Harbour Fishery Order 2015. Available at:
https://www.legislation.gov.uk/uksi/2015/1346/introduction/made
3
  The Poole Harbour Dredge Permit Byelaw. Available at:
https://secure.toolkitfiles.co.uk/clients/25364/sitedata/Redesign/Poole_Hrbr_D_Permit/Poole-Hrbr-D-Permit-
Byelaw.pdf
Page | 11
declassified in September 2020, due to a lack of commercial activity. Together, these zones
effectively create one contiguous zone that covers most of Poole Harbour.
The zones are harvested through a combination of hand gathering and pump scoop
dredging, with the latter regulated through permits issued by SIFCA under the PHDPB. SIFCA
conducts annual assessments of the cockle stock within Poole Harbour, and reports from
recent years (SIFCA 2017; 2018; 2019) indicate that the stock is sizeable and stable, and is
greater nearer the mouth of the harbour where sediments are dominated by gravel, rather
than muddy sediments near the freshwater inputs to the west. For the 2019/2020 season,
the landings of this species were 79.8 tonnes (SIFCA, 2021), although it is not clear which
proportion originates from which classification zone.
2.1.2 Hard Clams
Like cockles, hard clams (M. mercenaria) are subject to both wild harvest and aquaculture.
The CZs with active classifications for this species within Poole Harbour are Brands Bay,
Poole Harbour North, Rockley, SW Brownsea Island, Wareham Channel, Whitely Lake and
Wych Lake. Like cockles, the M. mercenaria zones essentially form one large zone that
covers the entire BMPA.
The harvesting methods for M. mercenaria are the same as for cockles, hand gathering and
pump scoop dredging. No stock assessment for this species was available to the authors of
this review.
2.1.3 Mussels
All mussel harvesting from Poole Harbour comes from aquaculture, and there are currently
only three zones classified for this species. These are Poole Harbour North, Rockley and
Wareham Channel, which form one contiguous zone over the northern side of the harbour.
Consultation with the local authority did not indicate any changes to the harvesting method
for this species, which is mechanised hand gathering. No estimate of the output of this
fishery was available to the authors of this review.
2.1.4 Native oysters
Like mussels, all harvesting of native oysters comes from aquaculture, and there are
currently three areas classified for this species (one of which is a relay area). These are Poole
Harbour North, SW Brownsea Island and the South Deep Relay Area. The Poole Coastal CZ
was classified for this species until its declassification in September 2020. Consultation with
the LEA indicated that the South Deep Relay Area is no longer used and cannot be used as a
production area due to environmental protections. The LEA stated they may look to
declassify this area.
Consultation with the local authority did not indicate any changes to the harvesting method
for this species, which is mechanised hand gathering. No estimate of the output of this
fishery was available to the authors of this review.

Page | 12
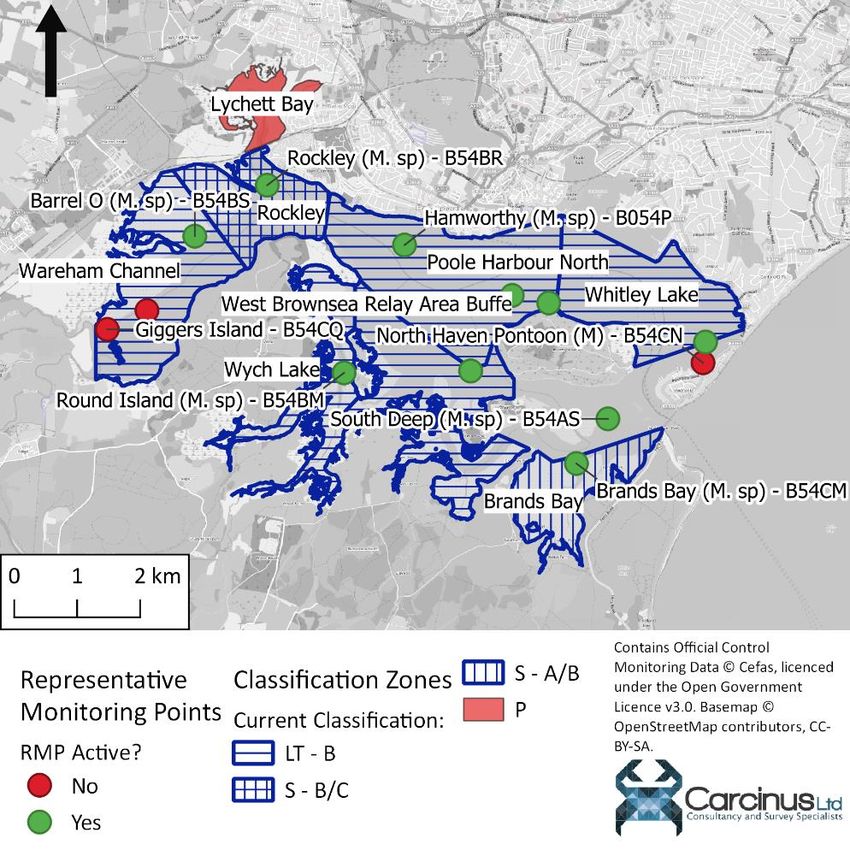
2.1.5 Pacific oysters
All harvesting of this species is from aquaculture and it, along with mussels, is the most
significant aquaculture species in Poole Harbour in terms of output. Furthermore, Poole
Harbour is the largest Pacific oyster production area in England (Williams & Davies, 2018).
However, there are currently only two zones classified for this species, Poole Harbour North
and SW Brownsea Island.
Consultation with the local authority did not indicate any changes to the harvesting method
for this species, which is mechanised hand gathering. No estimate of the output of this
fishery was provided by the LEA, however the Williams and Davies (2018) study indicates
that the output is between 300 and 400 tonnes per year.
2.1.6 Tapes spp.
Like cockles and hard clams, Tapes spp. are harvested from both wild and cultured stocks
within Poole Harbour. There are currently seven zones classified for this species in the Poole
Harbour BMPA, these are Brands Bay, Poole Harbour North, Rockley, SW Brownsea Island,
Wareham Channel, Whitley Lake and Wych Lake. Like cockles and M. mercenaria clams,
these zones form one large contiguous zone that covers much of Poole Harbour.
The harvesting methods for this species are hand gathering and pump scoop dredge, which
is regulated through permits issued by SIFCA under the PHDPB. SIFCA conducts annual
assessments of the manilla clam stock within Poole Harbour, and reports from recent years
(SIFCA 2017; 2018; 2019) indicate that the stock is sizeable and stable, and is greater in the
western reaches of the harbour, near the riverine inputs where the sediments are more
mud-dominated. The main stock areas, around Wareham Channel, were also found to
contain a large number of undersized individuals (SIFCA, 2019). The authors of that stock
assessment believed this to be due to the high level of fishing activity in that area,
particularly during the early part of the mechanical fishing season (which runs from April to
December).

2.2 Classification History
The sampling plan recommended by the original sanitary survey in 2012, created a total of
20 zones for the various classified species; seven for cockles, six for Tapes spp., three for
native oysters and two each for mussels and Pacific oysters. This has increased to 28; seven
each for cockles, M. mercenaria and Tapes spp. clams, three for mussels, three for native
oysters and two for Pacific oysters. In addition, there are two designated relay areas, one
each for native oysters and cockles.
The location of all active CZs in the Poole Harbour BMPA are shown in Figure 2.1. Most CZs
hold Class LT-B classifications, although Brands Bay near the mouth of the harbour holds a
Seasonal A/B classification, and Rockley on the north-western side of the harbour holds a
Seasonal B/C classification.

Page | 13
A: Cockles   B: M. mercenaria

Page | 14
C: Mussels   D: Tapes spp.

Page | 15
E: Native oyster                                                        F: Pacific oyster

Figure 2.1 Current Classification Zones and associated Representative Monitoring Points for the currently harvested species (A: Cockles; B: M.
mercenaria clams; C: Mussels; D: Tapes spp. clams; E: Native oysters and F: Pacific oysters) within the Poole Harbour BMPA.
Page | 16
3 Pollution sources
3.1 Human Population
The original sanitary survey cites population data from the 2001 Census of the United
Kingdom. Since the publication of that document, the data from the subsequent full census
of 2011 has been made available, and so this data has been compared to that of the 2001
census to give an indication of the changes in human population within the catchment.
These censuses have been used as no further population data are freely available 4. Changes
in human population densities in census Super Output Areas (lower layer) and total
population within wards wholly or partially contained within the Poole Harbour catchment
between the 2001 and 2011 censuses are shown in Figure 3.1 and Figure 3.2.
In general, population density has increased across the entire catchment, with more than
two thirds of wards showing an increase in population size (and therefore density).
However, population densities in general remains fairly low (12.17 persons/hectare), with
more than 50% of wards having a population density of < 5 persons per hectare. The main
population centres remain in Poole on the northern side of the harbour, and Dorchester, in
the upper reaches of the catchment. At detailed breakdown of population change for
individual wards is shown in Appendix I.
At the 2001 census, the total resident population within wards wholly or partially contained
within the Poole Harbour catchment was 239,231. By the time of the 2011 census, this had
increased to 254,490, an increase of 6.38%. The population data for the 2011 census was
collected two years after the original sanitary survey was conducted, and so could be
considered more relevant to that document. Whilst the full results of the March 2021
census have not been published, the UK government estimates that the national population
will have increased 6.6% between 2011 and 2021 (ONS, 2018). An increase of this
proportion would see the approximate population residing within the Poole harbour
catchment increase to 271,286 people. The potential for urban runoff remains highest from
the town of Poole on the north side of Poole Harbour. Impacts from sewage discharges will
depend on the specific nature and locations of such discharges, changes to which are
discussed in the next section. Consultation with the LEA indicated that there is a proposed
housing development on waterfront sites in Holes Bay, contamination from which would
likely drain to the Poole Harbour North and Whitley Lake zones, were it not captured by the
wastewater treatment network (WWTW). Furthermore, without upgrades to the WWTW,
any increase in population would almost certainly lead to an increase in the loading to the
WWTW and would therefore potentially cause increased bacterial loading to coastal waters.
The original sanitary survey does not present tourism statistics for the catchment, however
Poole Harbour is a popular tourist destination. Precise tourism statistics for recent years are
not available, although it is likely that the maximum increase in population (and therefore

4
 Note – a full census of the United Kingdom was conducted in March 2021, although the data from this census
are not yet available.
Page | 17
loading to the WWTW network will occur during the summer months. It is assumed
however that the existing capacity accommodates this increase.

Figure 3.1 Human population density in 2001 and 2011 Census Super Output Areas (lower
layer) that intersect the Poole Harbour catchment.

Page | 18
Figure 3.2 Population change between the 2001 and 2011 censuses for Wards and Electoral divisions (based on 2011 boundaries) that are within or
partially within the Poole Harbour catchment. 2001 Census data have been transposed to 2011 wards using the UK Data Service’s GeoConvert tool
(UK Data Service, 2021) to facilitate comparison. Numbers within wards are identifiers that can be used in combination with Appendix I to provide
more detail.
Page | 19
Whilst there is no recently available population data for the catchment, it is likely that the
human population will have increased by a small percentage since the last sanitary survey
was conducted. However, the distribution of main population centres within the catchment
has not changed, and as such the recommendations for RMP location are still valid.

3.2 Sewage
Details of all consented discharges in the Poole Harbour catchment were taken from the
most recent update to the EA’s national permit database at the time of this report (April
2021). The locations of these discharges are shown in Figure 3.3.
The original sanitary survey only provides the details of seven continuous discharges that
the authors identified as those with the greatest potential to impact the bacteriological
health of the BMPA. All these discharges are still active, although the Brownsea Island STW
is not water company owned and so is represented in Figure 3.3 as a private discharge to
water. Furthermore, the Holton Heath STW which discharged continuously at a rate of 182
m³/day at the time of the original sanitary survey, is currently listed as an intermittently
discharging storm overflow (that did not spill at all during 2020 (Appendix II). The consented
discharge rate for the other works have remained the same, except for Corfe Castle STW
which now has a consented rate of 285 m³/day, down from 370 m³/day. The treatment
methodologies have also all remained the same, with the three highest rates (Poole STW,
Wareham STW and Lytchett Minster STW) having UV treatment, which significantly reduces
the risk that these discharges present to the shellfishery. Initial consultation with the EA
indicated that Corfe Castle STW will have UV treatment fitted during AMP7, with a deadline
of September 2021. Secondary consultation revealed that as of 30th September 2021, this
STW would have UV disinfection in place, which would significantly reduce the
bacteriological contamination from this discharge.
In addition to the continuous discharges, the original sanitary survey identified a total of 22
intermittent discharges with the potential to impact the BMPA. Intermittent discharges
comprise Combined Storm Overflows (CSOs), Storm Tank Overflows and Pumping Station
Emergency Overflows. During AMP6 and AMP7, Event Duration Monitoring (EDM) was
installed at the majority of the intermittent discharges within the Harbour, and summary
data for 2020 was published by the Environment Agency in March 2021 (Environment
Agency, 2021). Details of these data for those discharges in vicinity of the estuary are
presented in Appendix II. The permit numbers for each discharge were used to join this
dataset to the consented discharge database described in the previous paragraph. These
data have been taken at face value, and some locations in the consented discharge database
may be erroneous, meaning that the point appears in the wrong location. Some EDM
returns had multiple meters on a single discharge activity, in this case we have presented all
reported spill counts as individual values, unless the comment indicates that the meters
were not working properly in which case the value was nulled. The EDM returns ‘Activity
Reference’ field did not reliably distinguish between emergency overflows and storm
overflows, therefore we have included all of these in the intermittent discharge category.
Page | 20
The original sanitary survey presents EDM data for four storm overflows within the Poole
Harbour catchment. All four discharges spilled more frequently in 2020 than during the
period considered by the authors of the original sanitary survey, indicating that the
proximity of intermittent discharges needs to be given greater weighting in the
development of a new sampling plan.
Finally, the original sanitary survey does not present the locations of any private (not water
company owned) discharges, although it does state that the discharges are small (
ID   Sewage      Permit   Permit    Consent      NGR        Treatment    DWF
      Treatment   Number   Version   Active
      Works

  6   CORFE       041324      6      29/06/2015   SY 96096 BIOLOGICAL         285
      CASTLE                                       83153   FILTRATION
      STW
  7   DORCHEST    401050      5      31/03/2010   SY 70970 CHEMICAL -      9450
      ER (LOUDS                                    90360   PHOSPHATE
      MILL) STW                                            STRIPPING
  8   EAST        040109      2      01/01/2010   SY 87760 BIOLOGICAL           11
      STOKE                                        87000   FILTRATION
      SEWAGE
      TREATMEN
      T WORKS
  9   EVERSHOT    042453      5      31/03/2018   ST 57828 BIOLOGICAL         146
      WASTEWA                                      04359   FILTRATION
      TER
      TREATMEN
      T WORKS
 10   GODMANS     401521      2      01/04/2009   SY 66590   ACTIVATED          35
      TONE STW                                     96430     SLUDGE
 11   HARMANS     040111      4      31/03/2010   SY 97470   TERTIARY           75
      CROSS                                        80790     BIOLOGICAL

 12   HIGHER      050921      1      08/09/1983   ST 76740 BIOLOGICAL
                                                                           Unspecified

      ANSTY                                        04140   FILTRATION
      SEWAGE
      TREATMEN
      T WORKS
 13   LYTCHETT    401242      4      01/04/2010   SY 96850 UV              1600
      MINSTER                                      92300   DISINFECTIO
      STW                                                  N
 14   MAIDEN      041353      6      31/03/2020   SY 60253 BIOLOGICAL         318
      NEWTON                                       97176   FILTRATION
      WATER
      RECYCLING
      CENTR

Page | 22
ID Sewage Permit Permit Consent NGR Treatment DWF
Treatment Number Version Active
Works
15 MILBORNE 042116 4 31/03/2010 SY 80250 BIOLOGICAL 423
ST.ANDRE 96490 FILTRATION
W
16 PIDDLEHIN 040067 4 31/03/2010 SY 72170 TERTIARY 295
TON 96310 BIOLOGICAL
17 POOLE E 401354 9 14/09/2012 SZ 00710 UV 47700
STW 93560 DISINFECTIO
N
18 PUDDLETO 402100 4 30/06/2013 SY 75060 BIOLOGICAL 285
WN 94930 FILTRATION
SEWAGE
TREATMEN
T WORKS
19 STUDLAND 041570 4 31/03/2010 SZ 02350 BIOLOGICAL 227
STW 84540 FILTRATION
20 SYDLING 401025 4 14/02/2020 SY 63201 BIOLOGICAL 86
ST.NICHOL 98437 FILTRATION
AS WRC
21 TOLLER 400607 6 14/02/2020 SY 56698 BIOLOGICAL 77
PORCORU 97970 FILTRATION
M WRC
22 WAREHAM 401336 5 26/01/2017 SY93640 UV 2502
WASTEWA 88630 DISINFECTIO
TER N
TREATMEN
T WORKS
23 WOOL STW 401747 3 31/03/2010 SY82450 CHEMICAL - 2205
87380 PHOSPHATE
STRIPPING
Page | 23Figure 3.3 Locations of all consented discharges in the Poole Harbour catchment. Labels refer to continuous discharges, details of which can be found in Table 3.1. Details of intermittent discharges can be found in Appendix II. Page | 24
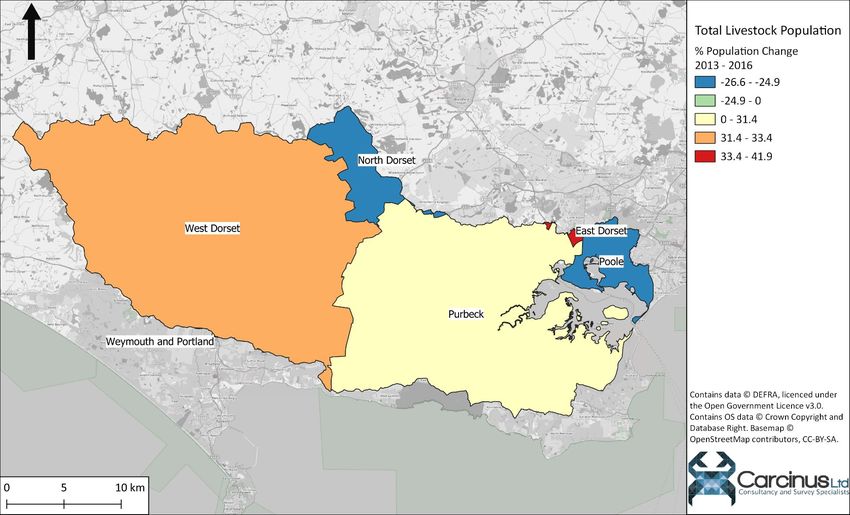
3.3 Agricultural Sources
The original sanitary survey does not explicitly state livestock population data for the time
that the survey was conducted, although it does state that there are areas of pasture to the
south and west, comprising several beef and dairy farms. Analysis of land cover data from
2013 and 2018 (Figure 3.4) indicates that these areas of pasture remain in place. Grazing
areas immediately adjacent to shorelines represent a potentially significant source of
microbiological contamination to shellfisheries. At the time of the original sanitary survey,
the Environment Agency was not aware of any issues from these farms and initial
consultation for this review did not indicate any.
Livestock data for Local Authority Districts that fall within or partially within the Poole
Harbour catchment were available for 2013 and 2016 (DEFRA, 2018). These data have been
used to give an indication of livestock population trends in the period since the original
sanitary was published. As only a small proportion of some of the districts falls within the
catchment, the livestock data have been adjusted to reflect the % of each district that falls
within the catchment. This assumes that livestock are distributed uniformly throughout the
district, and therefore, some inaccuracies may be present. Aggregate adjusted livestock
population change data are shown in Figure 3.5 and Table 3.2.
Overall, livestock populations decreased by 7.87% between 2013 and 2016, though within
this overall statistic are notable differences between both districts and species. The East and
West Dorset districts saw increases of 41.87% and 33.36% respectively, whereas the
Bournemouth, Poole and Christchurch district saw a fall of more than 25%. Across all
districts, cattle and sheep populations remained relatively stable, increasing by 1.76% and
5.64% respectively. However, the pig population fell by nearly 29% and the poultry
population increased by 24.25%. The poultry population remains the largest by population
size, estimated to be at more than 190,000 animals in 2016. Across all groups of animals,
the livestock population will vary throughout the year, with the highest numbers occurring
during Spring and lowest numbers when animals are sent to market in Autumn and Winter.
Despite the populations of some groups and in some districts increasing dramatically,
livestock populations have fallen across the catchment and the density of livestock remains
fairly low at just above 4 animals per hectare. However, the probable routes of
contamination remain unchanged. As such, the recommendations made in the original
sanitary survey to capture this source of pollution remain valid.

Page | 25
Figure 3.4 Change in the land cover of the Poole Harbour catchment between 2012 and
2018.

Page | 26
Figure 3.5 Livestock population change between 2013 and 2016 for Local Authority Districts wholly or partially contained within the Poole
Harbour Catchment.
Page | 27
Table 3.2 Livestock population data for the Poole Harbour catchment between 2013 and 2016.

                                                                                 Cattle Population        Sheep Population             Pig Population         Poultry Population

                                                              % Of Catchment
                                 Catchment (Ha)
 Local Authority

                                  Area Within

                                                  Catchment
                                                   % Within
     District

                                                                               2013    2016      %      2013     2016      %      2013    2016     %        2013     2016       %

                                                                   Area
                                                                                               Change                    Change                  Change                       Change
 Poole (as Poole, Christchurch
       & Bournemouth)

                                 3,047.17         18.89%       3.69%           342     312     -8.81%    0         0     0.00%     0        0      0.00%     83        0      -100.00%
 Dorset
  East

                                  152.15          0.43%        0.18%            39      38     -4.89%    36       41     13.98%    5        25    412.06%    590      847     43.59%
 Dorset
 North

                                 3,737.81         6.13%        4.53%           3,131   2,920   -6.72%   2,728    3,056   12.06%   377      455    20.82%    81,518   59,425   -27.10%

Page | 28
Cattle Population Sheep Population Pig Population Poultry Population
% Of Catchment
Catchment (Ha)
Local Authority
Area Within
Catchment
% Within
District
2013 2016 % 2013 2016 % 2013 2016 % 2013 2016 %
Area
Change Change Change Change
Purbeck
31,773.46 78.57% 38.49% 16,163 17,450 7.96% 20,198 22,374 10.77% 1,436 631 -56.06% 40,910 50,058 22.36%
Dorset
West
43,826.61 39.01% 53.09% 38,977 38,967 -0.03% 46,904 48,337 3.05% 20,675 14,909 -27.89% 29,816 79,662 167.18%
and Portland
Weymouth
11.12 0.01% 0.01% 10 10 -0.03% 12 12 3.05% 5 4 -27.89% 8 20 167.18%
TOTAL
82,548.32 31.12% 100.00% 58,662 59,696 1.76% 69,878 73,820 5.64% 22,498 16,024 -28.78% 152,924 190,011 24.25%
Page | 293.4 Wildlife
As a result of its variety of natural habitats and the wildlife these habitats support, Poole
Harbour and surrounding areas are conferred protection under a variety of statutory and
non-statutory designations, including as a Special Protection Area (SPA) under the EU Birds
Directive and as a Site of Special Scientific Interest (SSSI).
These designations are in part due to the significant populations of overwintering
waterbirds. Waterbirds represent a potentially significant source of faecal contamination to
BMPAs as they typically forage for food (and defecate) on shellfish beds. The original
sanitary survey does not report a five-year average of overwintering birds, however the
Wetland Bird Survey of 2009/10 (Holt et al., 2011) gives a five-year average of 22,847 birds,
including large populations of Brent Goose, Shelduck and Avocets. The most recently
available survey, (2019/20, (Frost et al., 2021)) gives a five-year average of 25,042 birds, an
increase of 9.6% on the 2009/10 five-year average, although the dominant species remain
the same. Owing to the importance of Poole Harbour for these species and the areas’
designation as an SPA, SIFCA conduct an annual assessment of the interaction between
shellfish dredging activity and important habitats for waterbirds with a view to informing
the issuing of permits under the Poole Harbour Dredge Permit Byelaw (PHDPB). As a result
of these assessments, dredging is prohibited in a number of bird sensitive areas, mainly in
the channels and lakes on the north and south side of the harbour (SIFCA, 20205). Whilst
there are hotspots of bird activity within the BMPA, the precise distributions of the birds will
vary year-on-year as they forage for prey. As such, it is difficult to define RMP positions to
accurately capture this source of pollution, except for Barrel O (B54BS), which was
deliberately located due to the proximity of black-headed gull nests on the small saltmarsh
islands in Wareham Channel.
There is no major grey or harbour seal colony in Poole Harbour, and although grey seals are
occasionally observed foraging, they are unlikely to be a significant source of contamination
and do not require consideration in any updated sampling plan. There remains a large
population of feral sika deer (Cervus nippon) in Purbeck, which may contribute to
background levels of faecal contamination, given that their grazing areas often extends to
the shoreline.
Waterbird populations are the main group likely to contribute significant amounts of
bacteriological contamination to the BMPA, although it remains challenging to account for
the pollution from wildlife in any updated sampling plan, due to the spatial and temporal
variability of the pollution source. Dredging in the priority habitat areas for this species is
prohibited under the PHDPB, reducing the risk of contaminated shellfish, but no further
recommendations can be made to account for this source of pollution.
5
Map cannot be reproduced for copyright purposes but can be found on p72 of the SIFCA report cited.
Page | 303.5 Boats and Marinas
The discharge of sewage from boats is a potentially significant source of bacterial
contamination of shellfisheries within the Poole Harbour BMPA. Boating activities within the
harbour have been derived through analysis of satellite imagery and various internet
sources and compared to that described in the original sanitary survey. Their geographical
positions are presented in Figure 3.6.
Poole Harbour is extremely popular with recreational boat users/owners; the original
sanitary survey describes that there are 2500 swinging moorings, and whilst the current
number is around 2000 (PHC, 2021b), this still represents a very large number of yachts
using the waters of the BMPA each year and the moorings are still in the same areas. The
original sanitary survey describes a local byelaw prohibiting marine toilet disposal within the
harbour. No details of this byelaw could be found, although Poole Harbour Commissioners
(PHC) discourage the practice (PHC, 2021a). Furthermore, pump out facilities are located at
Poole Harbour and Poole Quay Boat Haven, which should reduce the risk of contamination
originating from recreational boat users.
In addition to the recreational boating activity, there is a significant amount of commercial
shipping within Poole Harbour. The most recent update to the UK Governments Fishing
Vessel Lists (gov.uk, 2021) lists Poole as the home port for a total of 63 vessels (60 10 m) and the administrative port for 220 vessels (210 10 m). Furthermore, the
Port of Poole can receive vessels of up to 210 m in length and handles a variety of freight as
well as passenger ferries and cruise ships. The deep-water facilities at Poole were opened in
2018 (PHC, 2021c), which may have increased the commercial shipping traffic operating
moving in and out of the harbour, however commercial vessels are prohibited from making
overboard discharges within 3 nm of land6, limiting the risk of this source of contamination.
No changes have occurred to either the main areas of shipping activity, or the probable
magnitude of any overboard discharges, given that release of sewage by vessels is either still
prohibited (in the case of commercial vessels) or strongly discouraged (in the case of
recreational boats). The original sanitary survey did not make recommendations for its
sampling plan to capture this source of pollution, and given the lack of changes likely to
increase the risk, no additional weighting is warranted from this review.
6
The Merchant Shipping (Prevention of Pollution by Sewage and Garbage) Regulations 2008.
Page | 31Figure 3.6 Locations of moorings, marinas, and other boating activities within Poole Harbour. Page | 32
3.6 Other Sources of Contamination
Urban fabric within the catchment remains centred on the northern side of Poole Harbour
in the form of Poole. Another urban centre, Dorchester, is located in the upper reaches of
the catchment. The settlements nearer to waterbodies remain a greater risk of diffuse
microbiological contamination through utility misconnections and dog fouling. The
geographical extent of urban settlements within the catchment have not increased
significantly since the original sanitary survey was published (Figure 3.43.4), despite new
housing developments near Holes Bay as indicated by the LEA, and therefore the risk that
these settlements pose remains broadly similar.
Poole Harbour has several signposted walks that circumnavigate the BMPA, whilst the paths
run some distance from the shoreline on the south side, the pass along the coastline on the
north side (pooleharbourtrails.org.uk, 2021), and so there may be some impact from dog
fouling in the nearshore zone. The extent of this source of pollution is not assessed to have
changed significantly since the original survey was published.
No evidence of significant changes to these sources of contamination exists. Therefore, it
can be assumed that the RMP location recommendations made in the original sanitary
survey will still capture the influence of these sources.

4    Hydrodynamics/Water Circulation
The original sanitary survey does not present any bathymetric data or admiralty charts for
the BMPA. Briefly, the Harbour contains a deeper channel on the northern side of Brownsea
island which facilitates access to the marinas and ports located around Poole. On the
southern side of the harbour, water depths are shallower and sand banks are common.
Poole Harbour Commissioners conduct maintenance dredging to maintain the depths of
navigation channels.
Tidal circulation is the main force controlling water circulation in the Harbour, with
strongest flows (and therefore dispersal of contamination) near the Harbour entrance and
main channels. In the periphery of the harbour flows are much lower, less than 0.2 m/s.
Contamination from shoreline sources nearer the entrance will be dispersed fairly rapidly,
although contamination from sources nearer the riverine inputs will be dispersed more
slowly.
It is considered unlikely that the hydrodynamics of Poole Harbour will have changed
significantly and as such, the recommendations made in the original sanitary to account for
water circulation remain valid.

5 Rainfall
Rainfall data for the Frome at East Stoke Total monitoring station (NGR: SY867868) from
2001 – 2009 (pre sanitary survey) and 2010 – 2017 (post sanitary survey) were taken from

Page | 33
the National River Flow Archives (NRFA)7 (NRFA, 2021) and processed in R (R Core Team,
2020) usin the ‘rnrfa’ package (Vitolo, 2016). These data were used to determine whether
any changes in rainfall patterns had occurred since the original sanitary survey. The
monitoring results are summarised in Table 5.1, and Figure 5.1Figure 5.15.1 shows the
average daily rainfall totals each month at the East Stoke Total monitoring station.
Whilst rainfall has increased slightly since the original sanitary survey was published, two
sample t-tests indicated that there was no significant difference (p = 0.785) between the
mean daily rainfall per month between the 2001 – 2009 and the 2010 – 2017 periods.
Table 5.1 Summary statistics for rainfall before and after the original sanitary survey.

    Period             Mean Annual Rainfall (mm) % Dry Days              % Days > 10 mm % Days > 20 mm

    2001 - 2009                   1052.20                   42.96              29.24                17.61
    2010 - 2017                   1055.29                   39.49              30.18                17.71

Figure 5.1 Mean daily rainfall (mm) per month for the Frome at East Stoke Total (NGR:
SY867868) for the period (A) 2001 – 2009 and (B) 2010 – 2017.

Rainfall leads to increased faecal loading through two factors; elevated levels of surface
runoff and spill events from intermittent discharges. However, as the rainfall patterns have

7
    Note – Catchment Daily Rainfall data is only available up to 2017 for monitoring stations on the NRFA.
Page | 34
remained consistent across the two time periods, significantly increased bacterial loading due to these factors are unlikely and as such RMP recommendations made in the original sanitary survey to capture the influence of runoff and spill events remain valid. 6 Microbial Monitoring Results 6.1 Summary Statistics and geographical variation There is a total of 15 RMPs that have been sampled within the Poole Harbour BMPA since the original sanitary survey was published. Thirteen of these are for mussel (Mytilus edulis) and two are for Pacific oyster (Crassostrea gigas). These two species are used to classify CZs for all the harvested species. Of these RMPs, six were sampled prior to the original sanitary survey, sampling at four began in 2012 (following the agreement of the sampling plan from the original sanitary survey), at one point in 2015, 2018 and 2019 and at two more in 2016. Only four of these RMPs are no longer sampled, Poole Coastal (B54CU) is no longer sampled due to the areas declassification in September 2020, and the other RMPs are no longer used due to a lack of stock. The geometric mean results of Official Control Monitoring for all RMPs sampled since 2003 (that have had a sample taken in the last 5 years) are presented in Figure 6.1 and summary statistics are presented in Table 6.1. All data have been taken directly from the Cefas datahub1 and have been taken at face value. There are sizable differences in geometric mean E. coli levels at RMPs within the BMPA, with most having a fairly low mean, and one (West Brownsea Relay Area (B54CV)) falling below the Class A threshold of 230 MPN/100 g. However, a few RMPs have notably higher mean results, with four RMPs (Rockley (B54BR), Barrel ‘O’ (B54BS), Gigger’s Island (B54CQ) and North Haven Pontoon (B54CN)) have mean E. coli results of approximately 2,000 MPN/100 g or above. There does appear to be some geographical trend to the pattern of mean E. coli observed, with RMPs closer to the periphery of the Harbour, particularly at the western end, returning higher mean E. coli. There is only one example of a RMP co-located for both sampled species (West Brownsea Relay Area (B54CK & B54CL)), and in that instance the mean results are very similar (375.57 and 350.94 respectively). Figure 6.2 and Figure 6.3 present boxplots of E. coli monitoring results from mussel and Pacific oyster RMPs respectively. One-way analyses of variance (ANOVA) tests were performed on the data to investigate the statistical significance of any differences between monitoring results from the various RMPs. All statistical analysis described in this section was undertaken in R (R Core Team, 2020). These tests revealed that Barrel ‘O’ (B54BS) returned significantly higher monitoring results than Hamworthy (B054P) (p < 0.00001), South Deep (B54AS) (p < 0.00001), Round island (B54BM) (p < 0.0001), Rockley (B54BR) (p = 0.034), West Brownsea West Cardinal (B54CL) (p < 0.001), Brands Bay (B54CM) (p < 0.001) and Whitley Lake (B54CP) (p = 0.028). Results from all RMPs show large variance, which could explain why no further significant differences were found in the data despite some visual differences in both the geometric means (Figure 6.1) and medians (Figure 6.2). No significant difference was found between the two Pacific oyster RMPs (p = 0.8). Page | 35
Figure 6.1 Geometric mean E. coli results from Official Control Monitoring at bivalve RMPs within the Poole Harbour BMPA.

Page | 36
Table 6.1 Summary statistics of E. coli (MPN/100 g) from RMPs sampled since the original sanitary survey. Data was cut off at May 2021.

                                                                                                          E. coli (MPN/100 g)
     ID     Site (Species)        NGR         Species      No.     First       Last      Geometric    Min       Max      %>      %>    %>
                                                                  Sample      Sample       Mean      Value     Value     230    4,600 46,000
          Hamworthy (M.
 1                             SY99528963     Mussel       211   14/01/2003 11/05/2021     868.43      18    35,000    48.82    2.84      0.00
          sp) - B054P
          South Deep (M.
 2                             SZ02758687     Mussel       194   08/04/2003 11/05/2021     292.57      18     9,200    19.59    1.55      0.00
          sp) - B54AS
          West Brownsea 1
 3                             SZ01818871 Pacific Oyster   185   16/11/2005 11/05/2021     413.47      18     9,200    32.43    2.16      0.00
          (C. gi) - B54BL
          Round Island (M.
 4                             SY98568760     Mussel       213   11/02/2003 11/05/2021     970.40      18    16,000    58.22    5.16      0.00
          sp) - B54BM
          Rockley (M. sp) -
 5                             SY97349058     Mussel       197   29/01/2003 13/04/2021    2068.72      20    54,000    73.10    7.61      1.02
          B54BR
          Barrel O (M. sp) -
 6                             SY96198977     Mussel       199   29/01/2003 11/05/2021    3359.34      18    160,000   83.42    13.07     1.01
          B54BS
          West Brownsea
 7        West Cardinal (C.    SZ00578763 Pacific Oyster   107   04/04/2012 11/05/2021     375.57      18     9,200    32.71    0.93      0.00
          gi) - B54CK
          West Brownsea
 8        West Cardinal (M.    SZ00578763     Mussel       106   04/04/2012 11/05/2021     350.94      18     3,500    32.08    0.00      0.00
          sp) - B54CL
          Brands Bay (M.
 9                             SZ02258616     Mussel       102   16/05/2012 13/04/2021     307.76      18     5,400    24.51    0.98      0.00
          sp) - B54CM
          North Haven
 10       Pontoon (M) -        SZ04268776     Mussel       55    04/04/2012 02/08/2016    1920.18     130    17,000    80.00    12.73     0.00
          B54CN

Page | 37
E. coli (MPN/100 g)
ID Site (Species) NGR Species No. First Last Geometric Min Max %> %> %>
Sample Sample Mean Value Value 230 4,600 46,000
Whitley Lake (M.
11 SZ04308809 Mussel 68 04/06/2015 11/05/2021 878.13 18 24,000 26.47 2.94 0.00
sp) - B54CP
Giggers Island -
12 SY94808829 Mussel 2 01/11/2016 07/02/2017 4600.00 1300 7,900 100.00 50.00 0.00
B54CQ
Mid Wareham
13 SY95438859 Mussel 2 01/11/2016 07/02/2017 945.00 490 1,400 100.00 0.00 0.00
Channel - B54CR
Poole Coastal (M.
14 SZ09079041 Mussel 19 11/10/2018 10/12/2019 589.68 18 2,700 63.16 0.00 0.00
sp) - B54CU
West Brownsea
15 Relay Area (M. sp) SZ01238883 Mussel 24 05/02/2019 13/04/2021 215.00 18 780 25.00 0.00 0.00
- B54CV
Page | 38You can also read