HISPANIC ENTREPRENEURSHIP IN NEW ORLEANS
←
→
Page content transcription
If your browser does not render page correctly, please read the page content below
HISPANIC
ENTREPRENEURSHIP IN
NEW ORLEANS
Abstract

This report examines the current conditions and needs of Latino entrepreneurs in New Orleans. Through
surveys, interviews, testimonies, and observations from interactions with the Latino community gathered
from January to August 2019, the report aims to identify key challenges for businesses and gaps with the
current support available for businesses. Our findings attempt to provide guidance for community partners
to design appropriate and effective business support programming for the Latino community.

Table of Contents
Introduction

   1. Research Context: The Hispanic Community of New Orleans

   2. Stakeholder Analysis: Existing Organizations and Community Partners in the Hispanic Community

   3. Research Questions and Hypothesis

   4. Methodology

   5. Data Description

   6. Analysis and Key Findings

   7. Research Challenges

   8. Opportunities and Recommendations

Conclusions

Acknowledgments to our Partners

Introduction
We conducted research in the Hispanic Community of the New Orleans Metropolitan Area from January
to August 2019. The objective of this project is to identify the challenges, perspectives, and needs of
entrepreneurs in the Latino Community. The research identifies how additional resources can support
economic mobility for immigrants and Latino community members. Our research aims to analyze the
current conditions of micro-businesses and entrepreneurs in the Hispanic community.

This study provides statistical and qualitative data to community partners that are leading initiatives to
support micro-entrepreneurs in minority groups in the city. The findings and recommendations of this study
can guide local non-profit organizations and community partners in developing sustainable projects to
support entrepreneurs in this community.

Currently, most organizations working with entrepreneurs and micro businesses do not offer support tailored
to the Hispanic community. They lack available statistical data to analyze the conditions of the community
and design appropriate programs. An in-depth study was needed to understand Hispanic entrepreneurs’
unique needs, level of success and barriers to growth.

Methodology Overview
Data for this investigation were collected through 47 anonymous surveys of Hispanic/Latino entrepreneurs
in the New Orleans Metropolitan area. Surveyors visited sites, such as the West Bank Market and events
held by the Hispanic Chamber of Commerce and El Centro to survey participants. Some surveys were
also conducted over the phone. Participants were invited to take part in the survey through in-person
interactions at community sites or through referrals from friends, and colleagues. Surveys were available
in both English and Spanish, as were consent forms.

In addition to conducting surveys of entrepreneurs and business owners, the researchers also recorded
detailed notes of their observations at the survey sites and interviewed several community members to
develop a more in-depth and well-rounded understanding of the perspectives of Latino entrepreneurs.
As a result, this report utilizes both quantitative and qualitative methods to draw conclusions and make
recommendations.

Summary of Findings
This report does not attempt to establish generalizations about Latino entrepreneurs in New Orleans due to
the complexity of that community and the limitations of the sampling methods used by the survey. Rather,
through careful analysis of the survey results, the report finds several trends that exist within the target
population. Our data suggest that language and business knowledge are significant barriers that limit the
ability of Latino entrepreneurs in New Orleans to access capital, utilize business resources, and grow their

                                                    1
business. We also find that entrepreneurs in this community tend to be reluctant to use some resources,
such as loans from banks and assistance provided by governmental and non-profit organizations. Finally,
this report reveals that there are a number of organizations working with the Latino community in New
Orleans, but that Latino entrepreneurs are not always aware of their services and programs, so there are
opportunities for additional resources to support unmet needs.
The report is organized in 8 sections as follows: The first section presents a study on the demographics
and historical growth of the Hispanic community in the New Orleans Metropolitan Area, as background
to the research topic. The second section includes a stakeholder analysis of organizations and community
partners interacting with the Latino business community. The third section states the hypotheses and the main
research questions for this report. The fourth section explains the methodology used for data collection and
analysis. The fifth section presents a description of the surveyed participants and their businesses. The sixth
section analyzes the survey results and highlights key findings. The seventh section discusses challenges
encountered by the research team during the study. The eighth section presents recommendations and
suggestions from the research team to community leaders, ending with the report conclusions.
About Fund 17
In order to build a more equitable local economy, Fund 17 provides guidance and resources to entrepreneurs
who are primarily low-income people of color. The mission of Fund 17 is to create economic opportunity in
the 17 wards of New Orleans by providing tailored assistance to community members disconnected from
traditional business and financial resources. Established in 2012 by Tulane undergraduate Haley Burns,
Fund 17’s goal was to provide financial opportunity to unbanked and underbanked New Orleanians.
Today, Fund 17 is a robust network of staff, professionals, entrepreneurs, students, and partners working
together to create a stronger local economy where all New Orleanians can build sustainable livelihoods.
Through various programs and services, Fund 17 has directly supported over 400 community entrepreneurs
since becoming operational in 2015.
In addition to its programmatic work, Fund 17 has led two other research projects to better understand
entrepreneurship in New Orleans. As Fund 17 explored conducting programs in the Latino community,
there were persistent barriers to integrating this demographic into its everyday work. Although Fund
17 has a majority Latino Board of Directors and has had multiple Spanish speakers on its team, it
became clear to the organization that it needed to better understand the unique needs and perspectives
of the Latino entrepreneur community. This led to Fund 17 designing this particular project where it could
leverage its previous research experience, its Latino Board and staff and expertise on the New Orleans
entrepreneurship ecosystem.
2About the Research Team
Our research team is composed of three members of Fund 17 affiliated to Tulane University.
● Carol Serrano Crespo was born in Cuenca, Ecuador on December 21, 1996. She grew up in Quito, Ecuador
and moved to New Orleans in 2015 to attend Tulane University. During her years as an undergraduate,
she gained experience in business consultancy through internships in Ecuador and in New Orleans.
She fell in love with New Orleans architecture, music, food, and people. The sense of community and
New Orleans’ family-oriented culture reminded her of her Ecuadorian and Latin American roots.
● Madeline Ninno is from Orlando, Florida. She recently graduated from Tulane University, in
Economics and International Development with a minor in Public Policy. She has conducted research
in microbusinesses in Buenos Aires, Argentina.
● Brian Contreras was born in Managua, Nicaragua and raised in Los Angeles, California. He graduated in
2019 with a major in Latin American Studies from Tulane University.
● Haley Burns is the founder of Fund 17 and an avid community researcher. After studying under
geographers at Tulane University, Haley led four research projects for Fund 17 and our partners,
including this final project on Hispanic Entrepreneurship. She has since obtained her Masters in Urban
Planning and continues entrepreneurship research as an Extension Specialist in her home state of
Alabama.
3Section1:ResearchContext:TheHispanicCommunityofNewOrleans
Historical Growth of the Hispanic Community in the 21st Century in New Orleans
According to the national census of 2018, 9% of the population1 in the New Orleans Metropolitan Area2 self-
identifies as Hispanic/Latino3. Jefferson Parish has the highest concentration of Hispanics, as they represent
approximately 15% of the total population. Second is St. Bernard with 10%, followed by Plaquemines with
8%. All other parishes, except for St. James, have a Hispanic population that represents approximately 6% of
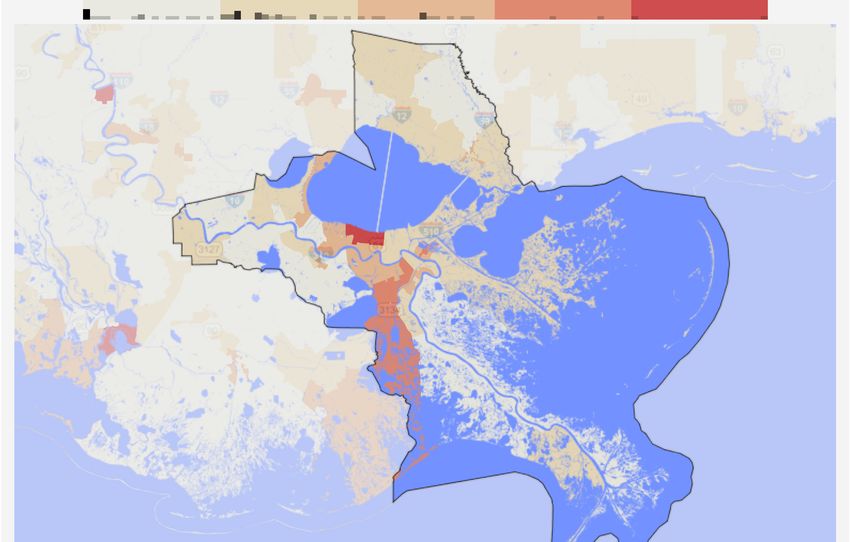
the overall population. Figure 1 below illustrates the counties with a higher Hispanic concentration.
Figure 1: Map of New Orleans Metro Area by county subdivision showing Hispanic density4
The Hispanic population in the New Orleans Metropolitan area has grown significantly in the past decade.
According to the 2018 National Census, the number of Hispanics in the Metro area almost doubled from 2001
to 2018, increasing by 55,751 people. In 2001, The Hispanic population represented only four percent of the
1 U.S. Census Bureau, Population Division. Annual Estimates of the Resident Population by Sex, Race, and Hispanic Ori-
gin for the United States, States, and Counties: April 1, 2010 to July 1, 2018. American FactFinder version. Distributed by
The United States Census Bureau, 2019. https://factfinder.census.gov/faces/nav/jsf/pages/index.xhtml
2 For the purpose of this research, the New Orleans Metropolitan Area consists of the following eight parishes: Jefferson,
Orleans, St. Tammany, St, Bernard, St. Charles, St. John the Baptist, Plaquemines, and St. James.
3 The term Hispanic relates to Spanish-speaking countries, including Spain. The term Latino relates to Latin American
origin, including non-Spanish speaking countries. However, during our community outreach and surveying, we found that
the community in New Orleans uses these terms interchangeably. Additionally, we did not encounter any non-Spanish
speakers. Therefore, this report uses both terms interchangeably.
4“Race and Ethnicity in New Orleans, Louisiana,” Statistical Atlas, September 17, 2018, https://statisticalatlas.com/place/
Louisiana/New-Orleans/Race-and-Ethnicity)
4total metro population5, increasing to nine percent by 20186.
The Hispanic community growth has outpaced the total population growth in the Metro area. Since 2010, the
total Metro area population has grown 7% while the Hispanic population has grown 25%.7 Figure 2 illustrates
the difference in population growth between Hispanics and the general population.
Population Growth 2002 -2018
25.00%
20.00%
15.00%
10.00%
5.00%
0.00%
2002 2003 2004 2005 2006 2007 2008 2009 2010 2011 2012 2013 2014 2015 2016 2017 2018
-5.00%
-10.00%
-15.00%
-20.00%
-25.00%
Hispanic Pop Growth Metro Pop Growth
Figure 2 8: Population Growth of Hispanics vs Metro Area Population from 2002 to 2018
As observed, during the last 20 years, the Hispanic population has been constantly growing at a higher
rate than the general population. During the first years Post-Katrina, only 10% of Hispanics left New
Orleans, compared to 25% of the general population. Additionally, the Hispanic community grew the
most during the 2010’s, when its growth reached 25%.
5 U.S. Census Bureau, Population Division. Intercensal Estimates of the Resident Population by Age, Sex, Race, and
Hispanic Origin for Counties in Louisiana: April 1, 2000 to July 1, 2010. Distributed by The United States Census Bureau,
2016.
6 U.S. Census Bureau, Population Division. Annual Estimates of the Resident Population by Sex, Race, and Hispanic Ori-
gin for the United States, States, and Counties: April 1, 2010 to July 1, 2018. American FactFinder version. Distributed by
The United States Census Bureau, 2019. https://factfinder.census.gov/faces/nav/jsf/pages/index.xhtml
7 U.S. Census Bureau, Population Division. Annual Estimates of the Resident Population by Sex, Race, and Hispanic Ori-
gin for the United States, States, and Counties: April 1, 2010 to July 1, 2018. American FactFinder version. Distributed by
The United States Census Bureau, 2019. https://factfinder.census.gov/faces/nav/jsf/pages/index.xhtml
8 U.S. Census Bureau, Population Division. Annual Estimates of the Resident Population by Sex, Race, and Hispanic
Origin for the United States, States, and Counties: April 1, 2010 to July 1, 2018. American FactFinder version. Distributed
by The United States Census Bureau, 2019. https://factfinder.census.gov/faces/nav/jsf/pages/index.xhtml; U.S. Census
Bureau, Population Division. Intercensal Estimates of the Resident Population by Age, Sex, Race, and Hispanic Origin for
Counties in Louisiana: April 1, 2000 to July 1, 2010. Distributed by The United States Census Bureau, 2016.
5The Hispanic population has increased in all parishes. However, Jefferson, Orleans, and St. Tammany
have recorded the highest number of Hispanics for the past 20 years. Figure 3 below shows the number
of Hispanis per parish, from 2000 to 2018.
Hispanic Population in Metro Area (2001-2018)
140,000
120,000
100,000
St. James
Plaquemines
80,000 St. John the Baptist
St. Charles
60,000 St. Bernard
St. Tammany
Orleans
40,000
Jefferson
20,000
-
2001 2003 2005 2007 2010 2011 2012 2013 2014 2015 2016 2017 2018
Figure 3 9: Hispanic Population in Numbers by Parish from 2001 to 2018
As shown on Figure 3, St. Tammany and Jefferson have experienced the highest increase in Hispanics in the
last 20 years, by number and by percentage. Between 2000 and 2018, the number of Hispanics in Jefferson
Parish doubled, and, in St. Tammany Parish, it more than tripled, with an increase of 10,074 people.
Current Demographics of the Hispanic Community in New Orleans
In the metropolitan area, a high percentage of noncitizens or naturalized citizens come from Latin America.
Five-year 2017 census data10 estimates show that 50% of naturalized citizens and 66.2% of non- citizens in
the Metro area come from Latin America. In Jefferson and Orleans Parish, 56.4% and 38.7%, respectively, of all
9 U.S. Census Bureau, Population Division. Annual Estimates of the Resident Population by Sex, Race, and Hispanic
Origin for the United States, States, and Counties: April 1, 2010 to July 1, 2018. American FactFinder version. Distributed
by The United States Census Bureau, 2019. https://factfinder.census.gov/faces/nav/jsf/pages/index.xhtml; U.S. Census
Bureau, Population Division. Intercensal Estimates of the Resident Population by Age, Sex, Race, and Hispanic Origin for
Counties in Louisiana: April 1, 2000 to July 1, 2010. Distributed by The United States Census Bureau, 2016.
10 2018 Census data is only available for total number of Hispanics. The 2017 American Community Surveys the most
recent census that provides detailed information such as country of origin, education attainment, income, etc.
6naturalized citizens are from Latin America. Regarding non-citizens, Jefferson and Orleans Parishes experience
74.4% and 46.5% of Latin Americans.11
The country of origin of Hispanics in the Metro area is also worth noting, as it differs in the percentage of
composition when compared to the U.S as a whole. Figure 4 shows the country of origin by percentage of
Jefferson and Orleans parishes, the aggregated percentage in the Metro area, and the U.S. Jefferson and
Orleans parishes are analyzed the most as they have the two largest Hispanic communities of all parishes in
the Metro area
Country of Origin 2017
100%
6.0% 4.8%
10.9% 8.1%
3.6% 4.2%
90% 4.0%
4.2% 5.7% 3.8%
Other, Latin America 4.5%
80% 5.9% 3.1%
Other, South America 5.6% 3.3%
7.3% 3.8%
Colombia 70% 4.4%
9.6%
El Salvador
60% 36.1% 29.8%
Nicaragua 23.6%
Honduras 50%
Guatemala
4.7% 5.8%
40%
Other, Central America 6.8%
4.1% 4.0%
Dominican Republic 6.7% 63.19%
30% 5.2% 6.5%
Cuba 5.7% 6.0% 5.3%
Puerto Rico 20% 4.2%
Mexico
10% 21.15% 22.06%
18.11%
0%
. Jefferson Orleans Metro Area US
Figure 412: Bar Chart of Country of Origin of Hispanic Population
As shown on Figure 4, a high percentage of Hispanics come from Central America and the Caribbean, equaling
approximately 64% of the Hispanic population in the Metro area. From all countries, most Hispanics in the
Metro area and in Orleans and Jefferson Parish, come from Honduras, with approximately 30%. Mexico as a
country of origin still shows one of the highest percentages (21%) but its percentage is substantially lower
compared to its national percentage of 63.19%.
11U.S. Census Bureau, 2013-2017 American Community Survey 5-Year Estimates. Table B05002. American FactFinder
version. Distributed by The United States Census Bureau, 2018. https://factfinder.census.gov/faces/nav/jsf/pages/index.
xhtml
12 U.S. Census Bureau, 2013-2017 American Community Survey 5-Year Estimates. Table B03001. American FactFinder
version. Distributed by The United States Census Bureau, 2018. https://factfinder.census.gov/faces/nav/jsf/pages/index.
xhtml
7Economic Indicators of the Hispanic Community
The economic and education conditions of Hispanics can be compared to the conditions of the general Metro
area population. In the Hispanic Community, the average annual income is forty four thousand dollars.13
Unemployment rate lies at seven percent. Table 1 below summarizes the differences in economic conditions
between the Latinos and the general Metro population.
Economic Indicator HispanicCommunity Metro Population
Median Household Income14 $44,047.1515 $50,696.7216
Unemployment rate (%)17 6.5 7.12
Labor Force Participation (%)18 70.20 62.77
Poverty rate (%)19 18 21.84
Table 1: Economic Indicators of Hispanic Population vs Total Metro Area Population
As Table 1 shows, the labor force participation is higher for Hispanics than the general population.
Although unemployment is lower for Hispanics, the average annual income is lower compared to the
general Metro area population.
Also noteworthy is the Hispanic population unemployed and living below the poverty line in the Metro area.
Out of the population below the poverty line in the Metro area, 10.56% are Hispanics. Moreover, Jefferson
Parish experiences a higher percentage, with approximately 20% of the population below the poverty line
being Hispanic.
13 U.S. Census Bureau, 2013-2017 American Community Survey 5-Year Estimates. Table B19013I. American FactFinder version.
Distributed by The United States Census Bureau, 2018. https://factfinder.census.gov/faces/nav/jsf/pages/index.xhtml
14 For the past 12 months for Households in 2017 inflation-adjusted dollar
15 U.S. Census Bureau, 2013-2017 American Community Survey 5-Year Estimates. Table B19013I. American FactFinder version. Dis-
tributed by The United States Census Bureau, 2018. https://factfinder.census.gov/faces/nav/jsf/pages/index.xhtml
16 U.S. Census Bureau, 2013-2017 American Community Survey 5-Year Estimates. Table B19013. American FactFinder version. Dis-
tributed by The United States Census Bureau, 2018. https://factfinder.census.gov/faces/nav/jsf/pages/index.xhtml
17 U.S. Census Bureau, 2013-2017 American Community Survey 5-Year Estimates. Table S2301. American FactFinder version. Distrib-
uted by The United States Census Bureau, 2018. https://factfinder.census.gov/faces/nav/jsf/pages/index.xhtml
18 U.S. Census Bureau, 2013-2017 American Community Survey 5-Year Estimates. Table S2301. American FactFinder version. Distrib-
uted by The United States Census Bureau, 2018. https://factfinder.census.gov/faces/nav/jsf/pages/index.xhtml
19 U.S. Census Bureau, 2013-2017 American Community Survey 5-Year Estimates. Table S1701. American FactFinder version. Distrib-
uted by The United States Census Bureau, 2018. https://factfinder.census.gov/faces/nav/jsf/pages/index.xhtml
8Other Indicators in the Hispanic Community
Educational attainment in the Hispanic Community reflects a somewhat different reality than the general
population. The most significant differences are the percentages of the population that have graduated
high school and that have earned a bachelor’s degree or higher. Figure 5 and 6 below illustrate the reality
in education in the Hispanic community compared to the general Metro area population.
Educational Attainment Educational Attainment
(General Pop.) (Hispanic)
13%
19%
26%
30%
27%
26%
29%
30%
Less than high school graduate Less than high school graduate
High school graduate High school graduate
Some college or associat e's degree Some college or associat e's degree
Bachelor's degree or higher Bachelor's degree or higher
Figure 520 & Figure 621: Education Attainment of Total Population vs Hispanics in Metro Area
As shown in the figures above, education attainment proves to be significantly lower for Hispanics than
the general population in the New Orleans Metropolitan area. Twice as many people in the Hispanic
community, 26%, have not obtained a high school diploma, compared to 13% in the general population.
Similarly, significantly less Hispanics have obtained a bachelor’s or a higher academic degree compared
to the general population, 19% and 30% respectively. As these percentages are calculated over a five
year period, from 2013 to 2017, they show the historical difference in education attainment between
these two groups in recent years.
20 U.S. Census Bureau, 2013-2017 American Community Survey 5-Year Estimates. Table B23006. American FactFinder version. Dis-
tributed by The United States Census Bureau, 2018. https://factfinder.census.gov/faces/nav/jsf/pages/index.xhtml_
21U.S. Census Bureau, 2013-2017 American Community Survey 5-Year Estimates. Table C15002I. American FactFinder version. Dis-
tributed by The United States Census Bureau, 2018. https://factfinder.census.gov/faces/nav/jsf/pages/index.xhtml
9Section 2. Stakeholder Analysis: Existing Organizations and
Community Partners in the Hispanic Community
Currently, several non-profit organizations serve the Latino community, however, only a few are focused
on entrepreneurship and business support. The main organizations providing business assistance are El
Centro Inc and the Hispanic Chamber of Commerce of Louisiana. Community markets also play a key role
as enablers and facilitators for Latinos to open their businesses. The Algiers Flea Market and Westbank
Flea Market are weekend markets with predominantly hispanic vendors and customers. Other social
organizations are important community partners as they are well-connected to the Hispanic community
and can facilitate communication with hispanic business owners, like Catholic Charities Archdiocese
of New Orleans and the Hispanic Apostolate of the Archdiocese of New Orleans. La Voz Coalition,
Jambalaya News Louisiana, the Hispanic Chamber of Commerce Foundation, and Noche Buena Bazaar,
are other organizations that connect the community with resources, including business resources. We
observed communication and cooperation among the organizations working in the Hispanic community.
El Centro Inc
El Centro Inc is a nonprofit organization, founded in 2018, that works closely with entrepreneurs and
small business owners. Their mission is to empower Latino entrepreneurs through financial literacy and
entrepreneurial training. El Centro achieves this goal through business bootcamps, educational workshops
and one-on-one consulting.22 In addition to offering these services, El Centro has a broad outreach through
other organizations or corporations like The Hispanic Chamber of Commerce, Capital One, and consulates
in New Orleans. El Centro and its founder and executive director, Lindsey Navarro, supported this research
project, connecting the team with Latino entrepreneurs for surveys and interviews.
Hispanic Chamber of Commerce of Louisiana
The Hispanic Chamber of Commerce of Louisiana is a nonprofit organization founded in 1999 as a result of a
merger between The Louisiana Hispanic Chamber of Commerce and The Gulf Coast International Chamber
of Commerce.23 The organization is committed to create and facilitate business climate to foster economic
development and progress in Louisiana. It offers paid membership that includes networking opportunities
through access to the many events hosted by the chamber, discounts with the Office Depot program, corporate
sponsorship and advertisement and business resources like listing of personal business on the chamber’s
website and opportunities to participate in the chamber’s monthly radio shows.
In addition to the paid membership, The Hispanic Chamber of Commerce is host to different organizations
that offer workshops to people looking to start or develop their businesses. It arranges multiple events
like Conversacion y Cafe, partnering with El Centro, 2019 Women’s Business Symposium, and the Young
Professionals Summer Minglethroughout. The Chamber also offers ESL classes through a partnership with
22 El Centro Inc. “Servicios” El Centro. Available at: https://www.elcentrola.org/servicios.html [Accessed 11 Nov. 2019].
23 HCCL. “HCCL Overview” Hispanic Chamber of Commerce of Louisiana . Available at: https://www.hccl.biz/hccl-over-
view/ [Accessed 07 Nov. 2019].
10Delgado Community College.
Our research team connected with the Hispanic Chamber of Commerce to promote and reach out to the
community for the project. The organization invited us to their events. Through those interactions, it was
observed that the Chamber relies heavily on other local organizations to organize their events. The Chamber
acts as the middleman between organizations that wanted to offer business support services and their
members. Members are not exclusively Hispanic, as some events are tailored to the entire local business
community.
Additionally, the Hispanic Chamber of Commerce of Louisiana Young Professionals is a committee that aims
to grow the young professional Hispanic community through networking and community service events.24
The Algiers Flea Market
The Algiers Flea Market or Dix Jazz Market, the official name of the flea market, hosts small diverse businesses
offering food, catering, hair-styling, retail, tire services among others. They are well known among the Latino
community of New Orleans. Although the market is only opened during the weekend, a large amount of
people frequent it. One of its main attractions is its food shops. The Algiers Flea Market is home to established
restaurant-style food shops that offer Latin dishes ranging from South American to North American foods.
The team visited the market multiple times and interacted with vendors and customers. From those visits,
it was observed that the market’s infrastructure needs improvement; some tents appear to have aged
materials that could be repaired. Predominantly built in wood, the market should be carefully managed to
reduce fire hazard, among other risks.
West Bank Market
The Westbank Flea Market is located in Harvey and is open only during the weekends, from 8 am to 4 pm.
As an open-air market, Westbank has a welcoming set up, with large walking and resting areas, as well as a
significant number of parking spaces. It has a roof-covered area designated for food stands, with the capacity
to house approximately 25 to 30 food vendors. Open since 2017, The Westbank Flea Market still faces a low
flow of customers. Vendors and visitors mentioned a need for more advertising to reach the market’s Hispanic
and non-Hispanic target customers.
Catholic Charities Archdiocese of New Orleans
The Catholic Charities Archdiocese of New Orleans provides a comprehensive network of social services that
connect people to resources in eight parishes spanning the greater New Orleans region. It is well-known
among the members of the Latino community as it offers support services regarding family issues, health,
immigration, and language barriers.25 Catholic Charities welcomes everyone who is in need of support to better
themselves, regardless of their religion, race or ethnicity. Catholic Charities partners with many organizations
to provide support and connect individuals to adequate resources.
Catholic Charities also partners with academic institutions to offer ESL and financial literacy classes. Tulane
24 HCCL. “Young Professionals Committee” Hispanic Chamber of Commerce of Louisiana . Available at: https://www.hccl.
biz/young-professionals/ [Accessed 07 Nov. 2019].
25 Catholic Charities Archdiocese of New Orleans.. “About Us” Catholic Charities Archdiocese of New Orleans. Available
at: http://www.ccano.org/ [Accessed 17 Oct. 2019]
11University, through the course ECON 3100 Money and Banking taught by Professor Antonio Bojanic, sends
students to volunteer bimonthly. Students lead and help expand the financial literacy course taught to the
current ESL learners. The course focuses on how to set financial goals, how to prepare a simple budget, how
to fill out a W4 form and other tax forms; the basics of financial institutions and types of bank accounts, credit,
the foundations for asset and wealth development, consumer rights; savings; how to maintain a checking
account and manage credit cards, among other topics.26
La Voz De la Comunidad Coalition
La Voz De La Comunidad is a comprehensive community coalition. Their mission is to improve Latino
communities in Louisiana through the prevention of youth drug abuse through cultural competency. La Voz
de la Comunidad works with community leaders to aid in the strengthening of these communities. Although
they only meet once a month, they are on top of the ways they can tackle social issues that the Latino
community might encounter around Louisiana.
For the Hispanic youth, organizations like Noche Buena Bazaar, which hosts pop-up markets, have
developed to provide Latinos with a space to promote their businesses. Noche Buena Bazaar happens
once a month in different locations and hosts around 15-20 vendors that are mostly self-identified as
Latinx. They attract a young audience and sell clothes, jewelry, arts, food, etc, accompanied with live
music and a modern ambiance.
Other organizations in the Metro area focused mainly on social issues among Hispanics. Congress of Day
Laborers “Congreso de Jornaleros” hosts social and political activism events. Puentes New Orleans offers
college preparation programs, arts, and cultural events. It also has a Youth Action Council to advocate for
Hispanic youth.
During our interactions with all these organizations, we have noticed a strong communication and
relationship among local organizations to support Latinos. Community leaders work closely and meet
regularly to discuss issues concerning Latinos. Monthly meetings and special events gather leaders of
these organizations to network and tackle different problems in the community. Co-programming among
these community partners is offered to the Latino community, especially business workshops provided by El
Centro with the collaboration of the Hispanic Chamber of Commerce, Consulates, and other local partners.
However, most organizations are not focused primarily on the business needs of Hispanic entrepreneurs
in the community.
26 Antonio Bojanic (Tulane ECON 3100 professor) in discussion with the author, February 2019
12Section 3. Research Questions and Hypotheses
Research Questions
Our research aims to answer questions about the conditions, challenges, and perceived needs
of Latino businesses and business owners. Specifically, we aim to answer the following 7
questions:
1. What are the main barriers for Latino entrepreneurs to start and grow their businesses?
2. Are Latino business owners accessing capital and technical assistance?
3. What are their perspectives on business and capital resources?
4. What is their desired level of business growth?
5. What is the main reason for Latino entrepreneurs to start their business?
6. What are the most popular advertising channels among Latino business owners?
7. How do culture and other personal experiences play into their experiences as entrepreneurs?
Hypotheses
With data collection through surveying, interviewing, and interacting with the community, our study aims to
test four main hypotheses:
☐ Language is the main barrier for Latino businesses to grow.
☐ Latino businesses serve primarily a Spanish speaking customer base.
☐ Latino business owners have previous experience in business, and a majority owned businesses or
were involved in family businesses in their home countries.
☐ Finally, our study’s hypothesis is that Latino entrepreneurs and business owners are not aware of
resources available for their businesses.
13Section 4. Methodology
Fund 17 researchers conducted outreach at several locations in the New Orleans Metropolitan Area
before surveying any participants. We dispersed flyers at the Westbank Market, the Algiers Flea Market,
and several events hosted by groups such as the Hispanic Chamber of Commerce and El Centro. These
events took place in New Orleans, Kenner, and Harvey. Most in-person surveys were conducted at the
Westbank and the Algiers Markets with both vendors and visitors at the markets. Surveying took place on
weekends throughout the spring and summer of 2019. We also conducted surveys over the phone, often
with participants referred to Fund 17 via community partners or with participants surveyors engaged at
community events.
Many participants were randomly identified at the markets or selected at events hosted by El Centro or
the Hispanic Chamber of Commerce. Many others were referred to Fund 17 by other participants in the
survey. As a result, the sampling process was not perfectly random, which is considered in the analysis of
the findings.
All participants consented to participate in the research prior to beginning the survey. Participants also
had the right to skip any questions they chose. Participants could choose to take the survey in Spanish or
English. The surveyor read the questions aloud to the participant and recorded answers on the survey’s
Google Form on their phone. For some sensitive questions, such as household income, they would allow
the participant to select the answer on the phone themselves. The surveyor or their partner took notes
during the survey to capture all of the details of the participant’s responses. At the end of the survey, the
participant would sometimes be rewarded with a $5 Walmart gift card.
While at community events and the markets, surveyors took detailed notes of their surroundings. Surveyors
also participated in several events and socialized with customers and workers at the markets in order to
better understand the business environments and to cultivate a relationship with community members.
The Fund 17 research team also conducted interviews with several members of the Latino business
community who could provide unique insight into the current situation of Latino business owners and
entrepreneurs in the New Orleans Metropolitan Area. These semi-structured interviews were conducted in
person or over the phone, and were recorded with the consent of the interviewee.
14Section 5. Data Description
We surveyed 47 entrepreneurs self-identified as Latinos/Hispanics through in-person and phone surveys.
Figure 7 to 21 illustrate the characteristics and demographics of the survey participants in the following
way:
1) Channel through which we connected with participants (Figure 7)
2) Age range (Figure 8)
3) Gender (Figure 9)
4) Ethnicity (Figure 10)
5) Area of residence (Figure 11)
6) Country of birth (Figure 12)
7) Country of origin (Figure 13)
8) Annual income (Figure 14)
9) English fluency (Figure 15)
10) Spanish Fluency (Figure 16)
11) Business industry (Figure 17)
12) Business location (Figure 18)
13) Time business has been open (Figure 19)
14) Business income (Figure 20)
15) Language to do business (Figure 21)
15How We Connected With Participants Partipants' Age
4%
10%
2%
6%
West Bank Flea Market 6%
El Cent ro 30%
6%
The Algiers Flea Market 41%
28%
HCC
Visiting Businesses 11%
Ideal Market
Other Referrals
Lat ino Forum 11%
17% 28%
18-25 26-35 36-45 46-55 56+
Channel through which we connected with participants (Figure 7) Age range (Figure 8)
Ethnicity (Self-Identified) Participants' Gender
50
45
40
35
30 36%
25
20
15
10
5 64%
0
Latino/ Black Indigenous Mestizo White Arab
Hispano from Latin
America
Male Female
Ethnicity (Figure 10) Gender (Figure 9)
16Area of Residence
Westwego
4% Jefferson
4% Uptown/Carrolton
Gentilly
Gretna 6% 4%
6% French Quarter St Bernard
2% 2%
Harvey
Marerro
9%
2%
Terrytown
2%
Kenner
Other Bywater
11%
14% 2%
Algiers
2%
Other
Mid City 4%
19% Metarie
19%
Area of residence (Figure 11)
Country of Birth
1 1
1
2
2 Honduras
14
2 El Salvador
US
Mexico
Nicaragua
5
Puerto Rico
Colombia
Ecuador
Costa Rica
Belize
7
12
Country of birth (Figure 12)
17Country of Origin
Puerto Colombia
Mexico
Rico 6%
15% Costa Rica
7% Nicaragua 2%
4%
Belize
2%
Guatemala
Other 2%
El Salvador 12% Ecuador
26% 2%
Dominican Republic
2%
Prefer not to answer
2%
Honduras
30%
Country of origin (Figure 13)
Income Range
9%
19%
Less than $12,000
$12,000-$28,000
19%
$28,000-$36,000
4%
$36,000-$55,000
6% $55,000-$75,000
$75,000-$100,000
9% More than $100k
15%
Prefer not to answer
19%
Annual income (Figure 14)
18 English Fluency Spanish Fluency
16 50
14
12 40
10
30
8
6 20
4
2 10
0
1 Cannot speak nor 2 Limit ed Level 3 Can understand but 4 Fluency (O ral & 5 Native Language 0
understand have diff icult ies Comprenhension) 1 Cannot speak 2 Limit ed Level 3 Can understand 4 Fluency (O ral & 5 Native Language
speaki ng nor underst and but have dif fi culti es Comprenhension)
speaki ng
English fluency (Figure 15) Spanish fluency (Figure 16)
184%
Business Industry
4%
6% 24%
27
Other
Food Stall/Grocer
6%
Services
Clothing/Jewelry/Accessories
Construction/Contractor
6%
Technology
Food Production
Cleaning Services
9% Arts/Crafts
21% Restaurant/Catering
9%
11%
Business industry (Figure 17)
Business Location
Uptown-Carrollton
6%
Everywhere Central City/ Garden
Metarie District
7%
7% 3%
Algiers Marrero
7% Gretna 3%
4%
Outside NO Metro Area
Mid City 3%
12%
Other
13% Jefferson
2%
Kenner
2%
Lower Ninth Ward
ByWater 2%
16% Other
1%
Harvey
25%
Business location (Figure 18)
__________
27 Other includes: Real Estate/Rental, FoodStall/Grocer,Restaurant/Catering. Tools Vendor, Education, Nonprofit,
Lawn/Landscaping, Entertainment,Technology, Insurance, Communication/Media, Entertainment,Sports, and Product
19Designer.
Business Lifetime
15% 13%
Less than 6 months
6 months - 1year
1-5 years
21% 25%
5-10 years
10-20 years
26%
Time business has been open (Figure 19)
Monthly Business Income
6%
23%
< $500
28% $500-$1,000
2% $1,000-$1,500
$1,500-$2,000
11% $2,000-$3,000
6% 11%
9% 4%
Business income (Figure 20)
20Language to do Business
17%
23%
4%
Spanish
Mostly spanish
Both
Mostly english
English
28%
28%
Language to do business (Figure 21)
Interviews
We conducted interviews with community leaders that have worked with Latino entrepreneurs and can
provide us with insights into the current state and the development of local Latino businesses. Through these
interviews, we have gathered qualitative data that can further support our key findings. We interviewed
Lindsey Navarro and Mariana Montero.
Lindsey Navarro
Lindsey Navarro is the Founder and Executive Director of El Centro Inc, a non-profit that supports Latino
businesses. With an MBA from Loyola University, Lindsey started working in the community when she joined
LiftFund in 2011 as Senior Business Development Officer. She was the organization’s first bilingual loan officer
outside of Texas. In this role, Lindsey built relationships with many local Latino organizations. Her passion to
help business owners in the community led her to found El Centro in 2018. El Centro Inc. is a 501c3 Nonprofit
Organization in New Orleans that offers financial literacy and business education training to entrepreneurs. It
hosts a series of workshops about topics that range from budgeting, understanding credit reports to strategic
decision making. Lindsey also serves as Co-Chair of the board for the Committee for a Better New Orleans,
President of the board for Fund 17, and Vice-President of the board for the Crescent City Community Land
Trust.
21Mariana Montero
Mariana Montero is the Founder and Executive Director of Golden Change Inc., a local non-profit that
addresses violence and health issues in diverse communities in the New Orleans Metropolitan Area. With an
engineering degree from University of Guayaquil and an MBA from the University of New Orleans, Mariana has
experience in corporate, academic, and non-profit sectors. She has been working with the Latino community
for 24 years, holding positions in multiple local organizations including La Voz de la Comunidad, Metropolitan
Center for Women & Children, Board Member of Luke’s House Clinic, Vice-President of the Latin American
Civic Association of Louisiana, Inc., a member of the National Organization for the advancement of Hispanics,
former President of the Business Professional Women’s Association, and a member of Jefferson Lions Club.
With her involvement in the community, Mariana has gained a deep understanding of the condition of local
Latino businesses and how they have changed over the past years.
22Section 6. Analysis and Key Findings
In this section, we analyze the results of our survey, focusing on how they answer our research questions
and support our initial hypotheses. We further support our key findings by citing our interviewees and
connecting their answers to what is reflected in the survey responses.
Using data collected through surveys, interactions with the community, and interviews with community
leaders, we aim to respond the following research questions:
1. What are the main barriers for Latino entrepreneurs to start and grow their businesses?
2. Are Latino business owners accessing capital? Technical assistance?
3. What are their perspectives on business and capital resources?
4. What is their desired level of business growth?
5. What is the main reason for Latino entrepreneurs to start their business?
6. What are the most popular advertising channels among Latino business owners?
7. How do culture and other personal experiences play into their experiences as entrepreneurs?
What Are the Main Barriers for Latino Entrepreneurs to Start and Grow Their Businesses?
One of our main research intentions was determining the key barriers that limit Latino businesses’ growth in
the city. Through survey responses, we identified five main barriers Latino entrepreneurs are likely to face:
language barrier, access to capital, finances, time and personal issues, and lack of business knowledge. Figure
22 below illustrates the challenges mentioned by participants and the percentage of participants who selected
those challenges as main barriers to growing their business.
Barriers for Business Growth
Other
Physical Space
Staffing
Legal/Admin Problems
Finances
Time/Personal Issues
Business Knowledge
Advertising
Access to Capital
Language
0% 10% 20% 30% 40% 50% 60%
Fig.22 Survey questions “ What are the main barriers for your business to grow”
23Language Barrier
The first potential obstacle we investigated was the language barrier, which we hypothesized would
impede Latino business owners’ ability to access clients and resources. When asked if language was a
barrier for their business, 50% of participants said that it was. Particularly, 47% said it was a barrier
to accessing clients, while it was a barrier to business resources for 19% and a barrier to government
resources for 17%, as illustrated in Figure 23. Lindsey Navarro explained that she had also noticed during
her time working with the community that language barrier is a major obstacle for Latino entrepreneurs.
She believes improving language accessibility of government resources does not only mean translating
government websites, but marketing these translated sites and material to the public to raise awareness of
their existence when complete.
Language as a Business Barrier
To Access Govt Resources
To Access Business Resources
To Access Clients
0% 10% 20% 30% 40% 50%
Fig.23. Survey Question “Is language a business barrier to access resources and/or client”
While many participants indicated that language was an obstacle, their response was greatly dependent
on the nature and requirements of their businesses. Some participants who spoke basic English still
responded that it was a barrier because they had difficulties completing legal and financial forms in
English. On the other hand, several participants who only spoke Spanish indicated that language was not
a barrier because few or none of their customers spoke English with them. This distinction demonstrates
that, for participants, language plays a complex role in the development of their businesses.
Finances and Access to Capital
Another barrier faced by Latino entrepreneurs in our sample is access to capital, with 41% of participants
listing it as the second biggest limitation to growing their businesses. Lindsey Navarro also commented on
this topic, stating that the most common request she has at El Centro is access to capital. Legal barriers can
make it difficult to access capital, as one participant specifically mentioned that she could not go to the bank
for a loan because she was undocumented. Moreover, entrepreneurs in the markets expressed challenges in
finding larger and more permanent locations for their businesses due to a lack of knowledge about local real
estate and financial management. Managing finances was a challenge for 24% of participants, who mentioned
24having issues allocating and controlling financial resources in their businesses.
Furthermore, our survey asked participants about the types of bank accounts used for their businesses. Only
32% of participants had both a personal and business account to manage their businesses separately from
their personal finances. Figure 24 shows the percentages of participants who have either a personal or a
business bank account, both, or neither.
Bank Account
4%
17%
No
32%
Only personal
Both
Only business
47%
Fig.24. Survey Question “What type of bank account do you have?”
As shown on Figure 24, most participants only have a personal bank account to manage their businesses.
Additionally, 17% of participants do not have any type of bank account. These responses indicate a lack
of adequate financial management. Entrepreneurs could be miscalculating expenses and the net income
generated by the business. As a result, they are facing challenges in the ability to manage their existing
financial resources to grow their businesses.
Time and Personal Issues
In our survey, 26% of participants indicated time and personal issues as a barrier to growing their business.
Within this category people mentioned having to take care of children, personal health issues, and gender-
based discrimination as specific limitations. Several participants indicated that working another job in addition
to running their own business limited the growth of their business.
Lack of Business Knowledge
A lack of business knowledge can also create a barrier to growing one’s business, as 19% said a lack of business
knowledge was one of the biggest limitations to growing their business. In some cases, this may be related to
the language barrier, as some participants mentioned that there were not enough Spanish-language resources
to learn more about businesses. Participants listed licensing, tax law, legal regulations and marketing as areas
in which they lacked knowledge and wanted to learn more. For example, one participant explained she had all
the paperwork that she thought was necessary for her business; however, she did not really understand what
25any of the documents meant. A friend of hers helped her fill out forms to obtain the document. The document
was the registration of her business as a limited liability company, LLC, which she did not understand.
Our survey asked participants to identify their level of knowledge in tax, accounting, and legal matters
related to their business. Out of the total, 34% expressed feeling not familiar at all with tax and accounting
matters involving their businesses and 23% expressed limited knowledge. Only 34% expressed feeling
familiar or very familiar with these topics. We obtained similar responses when asking participants their
knowledge on regulations and legal matters regarding their business. The survey responses show that
38% felt not familiar at all and 19% expressed having limited knowledge. Only 30% felt familiar or very
familiar with legal implications concerning their businesses. Figure 25 and Figure 26 below illustrate these
statistics.
Tax & Accounting Knowledge Regulatory and Legal Knowledge
11%
21%
34%
38%
19%
13%
13%
9%
23% 19%
Not familiar at all Not familiar at all
Limited knowledge Limited knowledge
Somewhat familiar Somewhat familiar
Familiar Familiar
Very familiar Very familiar
Fig.25 & Fig.26 “How familiar are you with tax & accounting/ regulation and legal matters of the business?
Other questions in the survey also show a lack of business knowledge among our participants. About 62%
of participants did not have an LLC, and, from those participants, 69% did not know what it was. Out
of 29 who had not registered their businesses as an LLC, only 14% said they did not want to. Everyone
else expressed interest after being explained the advantages of an LLC. Figure 27 and Figure 28 below
illustrate these statistics.
26Business is LLC Interest in LLC
21%
Yes
Yes
38%
43% No
No
Don't know 14% Don't
what it is know
65% what it is
19%
Fig.27 & Fig.28 “Is your business an LLC/do you have interest in registering it as an LLC?”
Similarly, 51% of participants indicated they did not have a city licensing. From this group, 71% expressed
interest in a city licensing. Figure 29 and Figure 30 shows the responses to this survey question.
9% City Licensing Interest in City Licensing
4%
40% 25%
Yes Yes
No No
Not needed Unsure
51%
71%
Fig.29 & Fig.30 “Do you have city licensing/do you have interest in getting it?”
Although the LLC and city licensing questions did not directly address business knowledge, the high
percentage of participants unaware of the meaning of an LLC further demonstrates a lack of business
acumen. In a similar way, the high percentage of interest in a city licensing could indicate a lack of
knowledge on how to obtain it. Some participants expressed being interested in a city licensing but not
understanding the requirements or the process to obtain it.
A lack of business knowledge could also be studied by analyzing the complexity of the accounting system
utilized in a business. The survey results show that 41% of participants had a paper system of collecting
receipts and writing down earnings and expenses. Furthermore, 30% did not have any written system in place.
Some participants commented they would approximate sales and keep numbers in their head. Only 23% of
participants had a digital system in place, like Excel or QuickBooks, and 6% hired an accountant. Overall, 71%
of participants did not have in place any digital accounting system that can better assist in keeping records of
their businesses, as shown in Figure 31.
27Accounting System
6%
30%
23%
None
Paper
Digital
Bookkeeper
41%
Fig.31. “What type of accounting system do you use for your business?”
The surveys taken in English were more likely to identify more established accounting systems (digital
systems) and more knowledge in the legal and accounting matters of the businesses. This finding presents
more evidence on the correlation between the language barrier with business knowledge and resources.
Our findings indeed show a relation between speaking English and having more business knowledge,
resources, and more established systems.
Are Latino Business Owners Accessing Capital or Technical Assistance?
Our survey found that 79% of respondents had not received assistance from any local or national organizations
that offer help to entrepreneurs and small business owners. Only 19% had received help from organizations,
those being El Centro, the Urban League, Q, New Corp, and the Hispanic Chamber of Commerce (HCC).
Notably, all but one of those who said that they had worked with organizations were referrals from the HCC or
El Centro. Figure 32 illustrates the survey responses regarding this question.
28Worked with Local Support Organizations
2%
19%
Yes
No
Prefer not to answer
79%
Fig.32. “ Have you worked with organizations in New Orleans that offer business support?”
Lindsey expressed her concern with a lack of local organizations that support certain stages of
entrepreneurship, specifically the pre-seed stage, when entrepreneurs have only developed their business
idea; “There are Latinos who want to become entrepreneurs but find themselves not having the support or
the tools to succeed as an entrepreneur in New Orleans.”.
What are Latino Entrepreneurs’ Perceptions on Business and Capital Resources?
This report also aims to understand what the perspectives of Latino entrepreneurs are regarding business
and capital resources. Perceptions on capital and technical assistance may be influenced by cultural attitudes.
Throughout our survey, participants also expressed a wariness of taking out loans, illustrated in Figure 33 and
Figure 34 below.
Business Loans Interest in Business Loans
2%
Yes
Want it
36% No 38%
Do not
Prefer not want it
to answer
62%
62%
Fig.33 & Fig.34: Have you ever borrowed money? Would you like to?
29As shown in Figure 33 and 34, only 36% had taken out a loan. Of those who received a loan, 42% received it
from a friend or family member, while 29% took one out from a bank and 29% received one from a non-profit.
62% of respondents who had not taken out a loan did not want to. The remaining 38% who had not taken out
a loan wanted to but were uncertain where to finance it. We suspect this wariness is related to their cultural
perception of debt and loans. Mariana Montero, Executive Director of Golden Change Inc., commented, “The
Latino perspective is that a good customer is one who pays in cash. We have the mindset that if I do not have
the money, I am not going to buy it. However, the good customer is in reality the one who pays in credit, who
borrows and pays little by little, building credit. That mentality, we do not have it.”
Furthermore, throughout the surveying period, many expressed hesitancy and skepticism towards the
researchers and other resource providers. Several expressed they did not want to work with the government
at all; it was necessary to clarify that Fund 17 was not related to the government. Three participants explicitly
said during the survey that they did not want to receive resources or assistance from the government, while
several others said that they were reluctant to register their business because they did not want to deal
with the government.
As Fund 17 is a mission-driven organization , it was necessary to reiterate the programming and goals of
Fund 17 in detail for community members to feel comfortable talking about their businesses with us. After
weeks of outreach, researchers were able to build trust with many of the people at the markets and several
expressed interest in working with Fund 17 in the future. One participant, who owns a cleaning service,
even reached out to Fund 17’s office to inquire about programs after completing the survey.
Latino entrepreneurs may not be reaching out for business support in New Orleans because they were not
accustomed to receiving support for their businesses in their home countries. The survey responses show
that foreign-born participants did not receive assistance in their home countries. For example, 70% of
participants who had businesses in their birth country did not receive any type of business support there.
Only 15% had support from banks and 10% received support from family members. However, none of
the participants received assistance from non-profits or the government. Figure 35 below summarizes the
participant responses.
30Did you receive business support in your home country?
5%
10%
No
15% Bank support
Family support
Prefer not to answer
70%
Fig.35. “Did you receive business support in your home country?”
As observed on Figure 35, the majority of participants that opened a business in their home countries did
not receive any type of business support. This finding could indicate that some Latino entrepreneurs do
not think they can find resources in New Orleans, as they were not familiar with it in their home countries.
Their cultural perception of business assistance could be creating a limitation for Latino entrepreneurs to
reach out for support to existing community partners.
What is Their Desired Level of Business Growth?
Participating entrepreneurs demonstrated varying levels of perceived success. In the survey, success was self-
defined, as researchers were asked to select their level of success from a scale created by the surveyors. As
Figure 36 illustrates, 11% said they were struggling, 53% said they could do better and that there was room
for improvement, 30% had met their main business goals, 8% said their business was very successful. Notably,
none of the referrals from El Centro or HCC said their business was struggling.
31You can also read