LINKING OUTCOMES TO LEVELS OF SERVICE - Waikato District Council March 2021
←
→
Page content transcription
If your browser does not render page correctly, please read the page content below
LINKING OUTCOMES
TO LEVELS OF SERVICE
 Waikato District Council
March 2021

Delivering a clear line of sight from Community
Outcomes to Levels (and Cost) of Service

The Council has developed
a clear and structured way
to discuss and agree the
organisation’s levels of service
(and performance measures)
including how these will drive and
deliver on the Council’s community
outcomes and aspirations. The Council                             POKENO
has leveraged the One Network
Framework approach to provide a
common level of service framework                                      TE KAUWHATA
across all Council infrastructure activities.

                                                                                             HUNTLY
Our Vision:
“Liveable, Thriving,
                                                                      NGARUAWAHIA
Connected Communities”

                                                                           RAGLAN

                  Population:
                   »   82,900 (2020 forecast)

Key economic drivers:
 »   Dairy; Mining; Aggregates;
     Education; Freight and
     logistic industries; Adventure
     tourism and events.

                 Context                                       these cities, however with these benefits comes
                                                               the increased need to invest in supporting
                 » The Waikato district covers more            infrastructure and services.
                than 400,000 hectares and sits
              within the area bounded by Auckland,         »   The District includes a large number of urban
     Hamilton, and Tauranga.                                   centres connected by a vast transport system
                                                               with many rural roads. This mix of urban and
 »   This strategic location means the district benefits       rural can be challenging to develop a framework
     from the economic and population growth of                that supports clear decision making at all levels.
Why we developed                                          Supporting Elected
a new Framework                                           Member buy in and
                                                          decision making
»   The majority of Council measures were technical,
    asset based and low level. There were limited
    measures looking at the bigger (strategic) picture.   The entire framework was developed with
»   This resulted in levels of service that did not       Council’s elected members. The Council team
    support clear and easy to understand decision         took time to step elected members through
    making or drive the right behaviours the Council      each part of the framework, and at each point,
    were looking for.
                                                          sought feedback and direction.
»   There wasn’t a clear line of sight between the
                                                          Examples of how this was achieved included:
    community outcomes the Council were striving
    to achieve and the performance measures from
    which we could gauge successful delivery.             »   Taking appropriate time, with supporting expertise
                                                              and resourcing, to step elected members through
»   We needed a clear and succinct way to discuss             each step of the framework so they could
    levels of service and what this meant for Councils        understand the different elements and inter-
    planning and investment decision making.                  relationships as well as how that then translated
                                                              into decision making and desired results.
                                                          »   Identifying and developing the organisation’s
                                                              levels of service into three specific categories -
                                                              Strategic, Tactical and Operational, to provide
                                                              a more comprehensive set of levels of service
                                                              including clear connection between outcomes,
                                                              levels of service and cost.
                                                          »   Elected members ranked the levels of service
                                                              areas within each of the asset families to give
                                                              the project team clear guidance on what was
                                                              important to the District’s communities.
                                                          »   Developed online access to the draft framework
                                                              and programme so that elected members could
                                                              be hands on and better understand what it was
                                                              and what it helped deliver.
                                                          »   Developed scenarios that showed different levels
                                                              of service and what this will look and feel like to
                                                              the community.
                                                          »   Had clear risk based conversations for each
                                                              scenario to support elected members to better
                                                              understand the pros and cons of each including
                                                              cost implications.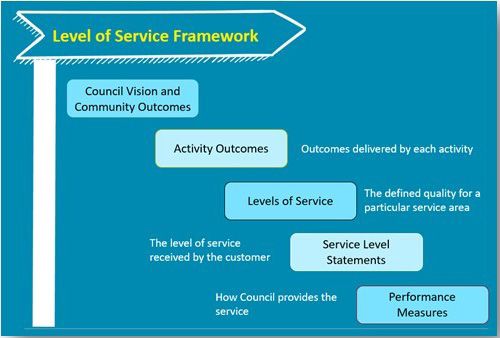
Developing the Framework:
 From Outcomes to Levels of Service

                                        Activity Based Outcomes
Aligning our Community                  Each core Activity has                      One Network Framework
Outcomes                                developed a set of activity                 Application
The Council has developed               specific outcomes to further                The Council transport team
a clear framework outlining             define what the Council seeks               classified their roading network
the relationship and line of            to achieve for the community.               using the One Network
sight between the Councils              The Activity based outcomes                 Framework including identifying
community outcomes, delivery            are aligned to the overall                  the Place and Movement Street
of core activities, level of service,   Council vision and Community                Categories.
performance measures, costs of          Outcomes. The activities
                                        include Transport, Three                    They also identified, using their
service and risk.
                                        Waters, Solid Waste, Libraries,             agreed growth projections,
                                        Property and Open Spaces.                   the future growth impacts and
                                                                                    relevant triggers that could
                                                                                    mean a move to another
                                                                                    classification.
                                                                                    The Council used workshops
                                                                                    with expert staff as well as the
                                                                                    agreed growth projections to
                                                                                    develop this work.

Strategic Alignment -
National / Regional / Local
The Council developed a
clear framework outlining the
relationship and line of sight
between national - regional -
local outcomes, Council core
activities and levels of service.
This helped give confidence
to the elected members and
                                           Levels of Service Categories
investors that the Council was
delivering on government                   To support clarity, and a focused and consistent approach across
expectations, how this aligned             activities, Council structured their levels of service into three categories:
to the Councils community
outcomes, and the supporting                 1. Strategic - Big Picture - Long Term Focus
levels of service and
performance measures to guide                  •   what we need in the future, guides new major investment.
and monitor success.
                                             2. Tactical – Medium - Long Term Focus
                                               •   How are we looking after what we got i.e. the condition, guides
                                                   renewals and/or minor improvements.

                                             3. Operational – Short term - Immediate Focus
                                               •   Maintenance and operations, guides business as usual, contract
                                                   requirements and delivery.

                                           The Council focuses its decision making primarily on Strategic and
                                           Tactical Levels of Service.
                                           Operational Levels of Service are delivered through contract KPIs.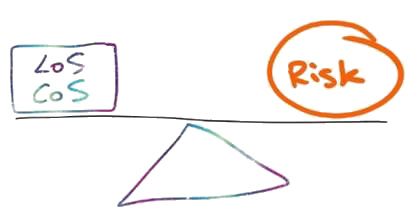
Service Level Statements
Service Level Statements
were developed for each level
of service to support elected
members understanding and
clarity on what the customer
would get.
We worked with elected members
to agree the appropriate level of
service for each asset.

  Resilient Network

  Service level Grade A
  Lifeline routes and their
  catchment roads will remain
  open in a 1:100 year flood event

  Service level Grade B
                                     Scenarios                               Delivery
  Lifeline routes will remain open
                                     Scenarios were developed                The Council has adopted a
  in a 1:100 year flood event
                                     to support direction on the             collaborative contracting model
                                     ‘package’ of levels of service          which brings together Council
  Service level Grade C              Council could invest in, to             staff and the main contractor
  No routes will remain open in a    address the identified level of         into one team ‘Alliance’.
  1:100 year flood event             service gaps.
                                                                             The Alliance delivers on
                                     The scenarios outlined different        Councils contract performance
This approach is supported by        levels of service, what the             framework primarily focused on
an online programme that shows       customer would actually see             the tactical and technical levels
visual representation of each        and the resulting costs and risks       of service, that has a clear
service level including cost and     associated with each.                   line of sight back to Councils
risk profiles.                                                               Long Term Plan and outcomes
                                                                             framework.

Level of Service - Cost
- Risk’ Relationship                 Risk Based Assessment
The framework is designed to         of each Asset Group
show the critical relationship
                                     A risk based assessment was
between levels of service,
                                     undertaken for each asset group
associated costs and resulting                                               Visualisation Tool
                                     within each corridor i.e. road
risks. This means that when                                                  An interactive visualisation tool
                                     surface, footpaths, signage, bins
working with elected members,                                                was developed to support a
                                     and stormwater channels.
there was a clear conversation                                               ‘one stop shop’ for all asset and
at all times about the impacts       The assessment defined the              levels of service information.
of their direction and decision      condition of each asset group
making in terms of what the          within that corridor i.e. excellent -   This programme is a great
community would get, how             good - average - poor - very poor.      tool to allow elected members
much this would cost and the                                                 to get ‘hands on’ and better
                                     This assessment is then linked          understand the different
resulting pros and cons.
                                     to the levels of service in             scenarios and subsequent
                                     terms of what good looks like,          community impacts (pros and
                                     how the assets are currently            cons) of their decision making.
                                     performing, where the relevant
                                     risk areas are, options to
                                     address and relevant costs.
Delivering on the One Network
Framework Objectives
Elected Members
Support strong governance and decision making
to achieve community and Council aspirations
The ONF provides a nationally recognised approach
that elected members can use to translate how they
could address their own District’s challenges and
deliver on their community aspirations.
Council Management Team
Support clear business strategy to meet objectives
and lead organisational performance
The ONF gives our management team a clear line of sight to what
government is looking to invest in through the Districts transport
activities. This has helped guide our organisational strategy,
community outcomes delivery and Long Term Planning processes.
Investment Advisor / Financial Manager
Ensure equitable customer outcomes and investor confidence
The ONF sets a consistent classification with standards and
guidelines for the construction, operation, and maintenance of
roads. This has increased confidence in the Council’s
management of their networks including through
contractual performance indicators and subsequent
costs of service delivery.
Journey Manager / Network Manager
Optimise Journey Experiences
The ONF Place and Movement Street Categories have
helped the Council to further classify the function and
characteristics of different corridors including the
customer journey experiences. The Council has then agreed the
appropriate levels of service to deliver the identified function of each
corridor within the District’s transport system.
Click
Here
For more information contact Ross Bayer, to read the
Waikato
Roading Team Leader on ross.bayer@waidc.govt.nz RCA reporte t o work
u
w e contin s and
s
ce a akeholder ey …’
s p a
h this ty, st rk jou
rn
‘Watc r communi e t w o
u ne N
with o s on our O
r
partneYou can also read