FedEx and Nike Jump On Earnings - Real Investment Advice
←
→
Page content transcription
If your browser does not render page correctly, please read the page content below
FedEx and Nike Jump On Earnings
Quarterly earnings reports from FedEx and Nike were well received on Wall Street. While investors
cheered on FedEx, its report had a bit to be desired from a broader economic viewpoint. For
starters, they are cutting $1 billion in expenses due to a "weaker demand environment." This
follows $2.7 billion in cost cuts announced in September. Further, sales were weaker than
expected, but FedEx was able to offset it with more profit per delivery because of fuel cost
surcharges they are adding to its prices. FedEx reported a net income of $788 million, or $3.07 a
share, compared with $1 billion, or $3.88 a share, in the same quarter last year. Revenue fell to
$22.8 billion, compared with $23.5 billion in the prior-year quarter.
Despite inventory buildup issues, Nike easily beat earnings estimates. The company reported an
EPS of 85 cents a share compared to expectations of 64 cents. Profit margins were better than
expected as the inventory buildup was not as problematic as initially feared. "We believe the
inventory peak is behind us as actions we're taking in the marketplace are working,"- Nike CEO
John Donahoe. Nike is very upbeat about future growth from China as the country exits from its
strict covid protocols.
As shown below, Nike and FedEx are underperforming the S&P 500 year to date.

What To Watch Today

Economy

     8:30 a.m. ET: GDP Annualized, quarter-over-quarter, Q3 Third Estimate (2.9% expected,
     2.9% prior)
     8:30 a.m. ET: Personal Consumption, quarter-over-quarter, Q3 Third Estimate (1.7%
     expected, 1.7% prior)
     8:30 a.m. ET: GDP Price Index, quarter-over-quarter, Q3 Third Estimate (4.3% expected,
     4.3% prior)
8:30 a.m. ET: Core PCE, quarter-over-quarter, Q3 Third Estimate (4.6% expected, 4.6%
     prior)
     8:30 a.m. ET: Initial Jobless Claims, week ended Dec.17 (222,000 expected, 211,000 prior)
     8:30 a.m. ET: Continuing Claims, week ended Dec. 10 (1.678 expected, 1.671 million prior)
     10:00 a.m. ET: Leading Index, November (-0.5% expected, -0.8% prior)
     11:00 a.m. ET: Kansas City Manufacturing Index, October (-7 expected, -6 prior)

Earnings

Market Trading Update

"Here comes Santa Claus," was sung all around Wall Street yesterday as the market rose 1.5%
following the recent selloff post-FOMC meeting. The market failed to rise above the first level of
resistance yesterday at the 50-DMA, so it will be important for the "Santa Rally" the market
continues its advance through the end of the week.
The MACD sell signal remains intact, and volatility has dropped back to 20, which has been a
classic 1-2 punch all year to failed rallies. Remain cautious for now. The market has a LOT of
overhead resistance to work its way through over the next week or so as the year-end approaches.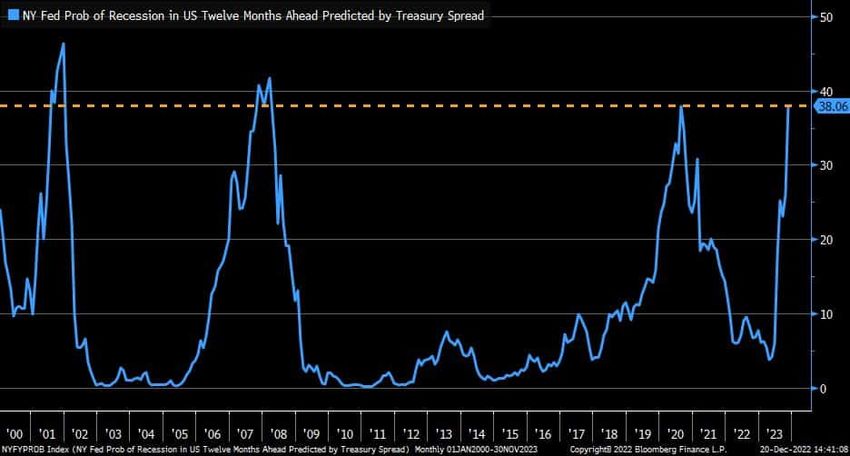
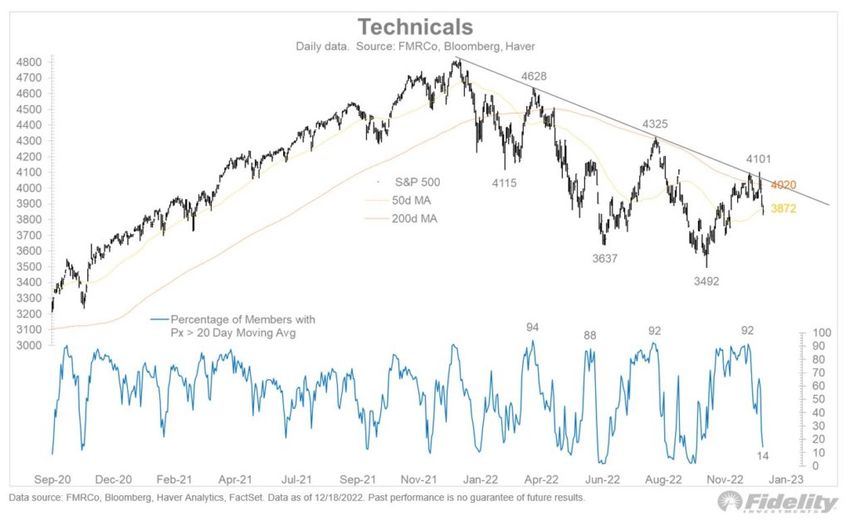
The 20-Day Moving Average Matters

The S&P 500 has been trending lower via a series of smaller upward and downward mini-trends.
Marking the periodic highs has been a dependable line of resistance, as shown below in the
Fidelity graph. As Fidelity points out, another indicator of peaks and troughs has been the
percentage of stocks trading above or below their respective 20-day moving averages. Peaks have
formed when the percentage gets around 90%. Conversely, troughs have occurred around 10%.
The percentage above or below the average can stay extreme for a few weeks before the sub-
trend changes. The graph shows we are potentially nearing another trough based on this indicator.

Fed Rhetoric vs. Fed Research

The Federal Reserve acknowledges a slight chance of a recession in 2023 but is sticking to its
guns and projecting a goldilocks-like soft landing. Interestingly, their rhetoric and research are on
two separate pages. The graph below shows that the New York Fed's recession probability gauge
is already at the same level it was during the brief recession of 2020 and nearly the levels of the
prior two recessions (2001 and 2008). The Fed prefers to share economic forecasts that are
calming to investors, allowing the Fed room to manage monetary policy without having to deal with
panicked investors.
Unfortunately, reality always sinks in. As they always have, investors will eventually figure out when
reality and the Fed projections differ. For our money, we pay close attention to the Fed but also to
the data. The graph below, multiple yield curves, and a host of other data points are screaming a
recession is coming. For more information on some of these indicators, check out our article, The
Foghorn is Blowing.

     The financial foghorn is blowing. Historical odds greatly favor a recession, stock market
     drawdown, and a much lower Fed Funds rate.
The Power of Compounding The graph below from Kailash Concepts serves as a great reminder that slow and steady wins the wealth management race. When investors are asked questions like the one in the graph below, they frequently choose the wrong answer. Compounding wealth is predicated on limiting one's losses during market drawdowns. In most cases, accepting less upside in exchange for less downside is a winning strategy.
Tweet of the Day

Please subscribe to the daily commentary to receive these updates every morning before
the opening bell.
If you found this blog useful, please send it to someone else, share it on social media,
or contact us to set up a meeting.
You can also read