North America Electronic Component Sales Sentiment Proves Resilient and Stable in February and Q1 2022 Results
←
→
Page content transcription
If your browser does not render page correctly, please read the page content below
North America Electronic Component Sales Sentiment Proves Resilient and
Stable in February and Q1 2022 Results
ECIA’s Electronic Component Sales Trend (ECST) February and Q1 2022 Survey Results
Dale Ford, Chief Analyst
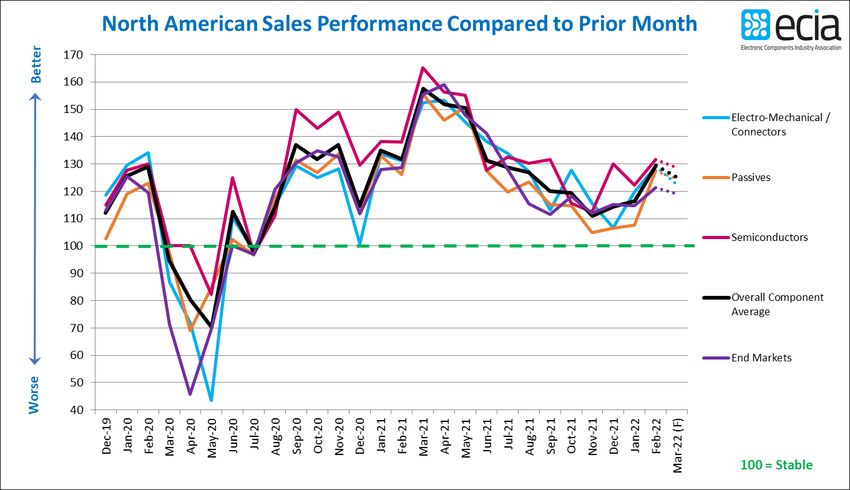
The results of the February 2022 Electronic Component Sales Trend Survey (ECST) delivered a positive
upside from expectations measured in the January Survey. Actual overall sales sentiment for February
registered at 129.4, outperforming expectations by 16.3 points. In an indication of the strength currently
seen by the supply chain, the index only dips slightly down to 125.2 in the outlook for March. The results
for both months is a very encouraging indicator of resilience and stability in the electronics component
markets.
The optimism is uniform across all major component categories with only four points separating
semiconductors on the high end and Electro-Mechanical Components on the low end in both months.
Inductors saw a major jump in positive sentiment as it surpassed even Discrete Semiconductors which
had been an index leader recently. In addition to Inductors and Discrete Semiconductors, Analog/Linear
ICs and Connectors also score notably higher than other subcategories.
Every component subcategory except one achieved a score of at least 125.0. Only Resistors came in
below that level at just under 118. The strength of the market sentiment in the first three months of
2022 shows solid momentum to start the year. The end-market index continues to follow closely the
general trend of the component index. In recent months the average end-market scores have come in
slightly lower than the component index. February’s end-market score came in at 121.3. The difference
is likely due to all market categories being weighed the same in calculating the average whereas the
demand for components varies by end-market.
The robust component sales sentiment in the index continues a strong pattern as it has now registered
above 100 for 19 straight months dating back to August 2020. A comparison between the three groups
surveyed shows a dramatic shift in sentiment among Manufacturers. Compared to their pessimistic
expectations for February, their sentiment for actual February performance came in at the top of all
three groups. This time the Distributors were the most conservative in their report of sentiment for
February. However, less than six points separated the Manufacturers at the top and the Distributors at
the bottom. All three groups see a slight dip in expectations for March. But all still score above 123 in
the coming month. The continued strength of sentiment is impressive considering the continued supply
chain challenges as well as economic concerns. The war on Ukraine by Russia had not commenced by
the end of the survey so the potential impact from that major world development is not captured in this
survey.
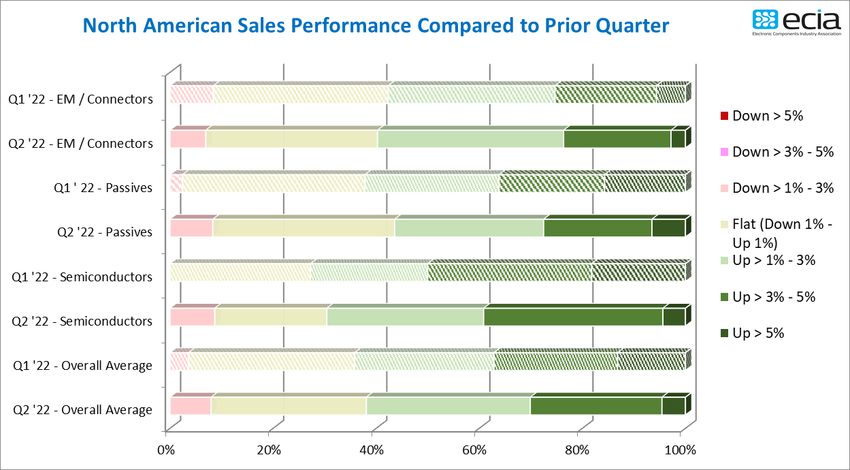
The results of the Quarterly ECST present a strong positive picture for both Q1 and Q2 2022. The overall
average of the total number of respondents expecting growth in Q1 2022 is 64% and only dips slightly to
62% in Q2. However, the mix of expectations for growth in the different tiers shows a shift to lower
growth expectations in Q2 compared to Q1. Bottom line is that there is solid expectation for growth
through the first half of 2022 with growth slowing in the later months. Once again, Semiconductors
measure the highest level of optimism with at least 70% expecting growth in both Q1 and Q2. The
broad-based positive sales growth sentiment reported by these latest surveys is impressive given the
headwinds faced by the industry from many sources.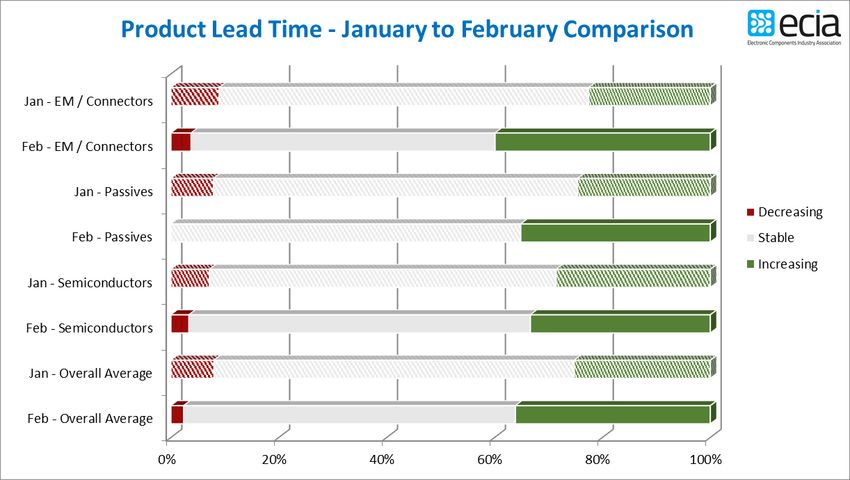
As anticipated in the January survey, Mobile Phones, Computers, and Consumer Electronics registered
weak sales sentiment scores of 100 or less in February. However, in the outlook for March, even these
markets see measurable improvement with scores solidly above 100. Softness in these areas early in the
year reflects a typical seasonal pattern for these markets. Automotive Electronics and Industrial
Electronics both delivered strong sales sentiment above 130. This strong sentiment is sustained by
Automotive Electronics through March while Industrial Electronics, while still strong, drops down just
below 120. Avionics/Military/Space delivers another reliable bright spot as it measures 125 in February
and still comes in above 120 in the March outlook. Medical Electronics and Telecom Networks both
achieved solid sentiment scores in both February and March. Again, this is a very encouraging start to
2022.
Concerns related to the economy have not changed from the last report as inflationary pressures
continue to increase and consumer confidence takes a strong hit. The most recent purchasing manager
index reports still show optimism for growth. But the overall economic picture still leaves room for
concern. The Lehigh University “Supply Chain Risk Index” placed “Economic Concerns” at the top of the
list of potential supply chain risks ahead of “Transportation Disruption Risk” in Q1 2022. “Cybersecurity
and Data Risks” also saw a big jump in the latest index. Certainly, this concern will only be exacerbated
by the potential for hostile Russian activity in this realm. With no end in sight to elevated supply chain
challenges, manufacturers and retailers continue to face an extremely risky and uncertain future.
Common projections for resolving the major supply chain challenges still stretch out into early to mid-
2023.

Lead time data reported by ECIA through January seemed to point to a peak in lead times in December
and January for all Semiconductor categories and many Passive categories. Unfortunately, the latest
ECST survey results see a jump in increased lead time expectations in February. This is a reversal in trend
from what had been seen in the survey over the last few months. It is hoped that this will only be a
temporary increase and lead times can be brought under control in the near future.
The ECST survey provides highly valuable and detailed visibility on industry expectations in the near-
term through the monthly and quarterly surveys. This “immediate” perspective is helpful to participants
up and down the electronics components supply chain. In the long-term, ECIA shares in the optimism for
the future as the continued introduction and market adoption of exciting innovative technologies should
motivate both corporate and consumer demand for next-generation products over a growth cycle that
still appears to have legs to go an extended distance.

The complete ECIA Electronic Component Sales Trends (ECST) Report is delivered to all ECIA members as
well as others who participate in the survey. All participants in the electronics component supply chain
are invited and encouraged to participate in the report so they can see the highly valuable insights
provided by the ECST report. The return on a small investment of time is enormous!

The monthly and quarterly ECST reports present data in detailed tables and figures with multiple
perspectives and covering current sales expectations, sales outlook, product cancellations, product
decommits and product lead times. The data is presented at a detailed level for six major electronic
component categories, six semiconductor subcategories and eight end markets. Also, survey results are
segmented by aggregated responses from manufacturers, distributors, and manufacturer
representatives.
You can also read