Douglas A. Lapp, Ph.D. Department of Mathematics Central Michigan University - Presented at the 2021 Annual Conference - Working ...
←
→
Page content transcription
If your browser does not render page correctly, please read the page content below

Douglas A. Lapp, Ph.D.
                       lapp1da@cmich.edu
                    Department of Mathematics
                    Central Michigan University

Presented at the 2021 Annual Conference – Working Together for Tomorrow,
                        Novi, MI, 17 August 2021
8/17/21

           Zeros & Factoring: Seeing More
                  Than Procedures
                       Douglas A. Lapp, Ph.D.
                     Central Michigan University
                        lapp1da@cmich.edu
                          @DougLappPhD
          https://www.dropbox.com/s/aatsz3yimal7rj4/Factors
           %20%26%20Zeros%20-%20SD%20480p.mov?dl=0
    Presented at the 2021 Annual Conference – Working Together for Tomorrow, 17 August 2021

1

           Transition Among Representations
     • Shifts between concept image and concept
       definition (Tall & Vinner, 1981).
           • Each have an affect on the other as symbolic meaning is
             negotiated.
     • Process of building symbolic meaning is
       mediated by interactions among two worlds
       (the “real” world of physical reality or ideas and
       the world of the symbols that represent these
       ideas. (Kaput, Blanton, & Moreno, 2008; Lapp,
       Ermete, Brackett, & Powell, 2013; Lapp & Cyrus,
       2000)

    Presented at the 2021 Annual Conference – Working Together for Tomorrow, 17 August 2021

2

                                                           B
                                                                                              A
                              Mediated But Raw                       Mediated Experience in
                                Representations                            the World
                          (Oral, Written, Drawn, etc.)              (Of Phenomena or Math)

 Repeatedly                                    Analyzed & Communicated
   Refined
Pedagogically           C     Refined & More
 Shaped &                       Systematic
 Influenced                       Physical                                        AB
                              Representations
                                                   Analyzed & Communicated

                                                                 AC

                                                       !
    Presented at the 2021 Annual Conference – Working Together for Tomorrow, 17 August 2021

3

                                                                                                       1
8/17/21

                              Mediated But Raw
                                                              B
                                Representations
                          (Oral, Written, Drawn, etc.)
                                                                                                   A
                                                                      Mediated Experience in
                                                                            the World
                                       Analyzed & Communicated
                                                                     (Of Phenomena or Math)

 Repeatedly
   Refined                    Refined & More
                                                          C
Pedagogically                Systematic Physical
 Shaped &                     Representations                     AD
 Influenced
                                                                   AC
                                                      D
                              More or Less                                                    AB
                              Conventional           Further Analysis
                             Representations

    Continuing the process of symbolization Kaput, Blanton, & Moreno (2008)

    Presented at the 2021 Annual Conference – Working Together for Tomorrow, 17 August 2021

4

       What Makes Active Learning “Active”?
     • Students share control
       of the learning process.
           • Make decisions about
             what to do
           • Real World applications
             (not just word problems)
           • Debate the
             reasonableness of ideas
           • Justification of
             claims/observations

    Presented at the 2021 Annual Conference – Working Together for Tomorrow, 17 August 2021

5

       What Makes Active Learning “Active”?
 • Teachers act as
   diagnosticians
   and not as the
   sole conveyers
   of knowledge.
        • Teacher as
          reflective
          listener
        • Teacher as
          orchestrator

    Presented at the 2021 Annual Conference – Working Together for Tomorrow, 17 August 2021

6

                                                                                                            2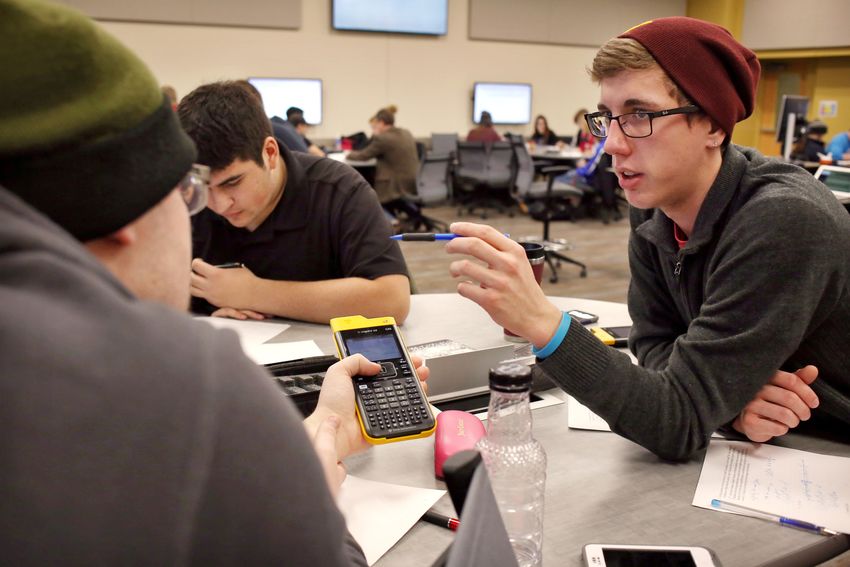
8/17/21

       What Facilitates an Active Classroom?
      Thought provoking questions requiring more than a
      simple response.
    • Opening
      Discussion
      Questions

    • Labs/Activities
      for deep and
      detailed
      exploration

    Presented at the 2021 Annual Conference – Working Together for Tomorrow, 17 August 2021

7

       What Facilitates an Active Classroom?
• Physical layout of the
  room
   • Teacher not in
     front
   • Students in tables
     for discussion
   • Student Grouping

    Presented at the 2021 Annual Conference – Working Together for Tomorrow, 17 August 2021

8

       What Facilitates an Active Classroom?
      Opportunity for reporting out observations/claims.
• Within working
  groups (safe
  environment to
  share)

• Whole class
  (after group
  has discussed)

    Presented at the 2021 Annual Conference – Working Together for Tomorrow, 17 August 2021

9

                                                                                                   3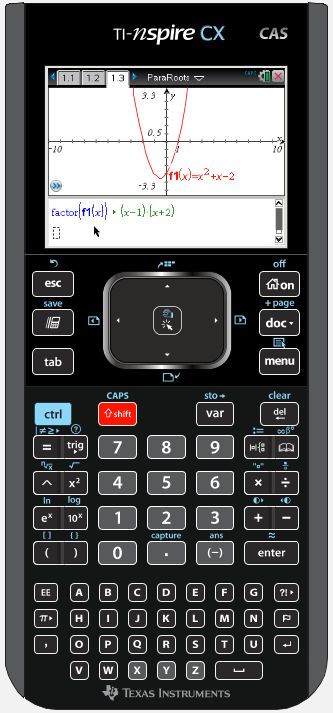
8/17/21

                    Home Run Derby
             (Authentic Problems to Motivate)

 Presented at the 2021 Annual Conference – Working Together for Tomorrow, 17 August 2021

10

                              Home Run Derby
       Suppose we want to know how far the
       softball was hit and predict how far from
       home plate the ball landed given only
       this small portion of the video. Discuss
       in your groups the following questions.
       • What questions might we need to ask?
       • How might we collect data to answer
         these questions?

 Presented at the 2021 Annual Conference – Working Together for Tomorrow, 17 August 2021

11

                              Home Run Derby
       Discuss in your groups the following
       questions.
       • What are some possible mathematical
         models we could use to describe the
         path of the ball?
       • Based on data we have collected, what
         are some ways we could find a specific
         model to fit our data?
       • Once we have a model, how would we
         determine when it hit the ground?
 Presented at the 2021 Annual Conference – Working Together for Tomorrow, 17 August 2021

12

                                                                                                4
8/17/21
Transition Among Representations
• Once we have
motivated the need
for a process for
finding zeros, we
need to help students
connect various
representations in
order for them to see
the power of
factoring in this
process. (Lapp,
Ermete, Brackett, &
Powell, 2013; Lapp &
Cyrus, 2000)
Presented at the 2021 Annual Conference – Working Together for Tomorrow, 17 August 2021
13
Transition Among Representations
• The same exploration
we can do with the
TI-Nspire CX CAS can
also be accomplished
with free technology
such as Photomath or
Wolfram Alpha
(although not as
dynamically).
Presented at the 2021 Annual Conference – Working Together for Tomorrow, 17 August 2021
14
5Parabolas and Roots: Graphs & CAS Materials • TI-Nspire™ CAS handheld Introduction to the Investigation In this activity, you will use both algebraic and graphical representations simultaneously to solve quadratic equations and make observations about the graphs and symbolic form of the equations. In addition, you will make use of the Computer Algebra System (CAS) built into the TI-Nspire™ CAS handheld to look for patterns across the representations. One way the CAS is useful is that it enables you to see more than one representation of mathematical ideas on the same page allowing you to see how changes in one representation influence the changes in another representation. For example, we could have a graphical and symbolic representation of a parabola on the same page. Take the function f (x) = x 2 −1 pictured below. Here we can see both the graph and the factored form of the function’s algebraic expression on the same page. ©2012 Dr. Douglas A. Lapp Page 1
Parabolas and Roots: Graphs & CAS

Steps

Consider the function, f (x) = x 2 + x − 2 .

1. Open the ParaRoots.tns document.
    •   This file has a split screen with a Notes page on the bottom with the factored form of the
        equation and a Graphs page on the top.
2. First, label the x-intercepts of the equation so that you can see them as you explore the
   activity.
    •   To do this, press b and select the Points & Lines submenu and choose
        3:Intersection Point(s). Click on the parabola and then the x-axis. This will place a
        point at the intersection of the parabola and the axis. To see the coordinates of the x-
        intercepts, choose 7:Coordinates and Equations from the Actions submenu and click
        on each of the intersection points.

Explore:
You are free to change any of the representations on the Graphs pane of the page found at the
top, whether it is the graph itself or the symbolic representation of the function. As you change
one representation of the function, everything else will change to match the alterations you have
made. You can change the graph by either editing the expression for the function or by pulling
and manipulating the graph itself.

3. Take some time to explore the situation by manipulating the function, jotting down anything
   you discover or find interesting as you explore. Don’t forget to include some rough sketches
   in the spaces provided on the next page. (If you need more room there are four more panes
   on the last page of this handout.

©2012 Dr. Douglas A. Lapp                      Page 2
Parabolas and Roots: Graphs & CAS ✎ Sketch your screens below: ✎ Record your observations below: Focused Questions: Describe patterns you noticed while manipulating the graph. ©2012 Dr. Douglas A. Lapp Page 3
Parabolas and Roots: Graphs & CAS

Describe parts of the graph and factored form of the function that appeared to be related no
matter how you manipulated the graph.

When you pull the graph above the x-axis, describe what happens to the factorization.

Make a hypothesis about any connections you see between the factored form of the function
and the features found on the graph.

For each of the x-intercepts shown on the graph, describe what you notice when the x-
coordinate is plugged into the factored form of the function. Be specific here and explain what
happens to each factor as well as the resulting product. Explain how your observations are
related to the features on the graph.

©2012 Dr. Douglas A. Lapp                    Page 4
You can also read


