2020 Election Results - November 7, 2020 | 4:30 PM ET Doug Sosnik

Page created by Megan Castillo
 
CONTINUE READING
2020 Election Results - November 7, 2020 | 4:30 PM ET Doug Sosnik
2020 Election Results

    November 7, 2020 | 4:30 PM ET

Doug Sosnik
2020 Election Results - November 7, 2020 | 4:30 PM ET Doug Sosnik
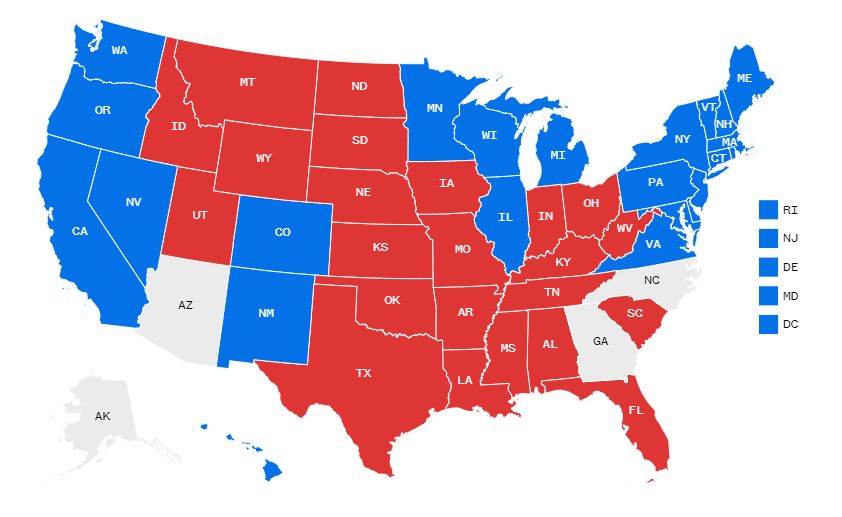
2020 Election Results—A Divided Government*
▪     It is projected that voters cast more than 160 million votes—the highest number of votes cast in
      American history.
▪     Class and race are the new political fault lines in America.
▪     America entered this election as a divided country and remains so.
▪     Biden's victory came from strong support with women, young, non-white, suburban and
      college-educated voters while narrowing margins in small towns and rural areas.
▪     Biden’s victory was not based on the Obama coalition. Trump’s victory in 2016 relied on flipping
      counties Obama won in 2012. Trump carried these counties again in 2020 (all 31 counties in
      Iowa, 21 out of 23 counties in Wisconsin).
▪     Trump’s victory in 2016 was not a one-off event, but rather a deeply embedded reality of
      current American politics.
▪     Trump and Republican’s improved performance with Hispanic voters could reshape American
      politics.

*Pending the resolution of the 2 Senate runoffs in Georgia on January 5, 2020                            2
Republicans are Favored to Maintain Control of the Senate and
Make Gains in the House
▪   Three factors contributed to Republicans’ success: Justice Amy Coney Barrett’s appointment
    nationalized the Senate elections, Law and Order and “Democrats are associated with
    Socialists” messaging was effective.
▪   Republicans are favored to maintain control of the Senate by a 50-to-48 margin.
▪   There is a runoff for two Senate seats in Georgia on January 5, 2021 and Republicans are
    favored to win both seats.
▪   Republicans only lost a net of one seat despite defending ten vulnerable incumbents.
▪   NBC News projects Republicans will pick up 13 seats in the House, leaving the Democrats a
    majority of at least 7 seats, the narrowest majority in 18 years.
▪   There are now a record number of Republican women in Congress. There will be at least 13
    new Republican women in the House, bringing their total to 33 in their caucus.
▪   The newly elected Republican women won 6 of the 8 seats where Democratic incumbents were
    defeated.
                                                                                                 3
2020 Presidential Election

                             4
Largest Voter Turnout in Over a Century
75.00%      74%

70.00%
                                                                                                                                                                    67%
                              66%
65.00%           66%                                                                        64%
                                                                      62%       62%               63% 63%
                                          62%
                                                                61%                                                                                    62%
                                                                                                                                                 60%
60.00%                                                                                                                                                             60%
                                                                                                                                     58%
                                   59%                  57%                           60%
                                                                                                                                                             59%
                                                                                                       56%   55%         55%
55.00%                                                        57%       56%
                                                                                                                                                 54%
                                                                                                                   54%
                                                                                                                               53%
                                                                              52%                                                          52%
50.00%
                                             49%
                                                       49%

45.00%

40.00%
             1900 1904 1908 1912 1916 1920 1924 1928 1932 1936 1940 1944 1948 1952 1956 1960 1964 1968 1972 1976 1980 1984 1988 1992 1996 2000 2004 2008 2012 2016 2020

Source: Statista; U.S. Elections Project, 12/14/2018                                                                                                                     5
Historically, Job Approval has Accurately Tracked the Incumbent’s
    Share of the Popular Vote

                                                 Candidates                                                           October Job                                    Incumbent Share of
           Year
                                           (Incumbent – Challenger)                                                  Approval Figure                                    Popular Vote

           1984                                  Reagan (R) – Mondale (D)                                                        58%                                        58.8%

            1992                                    Bush (R) – Clinton (D)                                                       40%                                        37.4%

            1996                                    Clinton (D) – Dole (R)                                                       53%                                        49.2%

           2004                                      Bush (R) – Kerry (D)                                                        49%                                        50.7%

            2012                                 Obama (D) – Romney (R)                                                          49%                                        51.1%

           2020                                    Trump (R) – Biden (D)                                                         45%                                        47.7%*

1984 Source: Gallup; Among Adults | 1992-2012 Source: The NBC/WSJ Poll; among Registered Voters in 1992 and 1996, among Likely Voters in 2004 and 2012 | *NBC News - 11/7                 6
Presidential Race Results 2012-2020

    Year                       Candidates   Electoral Votes   Popular Vote   % of Vote

                                   Biden        279*          74,488,666*    50.5%*
 2020
                                  Trump         214*          70,337,285*    47.7%*
                                  Trump          306          62,985,106     45.9%
  2016
                                 Clinton         232          65,853,625      48%

  2012                           Obama           332          62,611,250      51.4%
                                 Romney          206          59,134,475     48.6%

*Partial Result as of 11/7/20 - 13:30ET

                                                                                         7
Electoral Map as of November 7, 2020 at 4:30 PM ET

                                                        PATH TO 270

                                                             279
                                                               BIDEN

                                                            Pending
                                                             NC 15    GA 16
                                                             AK 3     AZ 11

                                                              214
                                                              TRUMP

    Not called
Source: NBC News 11/7                                                         8
Congressional Results: Divided
Government
Republicans favored to maintain control of the Senate while Democrats keep the House.

                                                                                        9
Republicans Hold a 50/48 Lead
   Runoff for 2 Georgia seats on January 5, 2020

                                                   Republican
                                                   Democrat
                                                   Republican + Democrat
                                                   Independent
                                                   Runoff

Source: NBC News 11/7                                                      10
Democrats Retain Control of the House with the Smallest
   Majority in 18 Years

                                                         Republican
                                                         Democrat
                                                         Not called

Source: NBC News 11/7                                                 11
Exit Polls From the 2020 Election

                                    12
Significant Gender Differences Continue in American Politics

                           Group    Turnout              How They Voted

                                      % of
                           Gender                Trump                    Biden
                                    2020 Total

                            Men       47%        52%                      46%

                         Women        53%        44%                      55%

Source: 2020 AP VoteCast Survey                                                   13
Whites Increased Their Total Vote Share
   Trump significantly improved his share of Hispanic vote.

                           Group    Turnout                     How They Voted

                                      % of
                             Race                       Trump                    Biden
                                    2020 Total

                           White      74%               55%                      43%

                         Hispanic     10%               35%                      63%

                           Black      11%                8%                      90%

                           Asian       2%               28%                      70%

Source: 2020 AP VoteCast Survey                                                          14
Hispanic Vote By Battleground State

              Hispanic Voters        Turnout                How They Voted

                       State      % of 2020 Total   Trump       Biden         Margin

                    Arizona            19%          39%         46%          +7 Biden

                     Florida           19%          45%         54%          +9 Biden

                      Texas           23%           37%         62%          +25 Biden

                    Nevada             19%          43%         53%          +10 Biden

Source: 2020 AP VoteCast Survey                                                          15
Biden Made Gains with Educated Voters
   Trump continued to run strong with non-college educated voters, although Biden
   narrowed the margin.

                           Group                      Turnout              How They Voted

                                                        % of
                         Education                                 Trump                    Biden
                                                      2020 Total

                            White College Women         14%        39%                      59%

                     White Non-College Women            24%        60%                      39%

                                  White College Men     16%        52%                      46%

                          White Non-College Men         19%        64%                      34%

Source: 2020 AP VoteCast Survey                                                                     16
Biden Gained Among Young People; Closed the Margin for
   Older Voters

                           Group    Turnout              How They Voted

                                      % of
                             Age                 Trump                    Biden
                                    2020 Total

                            18-29     13%        36%                      61%

                            30-44     23%        43%                      54%

                            45-64     36%        51%                      48%

                             65+      27%        51%                      48%

Source: 2020 AP VoteCast Survey                                                   17
Party Support Remained Strong for Biden and Trump
    Biden won Independents by 14 points.

                           Group     Turnout              How They Voted

                                       % of
                             Party                Trump                    Biden
                                     2020 Total

                       Republican      47%        91%                      8%

                        Democrat       48%         4%                      95%

                      Independent       5%        37%                      51%

Source: 2020 AP VoteCast Survey                                                    18
Biden Carried Suburban Voters by 10 Points
   Rural turnout was up with Biden narrowing losses.

                           Group     Turnout                   How They Voted

                                       % of
                       Urban/Rural                     Trump                    Biden
                                     2020 Total

                        Suburban       21%             44%                      54%

                           Urban       45%             33%                      65%

                       Small Town      17%             55%                      43%

                           Rural       18%             65%                      33%

Source: 2020 AP VoteCast Survey                                                         19
Appendix
Vote Counting Process
                                                                                                                  Candidate                                             Recount
                       Ballot    Certification   Automatic                                                                                                                           Recount
    State                                                                    Margin Required                      Requested                 Conditions                  Request
                      Deadline      Date         Recount?                                                                                                                            Deadline
                                                                                                                   Recount?                                             Deadline

                                                                                                                              Margin between candidates is less
 Georgia                11/3         11/20          No       N/A                                                     Yes                                                 11/22          N/A
                                                                                                                              than or equal to 0.5%

                                                                                                                              Three voters of each election district
 Pennsylvania           11/6         11/23          Yes      Less than or equal to 0.5%                              Yes                                                 11/28          N/A
                                                                                                                              must request the recount.

                                                                                                                                                                                   +39 days after
 Michigan               11/3         11/23          Yes      Less than or equal to 2,000 votes                       Yes      Presidential race                          11/25
                                                                                                                                                                                   recount begins
                                                                                                                              The difference between the votes for
                                                             If election officials discover a substantial error               the requester and the winning
 North                                                                                                                                                                              +5 days after
                        11/12        11/24          No       while conducting a random-sample partial                Yes      candidate is less than or equal to         11/26
 Carolina                                                                                                                                                                          recount begins
                                                             recount as part of a requested recount.                          10,000 votes or 0.5% of the votes cast,
                                                                                                                              whichever is less.

                                                             Less than or equal to:

                                                             1. 1/10 of 1% of the number of votes cast for both
 Arizona                11/3         11/30          Yes      such candidates                                         No       N/A                                         N/A           N/A
                                                             2. 200 votes in the case of an office to be filled
                                                             by state electors and for which the total number
                                                             of votes cast is more than 25,000

                                                                                                                                                                                    +10 days after
 Nevada                 11/10        12/01          No       N/A                                                     Yes      N/A                                        12/06
                                                                                                                                                                                   recount begins
                                                                                                                              Trails the leading candidate by no                   +13 days after
 Wisconsin              11/3         12/01          No       N/A                                                     Yes      more than 1% of the total votes cast        12/2       recount is
                                                                                                                              for the office.                                         ordered

Source: Ballotpedia                                                                                                                                                                                 21
Process and Timing to Determine the Winner in Electoral
   College Voting

                                                      Deadline for the United    Congress Meets in Joint
                      Deadline for Resolving          States Senate to Receive    Session to Count the         New President
                        Election Disputes                 Electors’ Ballots         Electoral Ballots           is Sworn In
                              Dec. 8                            Dec. 23                  Jan. 6                      Jan. 20

                                       December                                                            January

                                   Electoral College Electors
                                      Meet in Each State
                                            Dec. 14

Source: Ballotpedia                                                                                                            22
You can also read