Nonprofit Cloud Reporting & Analytics - Drive analytics, visualizations, and intelligence across your organization.
←
→
Page content transcription
If your browser does not render page correctly, please read the page content below

SOLUTION SNAPSHOT

Nonprofit Cloud Reporting
& Analytics
Drive analytics, visualizations, and intelligence across your organization.

SOLUTION SNAPSHOT
Introduction
The role of nonprofits has never been more critical in society as demand
for services and desire for involvement in mission work increases. But,
many times nonprofits don’t have the data they need to make effective
decisions quickly, and have less and less time to prepare reports and to
visualize data.
With the right data visualized clearly, fundraising teams can see where
they should focus their efforts, and donors can understand the impact of
their gifts — marketers can measure return on campaigns and supporters
know their efforts are making a difference — programs teams know where
they should spend resources, and clients know how they are progressing.
Having the right tools to visualize your data can make all the difference in
how quickly and effectively your day-to-day information becomes insights
you can use to further your mission.
Let’s take a closer look
2
SOLUTION SNAPSHOT

                                            Empower Your People Make Data
                                                     Work for You
                    Data should be accessible so that each team and individual can do their job productively and be part of
                     a Data-driven culture that allows all your staff, partners and even supporters to lead with confidence.

                      An inaccurate metric degrades trust in a board or supporter meeting, but the right one can get your
                    program or project funded. Lack of data can hold nonprofits back from making important decisions, but
                                    the right decisions can be very impactful for an organization's mission.

                     Go from Lack of Data                                                                To Clear Direction

                                                                                                                               3
SOLUTION SNAPSHOT

Democratized, Accessible Data
The data revolution is here

The Nonprofit Success Pack (NPSP) was built for, and with,         NPSP Reports & Dashboards

our community to turn the #1 CRM for businesses into a
Constituent Relationship Management system for nonprofits.
On top of this foundation for data, nonprofits of all sizes
and people of varying technical skills can leverage data
to drive decisions.

This guide reviews basic reports and dashboards on NPSP,
Intelligence, Business Intelligence (B.I.) with Tableau, and
trends and even Artificial Intelligence (A.I.) with Tableau CRM.

Across all you gain:
Instant access to answers and be self-sufficient with
prebuilt reports and templates, or build your own!

Cloud collaboration to share, subscribe and comment on.
Tableau is even available on desktop too.

Mobile apps to check on key metrics, drive insights,
and collaborate on data anywhere.

Data security is no longer a nice to have, it’s part of your
responsibility to ensure you are stewards of your most
valuable and sensitive information. Your constituents trusted                                      Intelligence

data is secure and only viewable by those that should have it.
                                                                         Tableau and Tableau CRM

                                                                                                                  4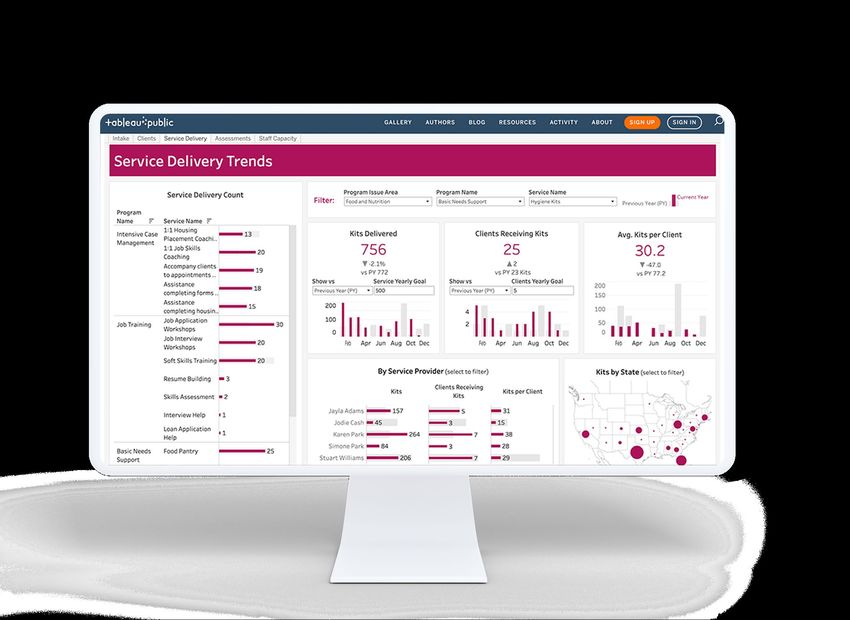
SOLUTION SNAPSHOT

                    Reports & Dashboards with
                    Nonprofit Success Pack (NPSP)
                    Save time, show & share the data

                    With Salesforce, you can build customizable reports and dashboards to
                    analyze your data in any way. But to make it even easier for nonprofits,
                    the Salesforce.org team has built over 70 industry reports and
                    dashboards that are ready to use in the Nonprofit Success Pack (NPSP).
                    Use them as is, or easily and quickly customize them with Report
                    Builder, to meet your specific and every need.

                    Dashboards take your reports a step further and pull data from
                    dedicated reports so you can view all data in one place and all in one
                    view. These out-of-the-box reports facilitate the monitoring of giving
                    trends, forecast based on open opportunities, and analyze campaign
                    ROI stats.

                    What are some of the great reports and dashboards that exist in NPSP?

                    LYBUNT
                    Understand who has given in the past or may need a nudge to
                    donate this year.

                    Memberships
                    View all memberships over the life of your organization by membership
                    join date.

                    10% Projection Report
                    Quickly see an ask projection based on a percentage increase.

                    Reports can even have dynamic math fields to crunch the numbers for
                    you! Staff can also instantly see custom rollups summaries, and quickly
                    create dynamic lists of information filtered and sorted to their liking.

                                                                                          5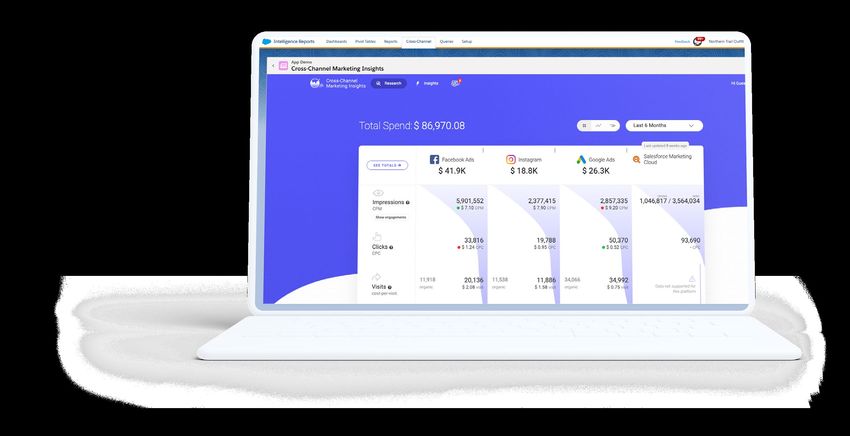
SOLUTION SNAPSHOT
Marketing Cloud Intelligence
All of your marketing data in one place
Marketing Cloud Intelligence unifies every channel you have,
from social to web to email, and captures all of the data you
need to understand the effectiveness of your marketing, and
then shows it to you in beautiful, easy-to-use, interactive
dashboards. Now you can know what channels are performing
best across all of your efforts, make data-driven decisions, and
make a greater impact.
Connect All Of Your Data
Link more than 150 sites and systems to centralize your
advertising, marketing, CRM, social and any other data (on any
platform!) into one place.
See Instant Campaign Performance
What if you could see all of the data — including donation
amount — by every email, every journey and every campaign.
It all shows up instantly in an out of the box dashboard
in Intelligence.
Communicate Internally with Custom, Automated Reports
Whether it's your leadership team, marketing, social,
communications — really any team in your organization — you
can set-up automated reports.
Be Agile and Innovative
Leverage data and insight to test, learn and innovate across all
your marketing.
6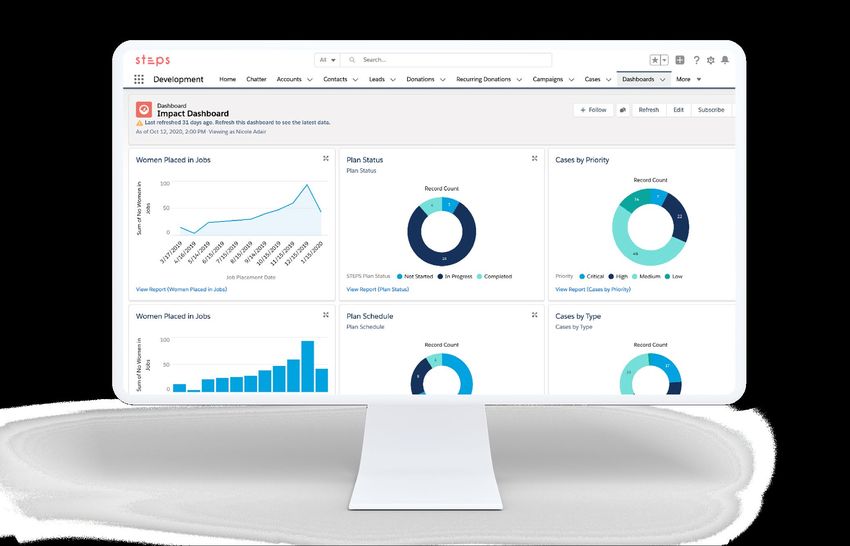
SOLUTION SNAPSHOT

                    Tableau
                    Find easy answers to hard questions

                    As the market-leading choice for modern business intelligence,
                    the Tableau platform is known for taking any kind of data from
                    almost any system, and turning it into actionable insights with
                    speed and ease. It’s as simple as dragging and dropping to prep,
                    visualize, and share your data.

                    •   Unify sources of data and your existing systems on the world’s
                        most flexible self-service analytics platform

                    •   Make data easy with intuitive drag-and-drop analysis to quickly
                        spot patterns and reveal those eureka opportunities

                    •   Act collaboratively and securely share dashboards seamlessly
                        across teams with alerts and embed analytics in apps

                    •   Gain data confidence knowing you’re using the most trusted,
                        up-to-date data and know which data sources are best

                    Best of all, it’s great for nonprofits, learn more here.

                                                                                          7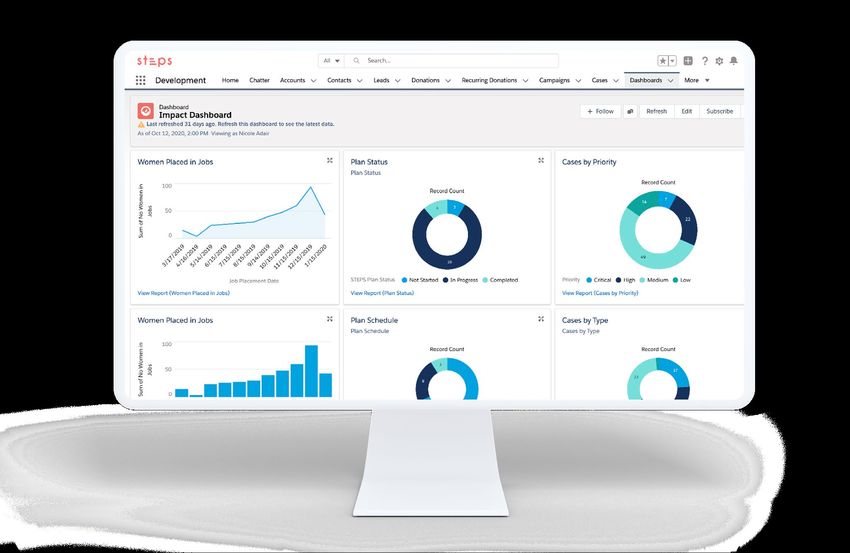
SOLUTION SNAPSHOT

Tableau Accelerators for
Nonprofit Fundraising
Unlock the power of fundraising data

The Tableau Accelerators for Nonprofit Fundraising are designed
to help you hit the ground running with actionable data on
revenue and donors in minutes. In just a few clicks, you’ll be able
to connect to the Nonprofit Success Pack to create beautiful,
data-rich dashboards seamlessly:

•   Gain insights into revenue performance over time and quickly
    understand trends for forecasts

•   Compare key statistics on statistics around new, retained,
    reactivated, recurring, and lapsed donors

•   Benchmark campaigns that drive the most revenue, and derive
    campaign trends over time

•   Confidently use data to drive decisions to shift strategy and
    align your team to execute

•   Expand usage to other departments and connect with
    other applications.

Download all the Tableau Accelerators.

                                                                      8
SOLUTION SNAPSHOT

                    Tableau Accelerators for Nonprofit
                    Program Management
                    Unlock the power of service delivery data

                    The Tableau Accelerators for Nonprofit Program Management
                    are designed to help you hit the ground running with actionable
                    data on service delivery, client enrollment and participation,
                    intake, staff capacity and more. In just a few clicks, you’ll be able
                    to connect to the Program Management Module and Nonprofit
                    Cloud Case Management to create beautiful, data-rich
                    dashboards seamlessly:

                    •   Gain insights and understand trends around service delivery

                    •   Understand staff capacity and client intake limitations

                    •   View client participation enrollment over time

                    •   Confidently use data to drive decisions

                    Download all the Tableau Accelerators.

                                                                                            9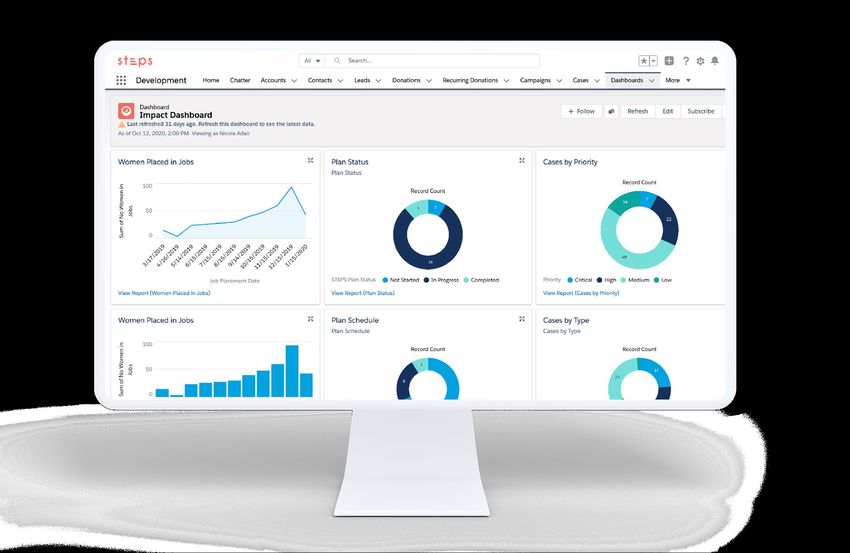
SOLUTION SNAPSHOT

Tableau CRM
(Formerly Einstein Analytics)
Analytics right in Nonprofit Cloud

Tableau CRM helps you spot opportunities, predict outcomes, get
recommendations, and more with tight integration to Salesforce’s
reports, objects, and collaboration features.

•   Automate data discovery to find out what happened, why it
    happened, what will happen, and what to do about it

•   Drive performance and achieve all of your goals with precise
    recommendations and specific guidance

•   Take instant action from Nonprofit Cloud to collaborate in
    Chatter, update records, and share dashboards

•   Build with clicks interactive, branded dashboards, or use
    Einstein to build complex A.I. models

Check out our dashboard templates, the Fundraising
Performance and Analytics Dashboard Templates.

                                                                   10
SOLUTION SNAPSHOT
Data-Driven Nonprofits
Trailblazers leading the data revolution
Our customer’s have transformed the way the
think about the value of, and how they use data.
“Because we have multiple fundraising programs “As we had digitized our mission, we were able to make
it’s important to know where our revenue is coming decisions and productively shift in 2020, with the time,
from and where we find the most success in our space, and focus to learn new technologies. We had
efforts. The reporting functionality in the Nonprofit already used Tableau to understand program impact,
Success Pack allows us to be really strategic and and were able to quickly deploy Tableau Starter
targeted in our fundraising strategy.” Dashboards for Fundraising to now be able unlock our
donor data, forecast more effectively, and visualize
Melanie Bricker
revenue performance.”
Director of Development Services,
Furniture Bank
Eric Dayton
buildOn
11SOLUTION SNAPSHOT
Deciding on Technology
Insights for every organization and occasion FPO
So the question you might be asking yourself is, which do I use?
There are a few things to take into consideration when selecting
the right tool for the job, and many customers use more than one
(like buildOn). The benefit is you have choices, and they’re all great.
If you haven’t used reports or dashboards, start there to learn what
kind of data you need. However, many customers hit a wall and
want more power. If you’re focused on end users and CRM
integration or A.I., Tableau CRM is perfect. If you’re looking for
more of a B.I. tool across departments and systems, Tableau is
better to start with. See the next page for details.
12SOLUTION SNAPSHOT Tools and Solutions
Capability Reports Dashboards Tableau CRM Tableau
Accessibility
Cloud Based Cloud Cloud Cloud Cloud or On-Premise
Mobile App
Data Sources & Connection
Reporting on CRM Data
Reporting on Data Across Systems
Data & System Connections CRM CRM 22+ and growing 70+ Connectors
Data Refresh Instant Instant Last data set refresh Last extract
Reporting & Analytics
Static Visualization of Data
Interactive Visualization & Trending
Templates and Starters NPSP 60+ NPSP 60+
Fundraising Templates
Programs Templates
CRM Integration & Artificial Intelligence (A.I.)
Embedded in NPSP & Salesforce Widgets
CRM Clicks & Action Framework Native Native Native Not Native
Embed in Public Facing Properties
Embed in Experience Cloud
Embed in Quip
A.I. Predictions
Have questions? Contact our Account Team
Get more info on Marketing Cloud Intelligence here
13Learn more about Salesforce
Nonprofit Cloud
Learn more
© Copyright 2022, Salesforce.com, Inc. All rights reserved.You can also read