NASA satellites analyze Typhoon Bopha inside and out
←
→
Page content transcription
If your browser does not render page correctly, please read the page content below
NASA satellites analyze Typhoon Bopha
inside and out
5 December 2012
According to Reuters news reports on Dec. 5, at
least at total of 283 people were killed and
hundreds remain missing in the Philippines. The
hardest-hit province in Mindanao was Compostela,
where flood waters and mudslides swept through
the town and killed at least 150 people. Homes
were destroyed, roads were flooded and washed
out, and it was estimated that as much as 80
percent of plantations were destroyed.
The MODIS instrument aboard NASA's Aqua satellite
captured this visible image of Typhoon Bopha moving
over Palawan and entering the South China Sea on Dec.
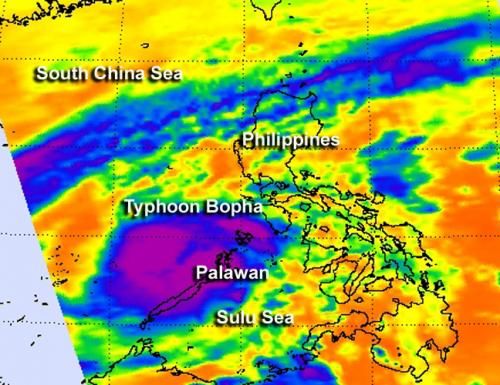
NASA's Aqua satellite's AIRS instrument captured this
5 at 05:20 UTC (12:20 a.m. EST, U.S.). Credit: NASA
infrared view of Typhoon Bopha's cloud-top temperatures
Goddard's MODIS Rapid Response Team
on Dec. 5 at 0517 UTC (12:17 a.m. EST) as it was exiting
Palawan and moving into the South China Sea. The
purple areas indicate bitterly cold cloud-top temperatures
of 210 kelvin (-63C/-81F) and are areas of the strongest
Typhoon Bopha proved deadly to residents in the thunderstorms, with highest cloud tops, and heaviest
Mindanao region of the Philippines after ravaging rainfall. Credit: NASA JPL, Ed Olsen
islands in Micronesia. NASA's Aqua and TRMM
satellites peered at the storm inside and out,
providing forecasters with valuable data as the
storm moved into the South China Sea. On Dec. 2, 2012, NASA and the Japanese Space
Agency's Tropical Rainfall Measuring Mission
On Dec. 5, 2012, Bopha crossed over Palawan (TRMM) satellite passed over Super Typhoon
and entered the South China Sea after crossing Bopha. Data from the overpass was used to create
over the southern Philippines' Mindanao region, a 3-D image that showed that the inner eyewall was
leaving death and destruction in its wake. being replaced by an outer eyewall, something that
1/3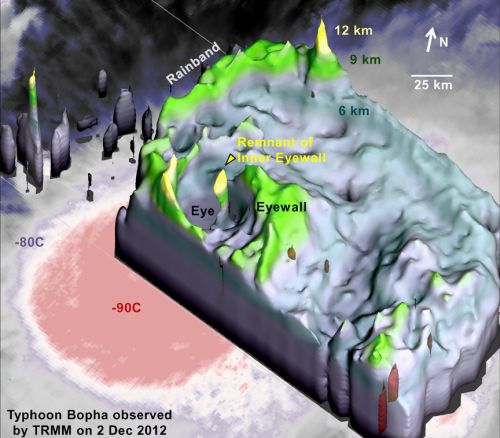
typically happens in major typhoons. There was alsoindicates that whenever a "hot tower" is spotted in a
 a "hot tower" thunderstorm reaching 12 kilometers tropical cyclone, the storm usually intensifies within 6
 (7.4 miles) high, located north of the center of     hours. The graphic also indicates where the highest,
 circulation. NASA research indicates that whenever most powerful thunderstorms were around the center by
                                                      the rounded area indicating cloud top temperatures of -90
 a "hot tower" is spotted in a tropical cyclone, the
                                                      Celsius. Credit: NASA/SSAI, Hal Pierce
 storm usually intensifies within 6 hours. The data
 also indicated the highest, most powerful
 thunderstorms were around the center where cloud
 top temperatures were as cold as -90 Celsius
                                                      Three minutes later, another instrument aboard
 (-130F).
                                                      Aqua captured a visible image of Typhoon Bopha.
                                                      The image revealed that Bopha's clouds covered
 On Dec. 5 at 0517 UTC (12:17 a.m. EST), the
                                                      the entire island of Palawan, and where the AIRS
 Atmospheric Infrared Sounder (AIRS) instrument
                                                      instrument revealed the coldest cloud top
 that flies aboard NASA's Aqua satellite captured an
                                                      temperatures, those areas of clouds appeared the
 infrared view of Typhoon Bopha's cloud-top
                                                      brightest white in the visible image, because they
 temperatures as it was exiting Palawan and moving
                                                      were higher than the surrounding clouds, and cast
 into the South China Sea. The AIRS data identified
                                                      shadows on the lower clouds. The strongest
 areas of bitterly cold cloud-top temperatures of 210
                                                      thunderstorms have waned around the center of
 kelvin (-63C/-81F) where the strongest
                                                      circulation during the early part of Dec. 5, although
 thunderstorms, with highest cloud tops, and
                                                      a tightly curved band of thunderstorms remained
 heaviest rainfall were found. One area was located
                                                      along the western and northern quadrants.
 over the South China Sea and the other over
 northern Palawan at the time of the image.
                                                      On Dec. 5 at 1500 UTC (10 a.m. EST) Bopha's
                                                      maximum sustained winds were near 75 knots (86
                                                      mph/139 kph). It was located near 11.5 north
                                                      latitude and 117.4 east longitude, about 270
                                                      nautical miles southwest of Manila, Philippines.
                                                      Bopha is moving to the northwest near 11 knots
                                                      (12.6 mph/20 kph) and is expected to slow down in
                                                      the South China Sea.

                                                            Bopha is expected to continue tracking generally
                                                            west-northwest into the South China Sea and
                                                            become quasi-stationary over the next couple of
                                                            days.

                                                             Provided by NASA's Goddard Space Flight Center

This 3-D image of Super Typhoon Bopha was created
using data from NASA's Tropical Rainfall Measuring
Mission (TRMM) satellite on Dec. 2, 2012. TRMM 3-D
data showed that the inner eyewall was being replaced
by an outer eyewall, something that typically happens in
major typhoons. There was also a "hot tower"
thunderstorm reaching 12 kilometers (7.4 miles) high,
located north of the center of circulation. NASA research

                                                                                                        2/3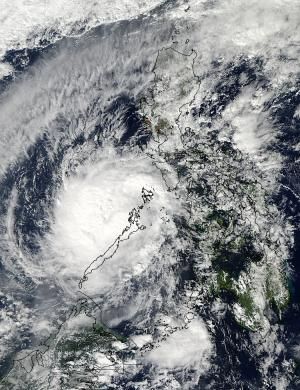
APA citation: NASA satellites analyze Typhoon Bopha inside and out (2012, December 5) retrieved 17
                                   October 2021 from https://phys.org/news/2012-12-nasa-satellites-typhoon-bopha.html

                                   This document is subject to copyright. Apart from any fair dealing for the purpose of private study or research, no
                                   part may be reproduced without the written permission. The content is provided for information purposes only.

                                                                                                                                                3/3

Powered by TCPDF (www.tcpdf.org)
You can also read


