Hawke's Bay Trends THE STATE OF OUR ENVIRONMENT - January 2022
←
→
Page content transcription
If your browser does not render page correctly, please read the page content below
Hawke’s Bay Trends
THE STATE OF OUR ENVIRONMENT
January 2022
JANUARY 2022
Blimey. January was a bolter after months of good rain and favourable forecasts. Ex-TC Cody
promised, then went AWOL and all that followed was tumbleweed. The Plains and main ranges had
about a quarter or less of average January rainfall and other areas weren’t well endowed either. Our
good river flows readily surrendered and whimpered to below normal levels. I’m told the water take
bans equal the same time last summer.

January groundwater levels looked the best I can remember (my memory isn’t good), with a sizeable
number above average. Shame the month’s rainfall was such custard that those numbers will likely
disappear as quickly as a plate of namesake squares. Soil moisture levels are dropping, though still
some sites remain just above median levels for the time of year.

Temperatures weren’t as rollicking as last month but respectable. The daytime temperatures were
above average, and the overnight temperatures nudged the boundary as well. Swimming was all go
and our popular spots were up to the task, though our testing showed that when it’s hot and dry
skirt venturing into a shallow lagoon.

Kathleen Kozyniak
Principal Scientist - Climate and Air
SUMMARY JANUARY 2022

Dry, sadly, and warm temperatures.

This is a summary of the regions rainfall, river flows,
ground water, air quality and soil moisture levels. Data
and images provided by HBRC.

February to April Forecast
Temperature Near or above average
Rain           Near or above normal
River flows    Near normal
Soil moisture Near normal
source : NIWA

For more information
www.hbrc.govt.nz
P: 06 835 9200
RAINFALL

Horribly below normal, especially on the Plains
and main ranges. No cloud to ground lightning
strikes
Lightning counts come from the Blitzortung.org lightning
network to which HBRC contributes.

Percentage of normal January rainfall
(30 year average)

For areas in the region:
Waikaremoana                              52%
Northern HB                               53%
Tangoio                                   37%
Kaweka                                    18%
Ruahine                                   26%
Heretaunga Plains                         26%
Ruataniwha Plains                         23%
Southern HB                               38%
Hawke’s Bay Region                        34%
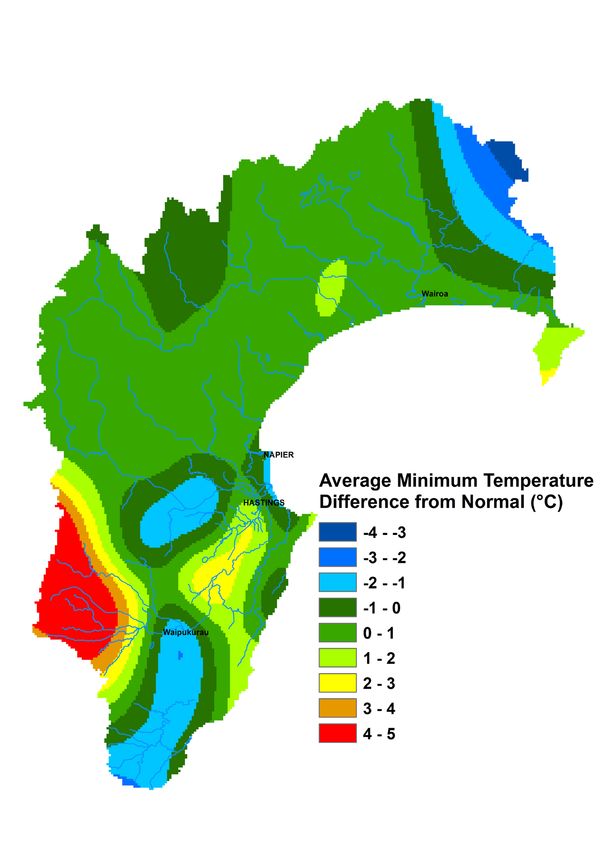
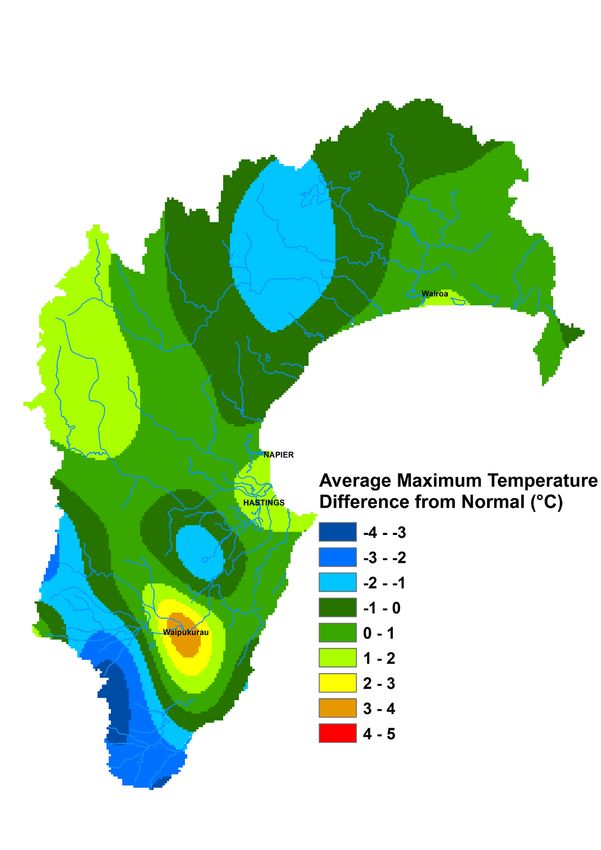
TEMPERATURES
Above average days and almost
nights as well.

Mean Difference from Normal
Maximum Temperature: 0.6°C
Minimum Temperature: 0.4°C

Mean Daily Maximum: 23 °C
Mean Daily Minimum: 12°C
Highest Daily: 32.9 °C
Location: Wairoa North Clyde EWS
(NIWA)
Lowest Daily: 1.8 °C
Location: Taharua Climate
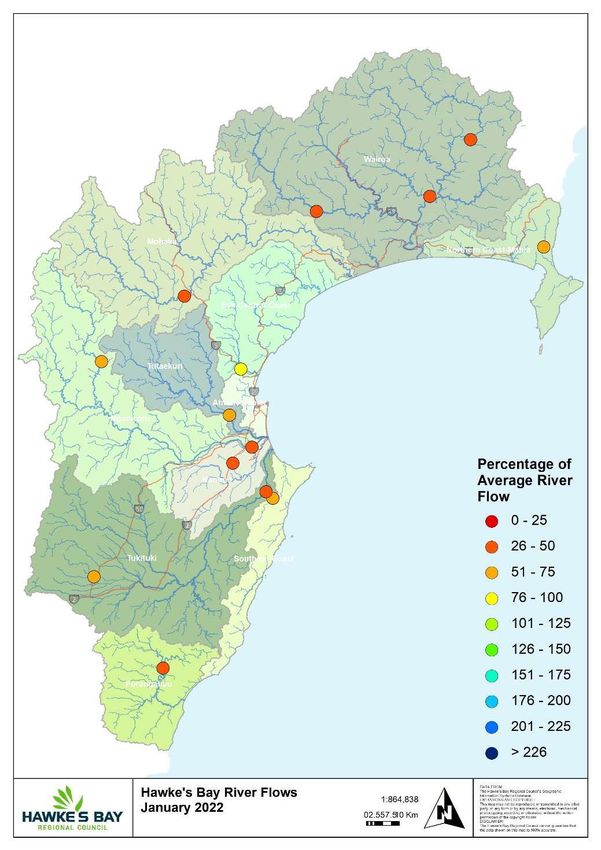
RIVER FLOW
Percentage of average January flows
for areas in the region:
Northern Coast – Mahia         52%
Northern HB – Hangaroa River   34%
Northern HB – Wairoa River     35%
Northern HB – Waiau River      38%
Mohaka                         39%
Esk-Central Coast              82%
Tūtaekuri                      63%
Karamu                         30%
Ngaruroro – Kuripapango        52%
Ngaruroro – Chesterhope        45%
Southern Coast                 61%
Tukituki – Tukipo River        55%
Tukituki – Tukituki River      44%
Porangahau                     32%
Hawke’s Bay Region             47%
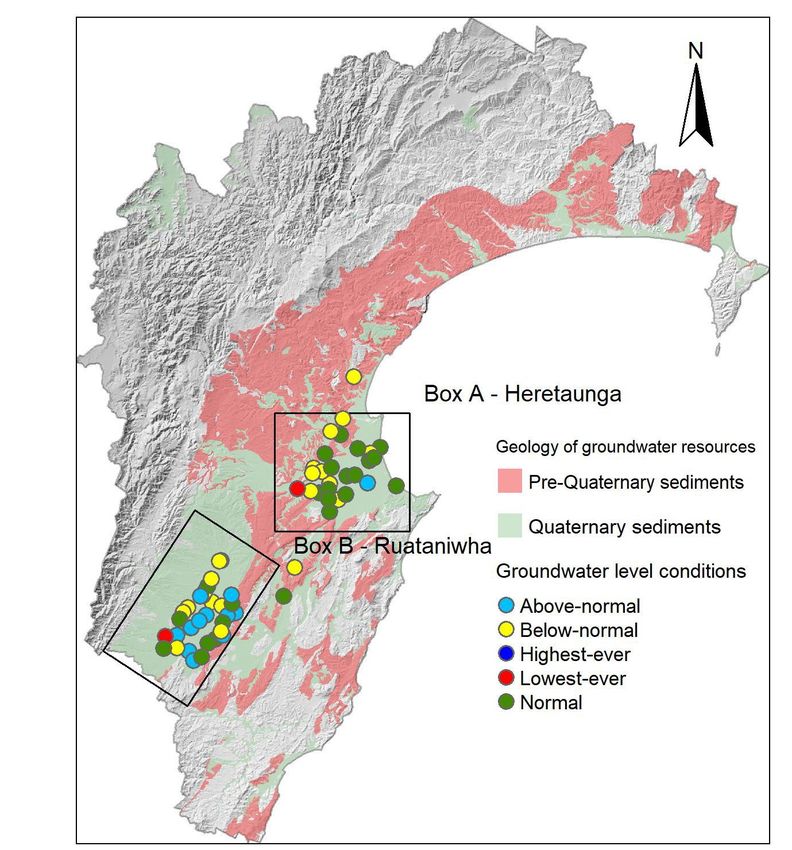
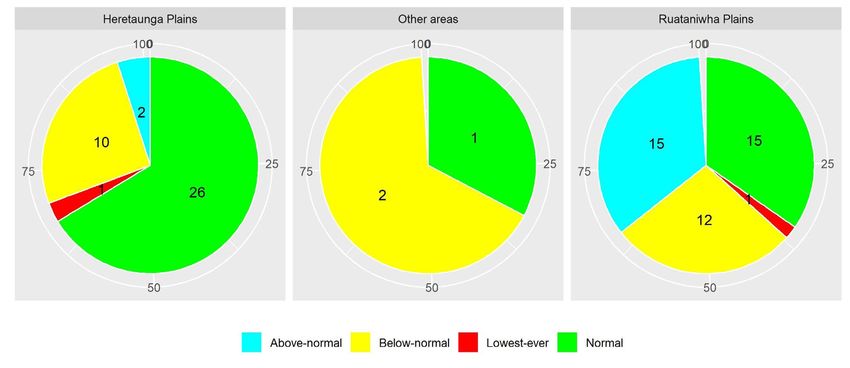
GROUNDWATER & SOIL MOISTURE
Soil Moisture: Normal or below normal
Current state of Groundwater levels:
This report compares groundwater levels measured in January with
historic readings to evaluate current monthly conditions. To assess these
conditions, we have grouped groundwater levels at each well relative to
their monthly percentiles. Groundwater levels measuring between their
monthly minimum and 25th percentile are considered below-normal,
groundwater levels measuring between the 25th and 75th percentiles
are classed as normal, and groundwater levels measuring between the
75th-maximum are considered above-normal. Wells with less than 5
years of record are excluded from the analysis.
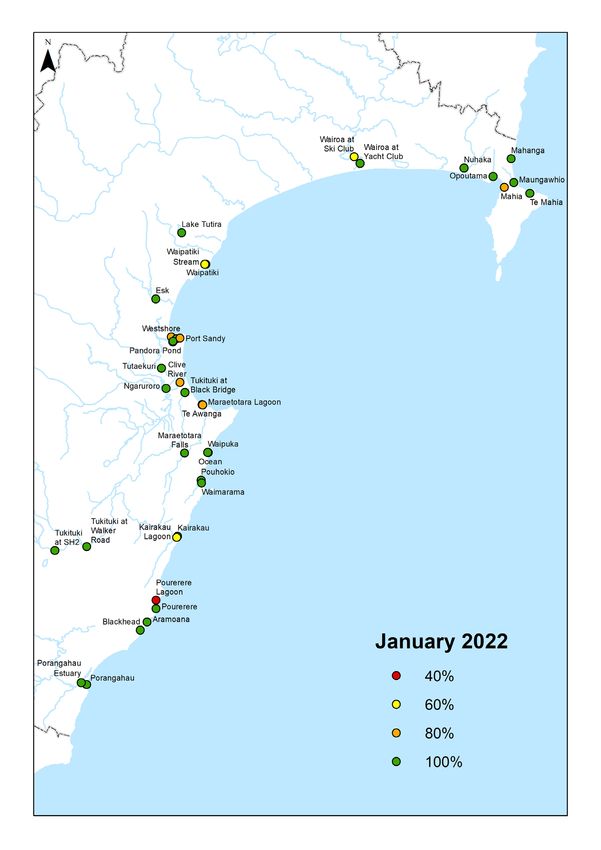
RECREATIONAL WATER QUALITY
It’s been a scorching welcome into the new year
here in Hawke’s Bay, with plenty of people out
and about cooling off at our favourite swim spots.
Overall there were fewer exceedances in January
compared to the wetter months towards the end
of 2021.

Coastal lagoons such as Pourerere, Waipatiki
Lagoon and Maraetotara Lagoon continue to be
the main suspects for exceedances in this warm
weather.

There were a few one-off exceedances at a
handful of beaches (Mahia, Port Sandy,
Westshore) which were cleared after being
resampled. The rivers and southern Beaches
(Ocean to Porangahau) were the places to keep
cool this January.
LONGER FORECAST

Hopefully January was just a glitch in a broader pattern of ample rain. Warm sea
temperatures still surround us and La Niña rumbles on but is expected to wane in
autumn. The predicted pattern over the next few months continues from previous
instalments, being one of lower than normal sea level pressure across the north
Tasman Sea and northern New Zealand, with higher than normal pressure south of
the country.

The pattern promotes an easterly flow and hopes of moisture laden systems visiting
from the north. Rainfall is expected to be near or above normal over the next three
months and ditto temperatures. And now that I’m about to take a good holiday
break, it can rain all it likes as long as it’s at night.

Kathleen Kozyniak
Principal Scientist - Climate and Air
You can also read


