Briefing on 2022 Summer Loads and Resources Assessment results - Bob Emmert Sr. Manager, Interconnection Resources Board of Governors meeting ...
←
→
Page content transcription
If your browser does not render page correctly, please read the page content below

Briefing on 2022 Summer Loads and
Resources Assessment results

Bob Emmert
Sr. Manager, Interconnection Resources

Board of Governors meeting
General Session
May 12, 2022

                   COPYRIGHT © 2022 by California ISO. All Rights Reserved.   Page 1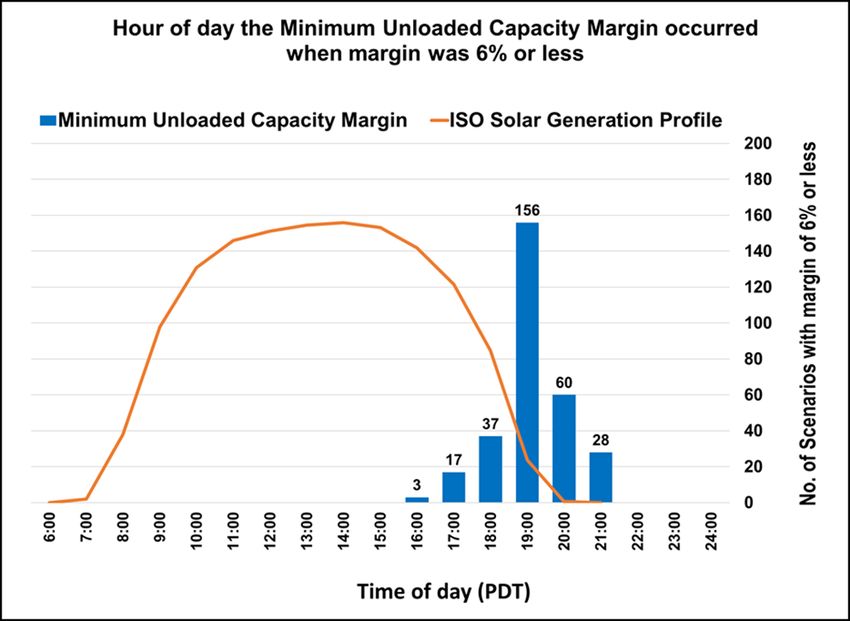
The 2022 Summer Assessment provides the ISO’s
view of anticipated conditions in the summer ahead
• The analysis includes probabilistic results from a stochastic
  model and deterministic “stack analysis” results
  – Deterministic stack analysis of September when conditions are
    can be most challenging due to declining solar and hydro
    • based on latest Energy Commission forecast
• The stochastic analysis relies on a production simulation
  model that runs 2,000 simulations modeling:
  – An ISO projection of 2022 load levels and a distribution of load
    scenarios using 20 years of historical weather data
  – Historical renewable resource generation profiles
  – Import limits to characterize declining availability of imports as
    ISO load levels increase
    • to simulate declining imports as temperatures increase in the
      ISO and across the west
                     COPYRIGHT © 2022 by California ISO. All Rights Reserved.   Page 2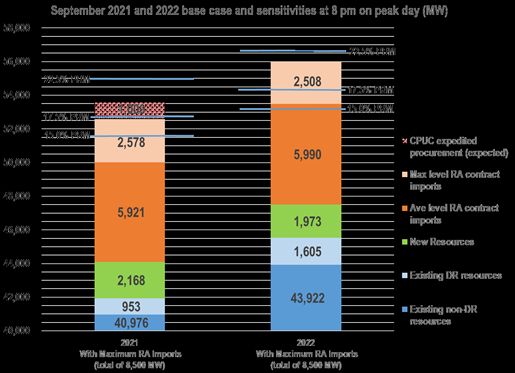
The 2022 “stack analysis” demonstrates an improvement
 in supply conditions compared to 2021

 -   Load levels plus Planning
     Reserve Margins are
     based on CEC 1-in-2
     load forecast
 -   Resource levels based
     on late April data

Observations:
• 2022 stack analysis shows marginally better supply than 2021
• Over 4,000 MW NQC was added from June 1, 2021 to June 1, 2022
• The increase from September 1, 2021 to September 1, 2022 was 2,582 MW NQC
• This gain is offset by 1,005 MW higher load forecast for 2022 based on the latest CEC forecast
                                COPYRIGHT © 2022 by California ISO. All Rights Reserved.           Page 3
The ISO’s stochastic model assumptions vary
slightly from the stack analysis
• The ISO load forecast used the most recent 20 years of historical
  weather data versus 26 years of history used in 2021
  – 20 year historical weather period provides a forecast that more explicitly
    accounts for the effects of climate change.
  – Load forecast distribution contains larger population of high loads in 2022
  – The 2022 1-in-2 and 1-in-5 load forecasts are relatively unchanged from
    2021 and generally aligns with the latest Energy Commission forecast
  – The 2022 1-in-10 load forecast is 1% higher than 2021 and 4% higher than
    the Energy Commission forecast
• Hydro: third year below normal – snowpack was 38% of average on
  April 1, compared to last year’s 60% of average on April 1, 2021
  – The Northwest hydro reservoirs projected to be 94% of average
• Generation additions: 3,206 MW net increase in dispatchable capacity
  from June 1, 2021 to June 1, 2022, largely battery energy storage

                        COPYRIGHT © 2022 by California ISO. All Rights Reserved.   Page 4
Stochastic model results
• Typically year to year results compare the number of samples (out of
2,000 drawn from the historical data) that experience at least an hour
of shortfall and the depth of the shortfall.
• Since the samples were drawn from a more recent and smaller
number of years of historical data, comparisons to 2021 are now more
nuanced. 2022
Shortfall Number of Shortfall Cases
System Capacity Shortfall
Probability (out of 2,000)
• Probabilities for EEA Entering EEA 3 (Stage 2)
EEA 3 - firm load used for
15.1% 301
7.7% 154
2 and EEA 3 have contingency reserves (Stage 3)
Unserved energy
4.0% 80
increased for 2022 EEA 3 - firm load interruption
2021
due to a larger System Capacity Shortfall
Shortfall Number of Shortfall Cases
Probability (out of 2,000)
population of high Entering EEA 3 (Stage 2) 6.4% 128
EEA 3 - firm load used for
loads in the forecast contingency reserves (Stage 3)
4.8% 96
Unserved energy
distribution EEA 3 - firm load interruption
4.6% 91
• However, the probabilities for unserved energy has decreased,
reflecting a lower probability for firm load shedding
COPYRIGHT © 2022 by California ISO. All Rights Reserved. Page 5Stochastic model results (continued)
• The number of hours of risk and the amount of load shed at risk is
significantly reduced in 2022 - despite the larger population of high
loads in the forecast distribution increasing the number of scenarios
that have at least one hour of operating reserves in the EEA 2 and
EEA 3 range
Comparison of Unserved Energy Results
Percent Reduction
2021 2022
(2021-2022)/2021
Total unserved energy MWH of
1,085,168 177,394 84%
all hours in 2 ,000 scenarios
Number of hours of unserved
645 190
energy in all 2 ,000 scenarios
71%
Percent of hours of unserved
0.011% 0.003%
energy in all 2 ,000 scenarios
COPYRIGHT © 2022 by California ISO. All Rights Reserved. Page 6The greatest risk of low reserve margins is when
solar is unavailable
• 81% percent of the minimum reserve margins occurred during the hours ending
19:00 to 21:00 – hours of little to no production from solar resources.
COPYRIGHT © 2022 by California ISO. All Rights Reserved. Page 7The ISO analysis does not fully reflect more extreme
climate induced load and supply uncertainties, and
procurement delay risks such as:
• More extreme weather events beyond those projected from the
most recent 20 years of historical data;
• Wildfire events that could limit key transfer paths or resources,
and other potential transmission outages;
• The unexpected confluence of extreme heat, drought affecting
fire risk, and smoke impacting solar production; and
• Project development delays such as those triggered by the
recent Department of Commerce investigation of solar panel
tariff issues.
• These types of events tend to be managed in part by additional
reliability measures beyond normal resource planning and
market operation.
COPYRIGHT © 2022 by California ISO. All Rights Reserved. Page 8Conclusions
• Overall, 2022 capacity conditions are better compared to 2021
due to new resources (especially storage) despite load
changes and hydro conditions
– But the grid remains vulnerable to high loads and availability of
imports during widespread heat events, especially in late summer
• While progress has been made in overcoming past supply
shortfall conditions, additional resources are needed to
ultimately achieve long term reliability margins
• Conventional planning techniques do not take into account
growing risks of more extreme events, stemming from climate
change, supply chain disruptions, etc. These pose additional
risks not included in this analysis.
COPYRIGHT © 2022 by California ISO. All Rights Reserved. Page 9You can also read


