Longreach Energy Holdings LLC - Giant Capital
←
→
Page content transcription
If your browser does not render page correctly, please read the page content below
Monthly Report
Longreach Energy

                                                                                                                                     July 2021
Holdings LLC
FIRM INFORMATION                             1. Market and Macro Industry Commentary
Investment Manager
Longreach Alternatives Ltd
ABN 25 082 852 364                           General Market Commentary
AFSL 246747
Sub-Advisor
Longreach Energy Holdings LLC                After strengthening to a six-year high of $77/bbl in early July, WTI then drifted lower to trade
Delaware registered #565928                  $69.59/bbl at the start of August. The decline was predominantly due to concerns surrounding
                                             the fast-spreading Delta variant of Covid-19. Cooling demand from hot weather in the US
                                             combined with very low wind and hydro power generation, saw continued strengthening of
                                             Henry Hub gas prices with the spot contract now trading above $4/mcf.

KEY INVESTMENT                               The surge in US hydrocarbon production over the last decode is evident in new data released
PERSONNEL                                    from the EIA showing that more petroleum and natural gas was produced in the United States
                                             than in any other country during 2020 (Figure 1). This is a trend that began in 2014.
Andrew Sinclair
Principal – Commercial Director
                                              Figure 1: Estimated hydrocarbon production in selected countries 2008-2020 (Source: EIA)
Thomas Wagenhofer
Principal – Technical Director

                                             US petroleum and natural gas output in 2020 totalled 66.9 quadrillion British thermal units
                                             (quads), which was more than both Russia’s 45.5 quads and Saudi Arabia’s 26.5 quads of
                                             petroleum and natural gas production.

CONTACT US
Longreach Alternatives Ltd
Level 13
1 Margaret Street
Sydney NSW 2000
T+61 2 9135 0428
client.services@longreachalternatives.com

© 2021 Longreach Alternatives. All rights reserved. ABN 25 082 852 364 AFSL 246747                                                               1
Longreach Energy Holdings LLC Delaware registered #565928
                                                            Private and Confidential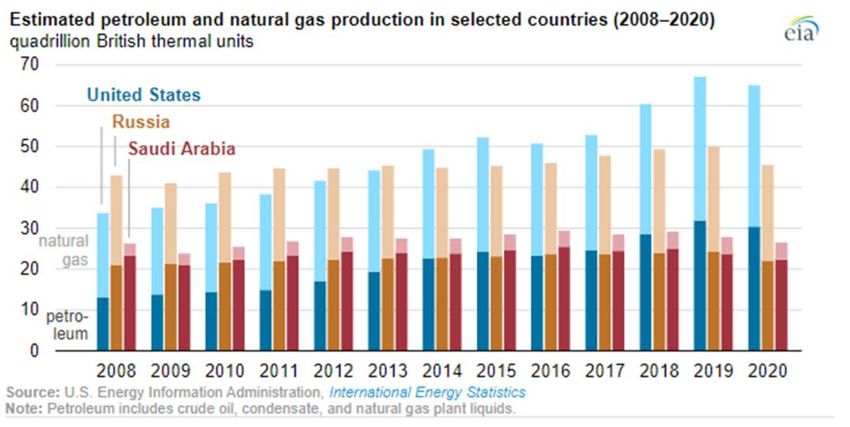
Longreach Energy

                                                                                                                                       Monthly Report
Holdings LLC

 The return of inflation continues to be a focus of financial market attention (Figure 2).

                           Figure 2: US Consumer Price Index (Source: US Bureau of Labor Statistics, via FT)

 A big driver of US CPI changes has been a marked rise in second-hand vehicle prices (Figure 3). There appears to be two main
 drivers for this increase: reduced supply of new vehicles because of issues with computer chip supply; and increased demand for
 private vehicle transportation as Covid concerns turns people away from public mass-transit. While these concerns remain oil
 consumption will stay further elevated.

                              Figure 3: Used vehicle prices (Source: US Bureau of Labor Statistics, via FT)

© 2021 Longreach Alternatives. All rights reserved. ABN 25 082 852 364 AFSL 246747                                                 2
Longreach Energy Holdings LLC Delaware registered #565928
                                                            Private and Confidential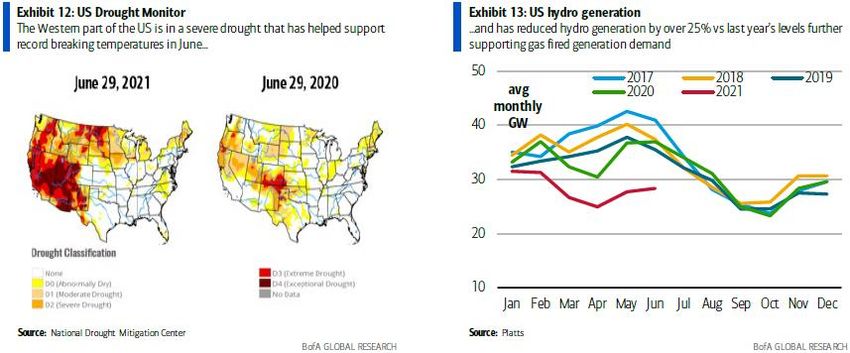
Longreach Energy

                                                                                                                                           Monthly Report
Holdings LLC

 The increased use of natural gas in the US has facilitated a large drop in US per capita CO2 emissions. Our World in Data’s
 tabulation shows that US per capita CO2 emissions in 2017 had dropped to levels not seen since 1963 (Figure 4).

                                   Figure 4: US per capita CO2 emissions (Source: Our World in Data)

 The latest Baker Hughes rig count data follows. In July US total rigs increased by 13 from 475 to 488 and land rigs increased by 14
 from 459 to 473. These are similar increases to those in June, though remain notably smaller than those seen in the 2016 energy
 price rebound as discussed in the June report. Oil rigs increased by 9 from 376 to 385 and there were 4 new gas rigs deployed,
 increasing from 99 to 103.

© 2021 Longreach Alternatives. All rights reserved. ABN 25 082 852 364 AFSL 246747                                                     3
Longreach Energy Holdings LLC Delaware registered #565928
                                                            Private and Confidential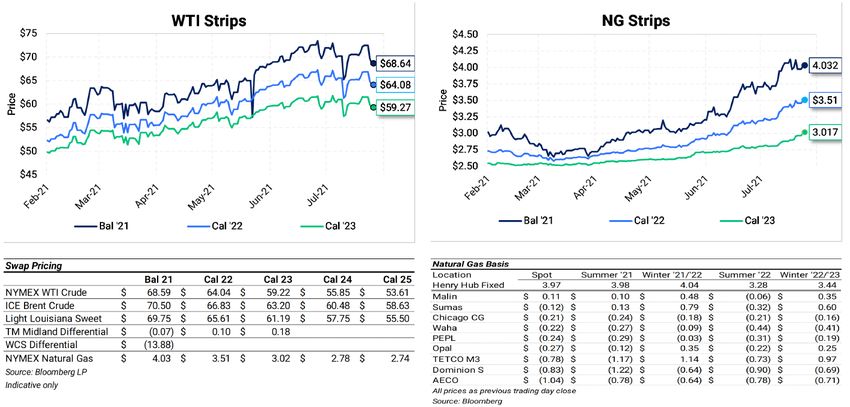
Longreach Energy

                                                                                                                                          Monthly Report
Holdings LLC

 Gas Market

 Strong exports and elevated power burns have driven US natural gas prices to multi-year highs. The prompt contract closed July at
 $4.03, an increase of $0.38 or 10% on end June (Figure 5).

                                          Figure 5: Natural Gas Spot Prices (Source: S&P via FT)

 Temperatures in the North-West remain very high (Figure 6). Gas demand in California drive the price at SoCal Citygate in Southern
 California to $8.31/mmbtu on 28 July, over double the Henry Hub price.

                  Figure 6: Temperature deviation between average and normal week ending 22 July (Source: NOAA)

© 2021 Longreach Alternatives. All rights reserved. ABN 25 082 852 364 AFSL 246747                                                    4
Longreach Energy Holdings LLC Delaware registered #565928
                                                            Private and Confidential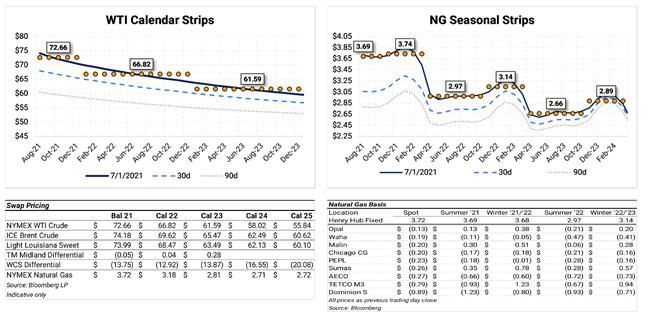
Longreach Energy

                                                                                                                                           Monthly Report
Holdings LLC

 Temperatures in June were higher than normal, registering it the third hottest June since 2010. Gas weighted cooling degree days
 (CDDs), a measure of demand, totalled 379 for the month, 22 CDDs hotter than the 10-year normal (LHS Figure 7). As wind output
 plummeted and temperatures rose, gas burns jumped in the last four days of June (RHS Figure 7). This trend continued in July.

                                 Figure 7: Gas power burn vs temp and CDDs (Source: Bloomberg, BofA)

 The extremely bullish jump in gas burns was partly driven by a drop in wind generation to near multi-year lows. This is remarkable
 given the growth in overall wind capacity over the last several years (LHS Figure 8). While wind generation typically decreases as
 temperatures rise, the drop in June was extreme. The decline in total US wind generation measured from the 30-day average was
 over 50%, a record at national temperatures around 80 degrees F (RHS Figure 8). Putting the drop into gas equivalent terms, the 30-
 day average for wind generation was equivalent to 6.8bcf/d of gas generation (compared to ~40bcf/d of actual gas generation). On
 29 June, gas equivalent wind generation only totalled 2.1 bcf.

                                         Figure 8: US Wind Generation (Source: Bloomberg, BofA)

© 2021 Longreach Alternatives. All rights reserved. ABN 25 082 852 364 AFSL 246747                                                     5
Longreach Energy Holdings LLC Delaware registered #565928
                                                            Private and Confidential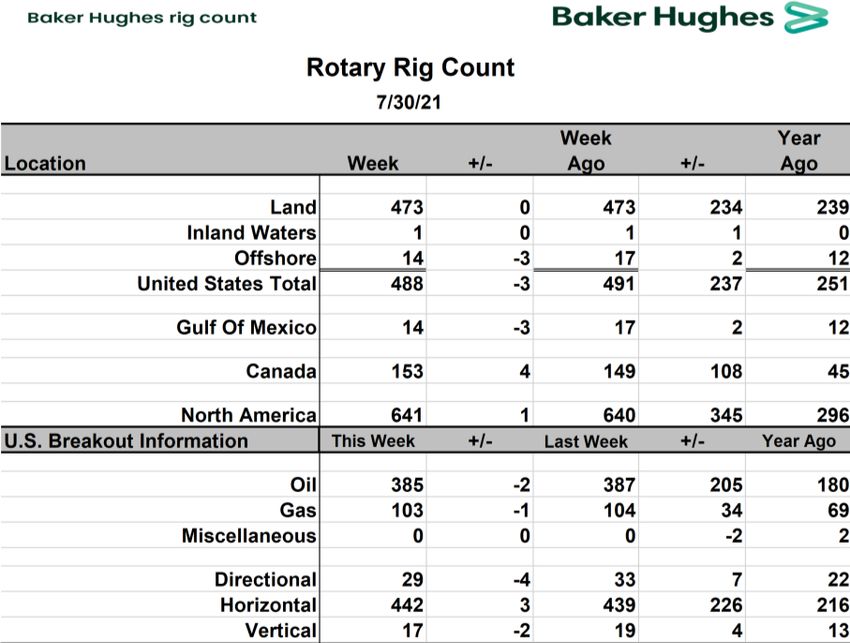
Longreach Energy

                                                                                                                                            Monthly Report
Holdings LLC

 A historic drought in the west has also added to gas demand as hydro generation levels have dropped across the country. The
 drought in the western half of the US is classified extreme and exceptional (the highest level) through most western states (LHS
 Figure 9). The drought has destroyed hydro generation whose levels have fallen over 25% from last year (RHS Figure 9). Assuming
 this lost generation was fully replaced by natural gas, in June it would have translated to an additional 1-1.5bcf/d of gas demand.

                                  Figure 9: US Drought and Hydro Generation (Source: various via BofA)

 Surprising support for gas demand has also been provided by reduced price-induced switching from gas to coal power generation.
 LHS Figure 10 shows gas’s share of thermal generation over the last six-years. The RHS of Figure 10 shows that June 2021 gas-
 power burn is materially higher than the 2018-2020 coal/gas price relationship had implied. This has been caused by a wave of coal
 retirements over the last several years and the reduced elasticity of demand can be expected to soften the upper limits of potential
 future gas price moves.

                                  Figure 10: Gas share of thermal generation (Source: Bloomberg, BofA)

© 2021 Longreach Alternatives. All rights reserved. ABN 25 082 852 364 AFSL 246747                                                      6
Longreach Energy Holdings LLC Delaware registered #565928
                                                            Private and Confidential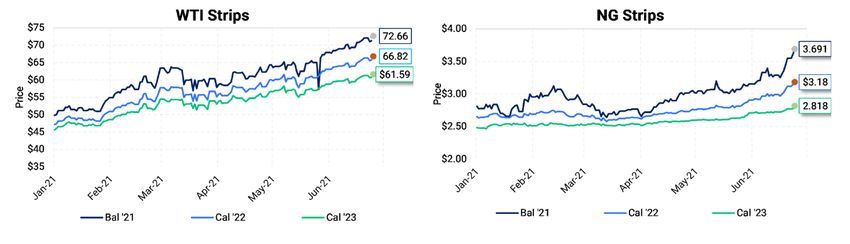
Longreach Energy

                                                                                                                                             Monthly Report
Holdings LLC

 US gas export demand continues to be strong through both LNG and pipeline exports to Mexico. US LNG exports hit record highs
 during 1H2021 as new capacity ramped to match growing demand (Figure 11).

                                         Figure 11: Natural Gas Liquids Spot Prices (Source: EIA)

 LNG exports averaged 9.6bcf/d for the first six months of the year, a 42% year-over-year increase. Net flows to US LNG facilities are
 around 10.6bcf/d as the global arbs remain wide open, inducing exporters to operate at maximum capacity (Figure 12).

                              Figure 12: Global Natural Gas Prices and LNG arb (Source: Bloomberg, BofA)

© 2021 Longreach Alternatives. All rights reserved. ABN 25 082 852 364 AFSL 246747                                                       7
Longreach Energy Holdings LLC Delaware registered #565928
                                                            Private and Confidential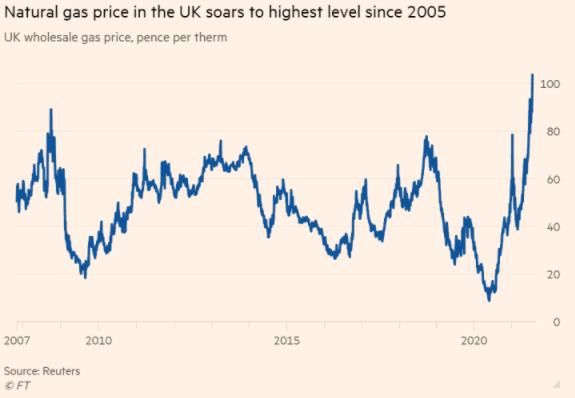
Longreach Energy

                                                                                                                                      Monthly Report
Holdings LLC

 European prompt-month TTF price is around $13.735 while the Asian JKM is trading $15.085. Both benchmarks have approached
 multi-year highs, as warm weather and strained inventory levels have caused a supply crunch.

 In the UK, prices have risen above 100p a therm (£10/mmbtu), the highest level since 2005 and a record for summer (Figure 13).

                                             Figure 13: UK Gas Price (Source: Reuters via FT)

 High prices in Europe have not been able to increase LNG imports above last year’s levels with record Chinese demand still
 dominating (Figure 14).

                                       Figure 14: European and Chinese LNG Imports (Source: EIA)

© 2021 Longreach Alternatives. All rights reserved. ABN 25 082 852 364 AFSL 246747                                                8
Longreach Energy Holdings LLC Delaware registered #565928
                                                            Private and Confidential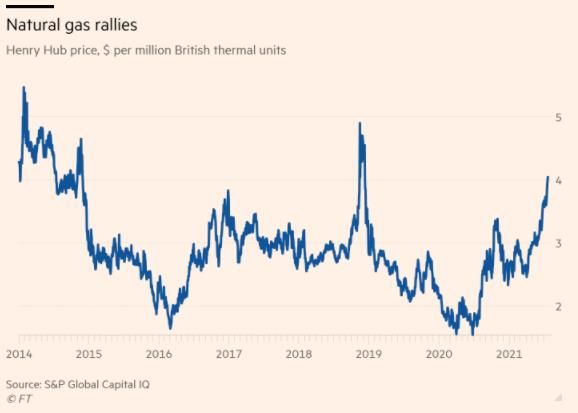
Longreach Energy

                                                                                                                                                Monthly Report
Holdings LLC

 Pipeline exports to Mexico have averaged 6.5bcf/d this US summer, up ~1.5bcf/d from summer 2020. The absence of cost-effective
 power generation alternatives suggests Mexican demand will not fall appreciably with higher gas prices (Figure 15).

                               Figure 15: Mexican imports and power generation (Source: various via BofA)

 In response to higher prices production is steadily creeping higher. June production averaged 92bcf/d, up 300mmcf/d from May (LHS
 Figure 16). While careful majors have maintained rig levels at under 40% of January 2020 levels, smaller producers, both public and
 private, have increased activity levels significantly since last northern hemisphere autumn. With gas (and oil) prices at current levels
 the incentive to bring back production only increases.

                           Figure 16: US Gas Production and Rig Counts (Source: Genscape, Platts via BofA)

© 2021 Longreach Alternatives. All rights reserved. ABN 25 082 852 364 AFSL 246747                                                          9
Longreach Energy Holdings LLC Delaware registered #565928
                                                            Private and Confidential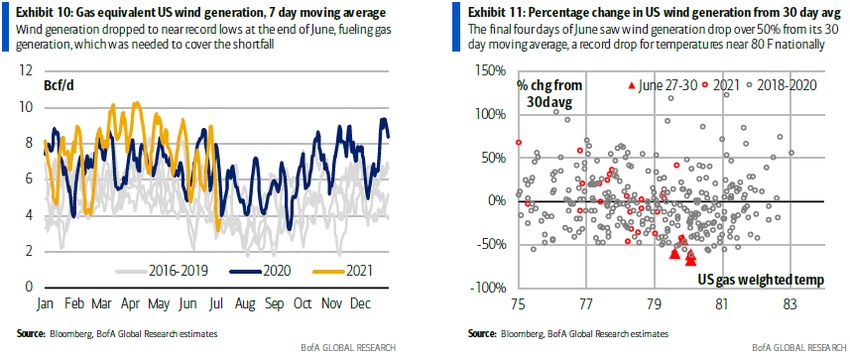
Longreach Energy

                                                                                                                                               Monthly Report
Holdings LLC

 Oil Market

 Oil prices started July trading at $73.47/bbl and on 6 July WTI reached a six-year high of $76.97/bbl, after a dispute between Saudi
 Arabia and the UAE blocked OPEC agreement to a supply increase. Resolution of this dispute and increased concerns over the fast-
 spreading Delta variant of Covid-19 saw WTI then decline. By month end the prompt WTI contract was trading $68.59/bbl, below
 highs but still a very healthy (and profitable) price for most US production.

 Global oil consumption remains stronger than seen in 2020 with global oil inventories dropping nearly 200 million bbl since mid-2020
 (LHS Figure 17). Declines in the US have been steep. Inventories which started 2021 at five-year highs, quickly dropped towards the
 five-year average by late February and then spiked higher after the severe winter storm disrupted refining capacity. From March,
 robust end-use demand and a recovery in refinery runs have caused inventories to resume their downward trajectory and have now
 fallen below five-year average levels (RHS Figure 17)

                          Figure 17: Global and US crude oil inventories (Source: Kayrros, Bloomberg via BofA)

 US producers are retraining their drilling activity despite higher prices. The drive to deliver shareholder returns has seen less drilling
 and completion activity than these prices would have delivered pre-covid (Figure 18).

                              Figure 18: US oil prices, rigs and completion activity (Source: various via BoA)

© 2021 Longreach Alternatives. All rights reserved. ABN 25 082 852 364 AFSL 246747                                                        10
Longreach Energy Holdings LLC Delaware registered #565928
                                                            Private and Confidential
Longreach Energy
Monthly Report
Holdings LLC
Public E&Ps have been more restrained than private companies who have boosted drilling activity by 190% since mid-2020 (LHS
Figure 19). Public companies have focused their spending on completion activity which has delivered a decline in their drilled-but-
uncompleted (DUC) well inventory (RHS Figure 19).
Figure 19: Rigs and DUCs by company type (Source: Platts, Rystad via BoA)
Note that while the ramp up in drilling and completion activity among private producers is impressive, private producers account for
just one-third of total US onshore oil production, roughly 25% in the largest production area of the Permian, so the behaviour of the
listed E&P sector is more important to national supply (Figure 20).
Figure 20: US and Permian oil production by company type (Source: Rystad via BoA)
© 2021 Longreach Alternatives. All rights reserved. ABN 25 082 852 364 AFSL 246747 11
Longreach Energy Holdings LLC Delaware registered #565928
Private and ConfidentialLongreach Energy
Monthly Report
Holdings LLC
US production will increase with the prices but overall production during 2021 has been flat (Figure 21).
Figure 21: US crude oil production (Source: EIA)
© 2021 Longreach Alternatives. All rights reserved. ABN 25 082 852 364 AFSL 246747 12
Longreach Energy Holdings LLC Delaware registered #565928
Private and ConfidentialLongreach Energy
Monthly Report
Holdings LLC
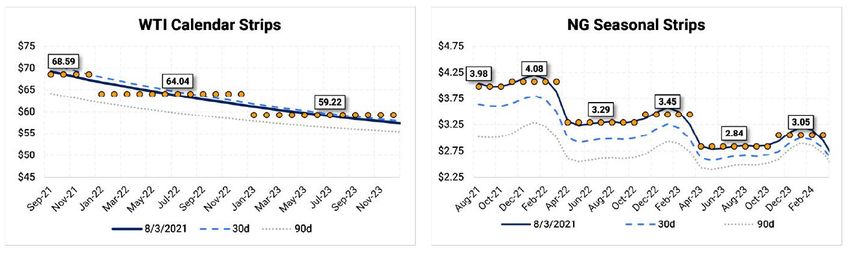
Gas and Oil Prices 1 July 2021
© 2021 Longreach Alternatives. All rights reserved. ABN 25 082 852 364 AFSL 246747 13
Longreach Energy Holdings LLC Delaware registered #565928
Private and ConfidentialLongreach Energy
Monthly Report
Holdings LLC
Gas and Oil Prices 3 August 2021
© 2021 Longreach Alternatives. All rights reserved. ABN 25 082 852 364 AFSL 246747 14
Longreach Energy Holdings LLC Delaware registered #565928
Private and ConfidentialYou can also read