From Emission to Deposition - Flows of Nitrogen Along the Front Range Brent W. Auvermann
←
→
Page content transcription
If your browser does not render page correctly, please read the page content below
From Emission to Deposition
     Flows of Nitrogen Along the Front Range

                                 Brent W. Auvermann
             Associate Professor of Biological and Agricultural Engineering
                                     Amarillo, TX

                                                                              1
0:55:00 to Cover All This Stuff
 •   0:01:00 - Overview, definitions, and acronyms

 •   0:05:00 - Air movement near RMNP

 •   0:15:00 - Sources of N along the Front Range

 •   0:20:00 - Atmospheric deposition of N in RMNP

 •   0:35:00 - Ecological effects of N enrichment in RMNP

 •   0:45:00 - The RMNP “glidepath” - an outsider’s view

 •   0:52:00 - Questions and responses
                                                            2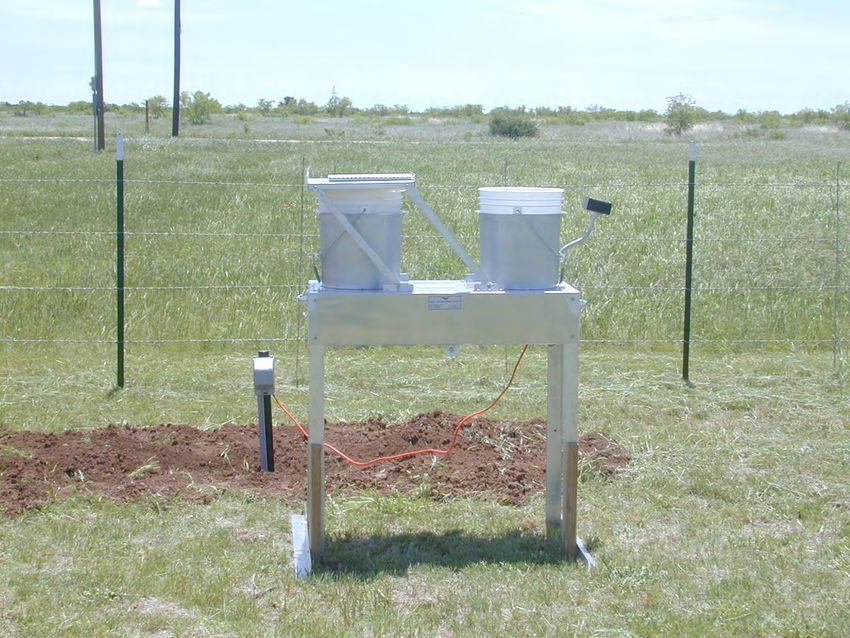
A Few Acronyms
•   RNS - reactive nitrogen species (biggies: NHx, NOx)

•   TIN - total inorganic nitrogen (TIN = NH4-N+ NO3-N)

•   NADP - National Atmospheric Deposition Program

•   CASTNET - Clean Air Status and Trends Network

•   RMNP(I) - Rocky Mountain National Park (Initiative)

•   RoMANS - Rocky Mountain Atmospheric Nitrogen and Sulfur study

                                                                    3
The Basic Idea
•   Pristine RMNP ecosystems evolved with low nutrient
    inputs

•   These ecosystems now exhibit signs of ecological
    shifts

•   The shifts are consistent with nutrient enrichment
    (primarily N)

•   Wet deposition of N appears to have increased in the
    Park over the past couple of decades

•   Hypothesis: Increased wet deposition of N is
    responsible for irreversible shifts in high alpine
    ecosystems

•   Corollary: Reducing wet deposition of N would head
    off those ecological shifts

                                                           4
Air Movement Near RMNP

                         5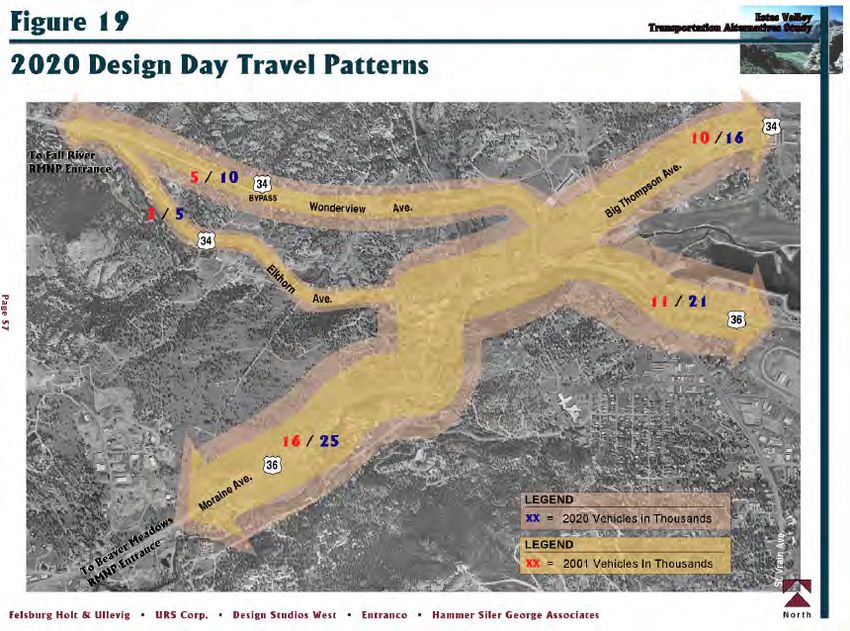
What is a Wind Rose?
•   Does not necessarily represent the motion
                                                22%
    of the airmass as a whole                         13%

•   Shows wind frequency X speed X direction
                                                15%

•   Prevailing (~60%) winds at RMNP have a
    westerly (downslope) component

•   Data may be disaggregated to show
    seasonality or diurnality

                                                            6
RMNP Wind Rose - Daytime

•   Prevailing (~50%) tends to be
    moderate to strong, downslope (W-
    N) winds

•   Significant component (~25%) is
    dominated by relatively light, upslope
    (SSE-SE) winds

                                             7
RMNP Wind Rose - Nighttime

•   Downslope (sinking, warming) winds
    present ~70%

•   Almost no upslope (E) component
    at night

                                         8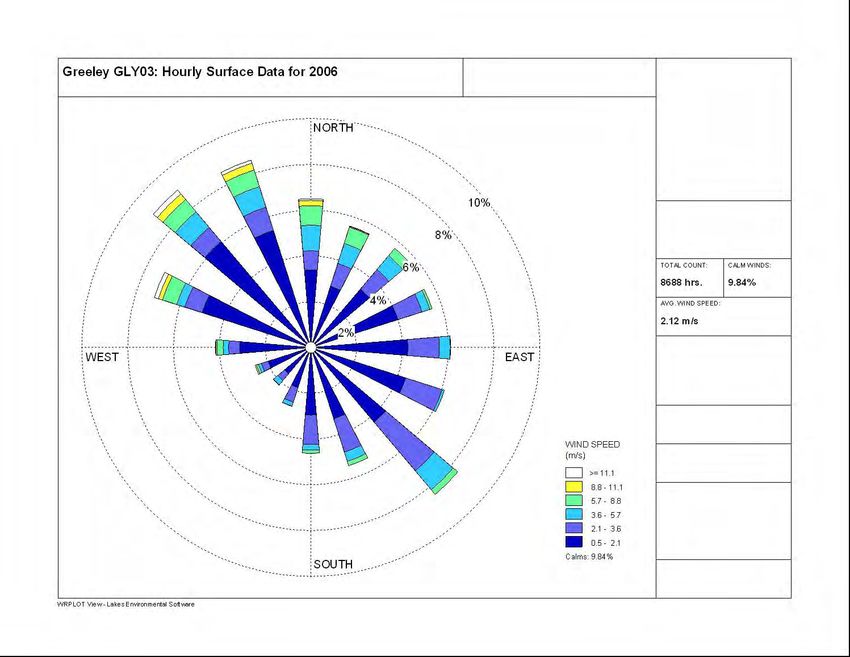
RMNP Wind Rose - Fall

• Chinooks predominate and
 can be very strong

                                9
RMNP Wind Rose - Spring

• Strong downslope component

• Significant upslope, moderate
  speeds

                                  10
RMNP Wind Rose - Summer
• Downslope component
predominates, but wind speeds
are not as great
• Upslope winds are light
11RMNP Wind Rose - Winter
• Chinooks dominant
12Greeley Wind Roses
2004 2006
13Kersey Wind Roses
2004 2006
14So What?
Air masses over RMNP generally come from the W
and NW, depending on the season; BUT
Air masses that generate significant precipitation tend
to come from the E and SE
Wind direction in RMNP does not necessarily point
directly back at the source of the air mass!
15Sources of N Along the Front
Range
16Source: Rocky Mountain Atmospheric Nitrogen and Sulfur (RoMANS) Brochure
17What Happens to Emitted NH3? • Atmospheric residence time of NH3 gas is fairly short (
Watson et al. (1996)
•   Northern Front Range Air Quality Study (NFRAQS)

•   Seasonality, composition, and distribution of PM along the I-25 and
    US85 corridors

•   Major conclusion: Study area is relatively enriched with respect to
    NH3 as compared to SOx and NOx

•   Would changes in NH3 concentration give rise to changes in
    secondary fine particles (sulfates and nitrates)?

                                                                          19
More NFRAQS Conclusions
Virtually all of the sulfate and nitrate in the NFR can be accounted
for as secondary ammonium salts (PM2.5)
If NH3 levels were reduced by 50%...
...most of the available HNO3 would be neutralized
...particle NO3 would be reduced by only 15%
Beyond 50% reduction in NH3, particle NO3 would decrease
proportionately with NH3
20Atmospheric Deposition in RMNP
21Two Kinds of Deposition
WET deposition - rainfall, snowfall, fog
Gases and particles dissolve into liquid phase to form solution
Solution deposits on surfaces (canopies, vegetation, soils, surface
water) as fog, dew or precipitation
DRY deposition - gases and particles impact or settle onto surfaces
without assistance from condensing water
22Anatomy of an NADP Site
Deposition (kg/ha/yr) = Precipitation (mm/wk) * Concentration (mg/l) * 0.52
23Rain
Gauge
24Rainfall
Sampler
2540.3639, -105.5806 - Google Maps 1/25/08 2:58 PM
Address
+40° 21' 50.04", -105° 34'
50.16"
NADP Sites in
Rocky Mountain National Park CO19 “Beaver Meadows”
CO98 “Loch Vale”
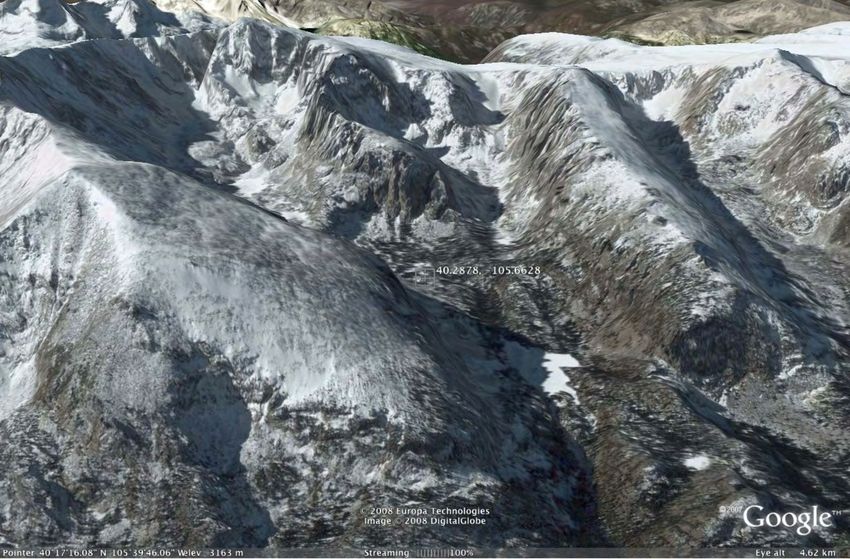
26Taylor Peak
Otis
NADP Site CO98 “Loch Vale” Andrews
Peak
Glacier
Thatchtop
CO98
The
Loch
27NADP Site CO19 “Beaver Meadows”
RMNP Entrance
Estes Park
CO19
28Deposition
and
Precipitation,
CO19
29Precipitation TIN Wet Deposition
Seasonality of Wet Deposition and Precipitation, Loch Vale
30NH4-N% NO3-N%
Seasonal Proportion of NO3-N and NH4-N in Wet Deposition
Loch Vale, 1996-2006
31“An analysis of 1995 through 1998 CASTNET data shows no trend in dry nitrogen
or sulfur deposition at the park.” (RMNP, 2008)
dN/dt = -0.01 (kg/ha/yr)/yr
Baron et al. (2005)
32So Who’s Responsible?
This is a question known as “source apportionment”
Source apportionment requires modeling:
Assumptions
Discretized domains (grid sizes >4 km)
Accepted algorithms
Tracers within the source domains
GIGO - results can be no more accurate than the input data
33RoMANS:
A Source-Apportionment Study
Two models required
MM5 (wind fields, precipitation)
CAMx (chemical transport)
Tracer sources inside and outside of CO
Interim finding: 33% of NH3 and 50% of NOx affecting RMNP are
from CO sources
Source: Barna et al. (2007)
34NH4 ion concentrations, 2004
+
35Source: Rocky Mountain Atmospheric Nitrogen and Sulfur (RoMANS) Brochure
36Wet Deposition Can Increase If:
Precipitation increases*; OR
Emissions of compounds or precursors increase
within the source footprint *; OR
Frequency of upslope conditions increases*; OR
Any two or more of the above coincide*
*All other influences remaining equal
37Ecological Effects of N Deposition
in RMNP
38Ecological Effects of Alpine N Enrichment
Water quality: increased N
concentrations in streams and lakes
Eutrophication
Change in microbial flora (diatoms)
Vegetation: From wildflowers to
grasses and sedges
Soil acidification as NH4 oxidized to
NO3
Source: Baron et al. (2005)
39The RMNP “Glidepath”
404
Major Glidepath Components
Target Wet Deposition Rate (kg/ha/yr)
3
• Historical background deposition in RMNP estimated at
0.2 kg N/ha/yr
2
• “Critical load” (at which ecosystem shifts thought to
begin) estimated at 1.5 kg N/ha/yr
1 • The resource-management goal established by NPS and
agreed by CDPHE and EPA is 1.5 kg/ha/yr by 2032
0
• Interim goal of 2.7 kg/ha/yr by 2012
2007
2008
2009
2010
2011
2012
2013
2014
2015
2016
2017
2018
2019
2020
2021
2022
2023
2024
2025
2026
2027
2028
2029
2030
2031
2032
41Wet Deposition Can Increase If:
Precipitation increases*; OR
Emissions of compounds or precursors increase
within the source footprint *; OR
Frequency of upslope conditions increases*; OR
Any two or more of the above coincide*
These are the areas
where mitigation
*All other influences remaining equal
strategies focus
42Think About That
Colorado Outside Colorado
• Two thirds (65%) of the NH3
under consideration originates
outside CO?
43800
Cold (Beef) Carcass Weights at Slaughter
Annual Means, National, 1989-2006
. 7 3 % /y r)
c re a s e ( 0
7 l b / y r i n
5 . 2
700
Cold Carcass Weight, lb
600
500
400
1989
1990
1991
1992
1993
1994
1995
1996
1997
1998
1999
2000
2001
2002
2003
2004
2005
2006
Source: CattleFax
44Estes Valley
Traffic
Projection:
>50%
increase
over 20
years
45Q&R
46You can also read