Development of an intensified neutron camera system for high sensitivity white-beam imaging
←
→
Page content transcription
If your browser does not render page correctly, please read the page content below
Development of an intensified neutron
camera system for high sensitivity
white-beam imaging
Paul Hink1*, Panos Kapetanopoulos2, Chris Slater2, Jack Wood2, Winfried Kockelmann3, Daniel Pooley3
1. Photek USA LLC, 313 W Liberty St, Ste 256, Lancaster, PA 17603, USA
2. Photek Ltd, 26 Castleham Road, St Leonards on Sea, East Sussex, TN38 9NS, United Kingdom
3. STFC-Rutherford Appleton Laboratory, ISIS Facility, Harwell, OX11 0QX, United Kingdom
* Corresponding author, paul.hink@photek-usa.com

Presented 28 June 2021, iWoRID 2021
Motivation Neutron Imaging Thermal Neutron radiography is an important tool for materials science, archaeology, nuclear fuel imaging and many other fields Thermal neutrons are complementary to x-rays and provide higher sensitivity to low atomic number materials, especially Hydrogen and Carbon, while having excellent penetration of most metals. There are a limited number of facilities worldwide with neutron imaging capabilities Smaller flux neutron sources including research reactors and neutron generators are under-utilized, partially due to the relatively low sensitivity of existing detector techniques To fully exploit this non-destructive evaluation technique requires improved neutron imaging techniques PSI Neutron imaging Brochure 2016 June 28, 2021 iWoRID 2021 1
Motivation Mirror Current Limitations Neutrons Sample The most common real-time neutron imaging systems use a scintillator screen lens coupled to a CCD, CMOS or Intensified Camera Scintillator Light collection of the lens is often < 0.1% Screen The basic trade-off to be made is resolution vs sensitivity: Gd2O2S:Tb (GADOX) is about 100X more efficient at thermal neutron capture than 6LiF:ZnS • Resolution can be tens of microns at 50% capture efficiency Lens • Lens coupling can reduce light at sensor to < 1 photon/neutron reducing effective sensitivity CCD 6LiF:ZnS is generates about 100X greater light than GADOX per neutron CMOS iCMOS • Resolution of hundreds of microns at ~20% capture efficiency camea • Lens coupling provides tens of photons/neutron with smaller impact on sensitivity Limited ability for time resolved imaging – energy selective or stroboscopic June 28, 2021 iWoRID 2021 2
Motivation Neutrons Intensified Neutron Phosphor Solution Scintillator Image Intensifiers can be made neutron sensitive by adding a scintillator to the input window Fiber Optic Window -200/+50V Photocathode This enables a significant increase in sensitivity by amplifying the light generated in the scintillator prior Photoelectrons 0V to imaging by a CCD or CMOS imager MCP Imaging optics between a 75 mm detection area and a +1000V typical CMOS imager can be < 0.1% efficient and the Amplified Electrons intensifier compensates for this inefficiency Phosphor +6500V GADOX screens can be used for cold and thermal Glass Window neutrons to simultaneously maximize detection efficiency and resolution ~ 5,0000X photon gain Can be gated ON/OFF in tens of ns Imaging Optics June 28, 2021 iWoRID 2021 3
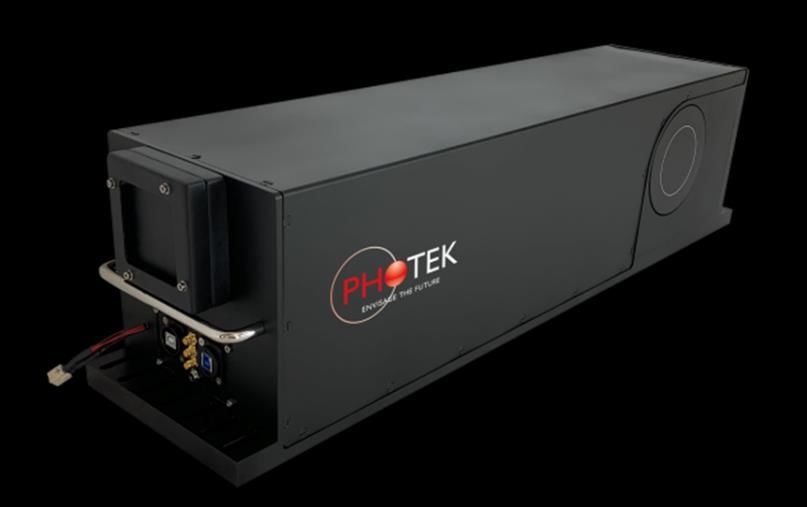
Camera System Mirror Neutrons System Description Sample 7.3 mg/cm2 Gd2O2S:Tb screen, 20 µm thick, no aluminizing 75 mm diameter Image Intensifier with Fiber optic input, S20 photocathode, single MCP, P46 phosphor, glass output window Image Intensifier (75 mm diameter) 45° front-surface mirror bends the optical axis 90° to a GADOX ~20m Schneider-Kreuznach Componon 2.8/40 macro lens HVPS Tuscen Dhyana 400D sCMOS camera with 2048 x 2408 6.5 µm pixels, 35 fps, 30,000 e- full well, 2 e- noise and -15°C cooling Gate Lens controlled via USB3 (38µm pixel at GADOX for 75 mm FOV) Module 50 ns 4 Mpix Intensifier bias voltages provided by modular High Voltage 35 fps Power Supply with integral 50 ns cathode gating and controlled Gate Cooled Control sCMOS by asingle board Gate Control Unit (GCU) controlled via USB2 Camera A beam synchronization pulse input to the GCU USB2 USB3 June 28, 2021 iWoRID 2021 4
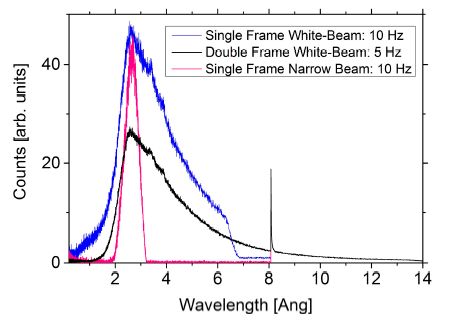
ISIS Beam Test Beam Test Parameters A beam test was performed in December 2019 at the IMAT cold-neutron imaging facility of Rutherford Appleton Labs ISIS pulsed neutron source The single frame white-beam setting was used, the blue spectrum shown from Kockelmann et. al., J. Imaging 2018, 4, 47 The GADOX screen has a calculated 85% neutron capture integrated over this spectrum with about 55% of these captures resulting in a detectable Internal Conversion Electron for an external Detection Quantum Efficiency of 47% Goals of the 24 hour test included: Measure resolution Measure effective QE Measure Contrast-to-Noise Feasibility of Tomography, Energy Selection, Neutron Counting June 28, 2021 iWoRID 2021 5
ISIS Beam Test Spatial Resolution Spatial resolution was determined using a Paul Scherrer Institut Line Gauge Prototype for Neutron Radiography with a Gadolinium line-pair test pattern and slant edge box The IMAT beam had a flux of 5 x 10⁶ n/cm2·s and an L:D of 250:1 The test pattern was placed 3.7 mm in front of the GADOX screen yielding an image blur of about 15 µm, roughly 30 lp/mm The Image intensifier has limiting resolution of 16 lp/mm Nyquist limit is ~ 13 lp/mm for the 38 µm pixel at 75 mm FOV and ~ 30 lp/mm for the 16 µm pixel at 30 mm FOV A 300 s acquisition is shown here in the 75 mm FOV mode, and the 10 lp/mm pattern is just resolved June 28, 2021 iWoRID 2021 6
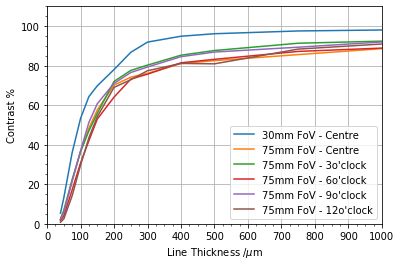
ISIS Beam Test Spatial Resolution The PSI test pattern was moved around the perimeter of the Image Intensifier’s 75 mm FOV as well as the center for both 75 mm and 30 mm FOV Example 3.33 lp/mm line contrast The limiting resolution was measured using the line contrast between adjacent line pairs as shown in the adjacent image: − = + In all cases the limiting resolution is 10 lp/mm for the 75 mm FOV and 12.5 lp/mm for the 30 mm FOV There is a slight right-left, up-down discrepancy possibly related to the Image Intensifier June 28, 2021 iWoRID 2021 7
ISIS Beam Test Spatial Resolution The Modulation Transfer Function (MTF) was also calculated using the slant edges incorporated into the PSI test pattern Slant Edges used for MTF calculation Shown here are MTFs at the center of the FOV for both 75 mm – X 75 mm and 30 mm FOV and in X and Y directions 75 mm – Y Modulation Transfer Function 30 mm – X The resolution values are in good agreement with 30 mm – Y those obtained visually and using the line contrast technique The X-Y directional variation, while small, is observable at both magnifications. Spatial resolution showed no change down to 5 s integrations Resolution lp/mm June 28, 2021 iWoRID 2021 8
ISIS Beam Test Detective Quantum Efficiency A simplified model is used to estimate the detective Quantum Efficiency of the system assuming Poisson Statistics dominate: 1 1 = ≅ × × × + 2 2 N(x) is the number of neutrons contributing to signals in a pixel of size x, FN is the neutron flux in units of n/cm2s, T is the integration time, and r is the neutron correlation scale length in cm The SNR of was measured over a 24 mm x 24 mm region with different binned pixel sizes, a flux of 2 x 10⁸ n/cm2·s, a 5 s signal image and a 150 s flat field image Fitting the data with the above equation finds DQE = 16.1% Correlation length = 80µm June 28, 2021 iWoRID 2021 9
ISIS Beam Test Detective Quantum Efficiency The difference between the estimated DQE of 16% and the Representation of various paths for ICE theoretical 47% implies a Noise Factor of about 1.7 within the GADOX layer The Noise Factor captures degradation in the signal due to the wide pulse height distribution of the neutron signal in GADOX ICE emitted near the surface of the screen can deposit little energy while higher energy ICE emitted along the screen can deposit large energy Other sources of noise include non-uniformities throughout the detection chain and the multiplication process in the MCP June 28, 2021 iWoRID 2021 10
ISIS Beam Test 5 mm 5 mm Cu Al Contrast to Noise A contrast target was fabricated using 10 thicknesses each of C101 Copper and 6082-T651 grade Aluminum, from 5 mm through 14 mm in 1 mm increments Each section of the target was 5 mm x 5 mm in cross-section. 14 mm 14 mm The target was imaged using a nominal neutron flux of 2 x 10⁷ n/cm2·s Cu Al and L:D of 125:1, with 600 s integration time The mean and standard deviation of an interior region of each step was calculated Notice that there is non-uniform signal over each step believed to be due to neutron scattering from thicker portions of the wedge to thinner portions. This is not accounted for in the following calculations June 28, 2021 iWoRID 2021 11
ISIS Beam Test Contrast to Noise Contrast-to-Noise is calculated for using the mean intensity and standard deviation of two adjacent regions, A and B, as − = 2 + 2 From this data the CNR between the 1.0 and 1.1 cm thick Aluminum sections is found to be 2.6 and for the same copper sections the CNR is 11.4 Assuming that a CNR of 1.0 is the minimum detectable contrast we find for the aluminum data that the minimum contrast detectable is about 0.26% and the minimum detectable contrast for the copper data is about 0.30%, indicating that there are roughly 350 gray scales in the image This is a lower limit due to effects of neutron scattering June 28, 2021 iWoRID 2021 12
ISIS Beam Test Tomography Data for a tomograph was taken using a flux of 1.1 x 10⁷ n/cm2·s and L:D of 125:1 180 projections were obtained with a total with 105 s integrations per projection 1 Just beginning reconstruction work. 3 Minimum exposure times are 2.5 s Plan to determine tomographs 2.5 s integration performance as a function of 105 s integration Preliminary reconstruction integration time and pixel size. June 28, 2021 iWoRID 2021
ISIS Beam Test Single Neutron Imaging To demonstrate single neutron counting we placed neutron shielding in from of the camera to reduce the incident flux to about 1 x 10⁴ n/cm2·s Acquired 35 fps, as shown in this vide The variation in intensity reflects the variation in light output per neutron. For neutron generators this mode will be very effective as it is close to noiseless and spatial resolution is significantly improved due to centroiding of each neutron spot. June 28, 2021 iWoRID 2021 14
Future Directions Future Modifications & Tests Make a replaceable scintillator screen deposited on a thin fiber optic to enable optimization of screens for different applications and for long-term field replacement – design has recently been completed Test Gd2O2S:Pr with ~ 7 µs decay time for use in energy resolved imaging as compared to 1.5 ms decay of Gd2O2S:Tb Testing with a neutron generator to occur this fall Implementation of neutron counting algorithm to perform real- time event centroiding based on algorithm developed for photon counting camera June 28, 2021 iWoRID 2021 15
Photek Limited

26 Castleham Road, St Leonards on Sea,
East Sussex, TN38 9NS, UK

T +44 (0)1424 850 555
F +44 (0)1424 850 051
E sales@photek.co.uk

www.photek.com
You can also read