Cost Growth Target Technical Advisory Group - 10:00 AM - 11:00 AM October 27, 2021 - Oregon.gov
←
→
Page content transcription
If your browser does not render page correctly, please read the page content below
Cost Growth Target
Technical Advisory Group
                      October 27, 2021
                    10:00 AM – 11:00 AM

 https://www.oregon.gov/oha/HPA/HP/Pages/cost-growth-target-tag.aspx

                                                                       1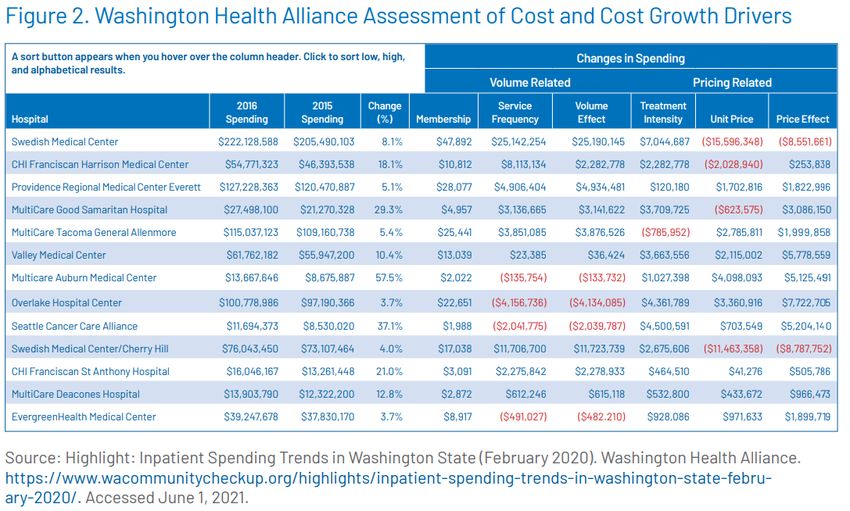
Agenda

• Introductions
• August meeting summary
• Updates
• Analytic planning: intensity analysis
• Wrap Up / Next Meeting

                                          2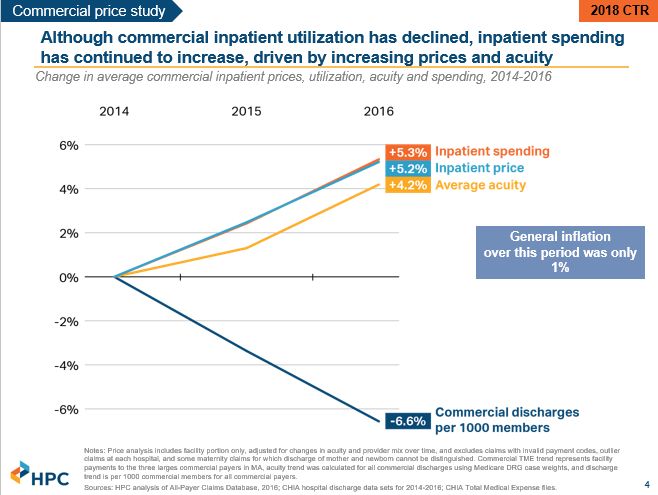
August meeting summary
• Updates: overview of 2022 Advisory Committee, validation tracking, data Q&A
• Held RAC for data submission rules
• September meeting canceled

                                                                                3
Updates
• New 2022 Advisory Committee
• Validation Status Update
• Data Submission Resources

                                4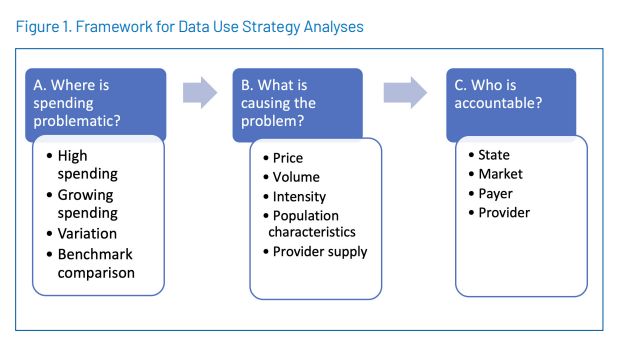
Advisory
Committee
recruitment

              5
Validation
status update
6CGT-1 Validation status update
Submission Percent of
• Validation updates emailed to status
Number
total
data submitter contacts every Received
Friday Awaiting re-submission
• Some early data clarification Expected*
chats have already
highlighted process Validation status Number
Percent of
improvements - thank you! total
In Stage 1
In Stage 2
In Stage 3
Finalized
7CGT-1 Validation status update: process
improvements
• Confirm that there are no red cells, but there may be some exceptions (ex. risk score of
0)
• Confirm TME_PROV data is at the provider organization level, not the individual
provider level
• each unique combination of year, provider organization, line of business, and attribution hierarchy
ONLY exists in one row
• Confirm there are not multiple provider organizations per TIN (but there can be
multiple TINs per provider organization) in PROV_ID
• Confirm use of the most recent submission template (mostly to check the formulas)
• Confirm that all expected lines of business are in TME_ALL and MARKET_ENROLL tabs
• Cursory review of standard deviation to identify any values that may require additional
clarification 8Validation status update: common issues
Provider organization-level data
• Separately listing individual providers under the same provider organization
Incorrect Correct
Provider Org Provider Last Provider First Provider Org Provider Last Provider First
Name Name Name Name Name Name
(blank allowed) (blank allowed) (blank allowed) (blank allowed)
Health System A Potter Harry Health System A
Health System A Granger Hermione
Health System A Weasley Ron 9
• Provider organization names in tab 3 not present in tab 7 and vice versa
Getting past these checks are crucial for creation of the statewide file; OHA staff anticipates a
significant amount of time will be spent on wrangling provider organization-level dataValidation status update: common issues
• Provider organization rows with 0 Member Months
• Risk-adjusted standard deviation (SD) PMPM is high given other data
• Discrepancy in TME tabs 2-4 (line of business code) and MARKET
ENROLL tab (market enrollment category)
• Not using most recent CGT-1 version 1.4
Some data issues may be resolved without a full file resubmission; keep
this in mind if OHA team reaches out for data clarification
10Validation FAQs
• What if I haven’t heard back from OHA about my CGT-1 file? Do I need
to do something?
• No news is good news. Our team will reach out to data reporting contacts if a
follow-up is needed, otherwise, every payer will hear from us when they get to
Stage 3 to review their Stage 1 and Stage 2 outputs.
• What if my team found a reporting error and we’ve already submitted
our CGT-1 file?
• If you found something before our team has reached out to you, please email
us right away! If a resubmission is needed, we will email whatever notes we
have on the file to aid in the rebuild.
11Data
Submission
Resources
12Data Submission Resources
Cost Growth Target data submission webpage:
https://www.oregon.gov/oha/HPA/HP/Pages/cost-
growth-target-data.aspx
Submission materials
• Data Submission Template version 1.4
[CGT-1]
• Data Submission Manual [CGT-2]
• Supplemental SD Calculation
• Supplemental BH Codes
• Statistical Analysis
• Data Submissions FAQs 13Analytic planning: intensity analysis
14Cost growth target programs divide
analysis and reporting into:
1. Routine standardized analyses to
inform, track, and monitor impact
of the cost growth target
2. In-depth, ad hoc analyses of the
potential drivers of high cost, cost
variation, and cost growth that are
identified from the routine
reports.
Meeting attachment #3
Available https://www.milbank.org/wp-content/uploads/2021/06/Peterson-Milbank-Data-Use-Strategy_6.pdf 15CGT-1 data APAC Data
16CGT-1 data APAC Data
17What is Intensity?
“ Service intensity refers to the scope and types of services utilized for
treatment. It captures differences in the site of care (e.g., inpatient
vs. outpatient) and treatment modality (e.g., robot-assisted vs.
manual surgery). Service intensity is complex to capture analytically.
If it is not captured, it can be masked as a change in price (e.g., when
a new expensive drug replaces an old one). Service intensity is often
referred to as “service mix” or “provider mix.”
There is no standard method for assessing the impact of changes in
”
service intensity.
Meeting attachment #3
Available https://www.milbank.org/wp-content/uploads/2021/06/Peterson-Milbank-Data-Use-Strategy_6.pdf 18“Intensity” can cover a lot of concepts
Concepts that directly relate to Concepts that directly relate to
patients and individual members: medical services:
Risk score & risk adjustment Service intensity
Case mix analysis Unit price analysis
Acuity Upcoding
19What are we trying to measure?
Substitution of Service: Identify when a patient with the same
condition or treatment need is receiving a different (more expensive,
more invasive) service or procedure than what they could have
received for that condition (e.g. CT scan instead of X-ray).
How much of a total spending increase is due to changes in service
intensity? Identify the “widget” with the greatest potential impact (as
opposed to the “customers” to target). This is likely the priority for Cost
Growth Target programs.
20States are exploring different
approaches for intensity analysis
21Ex. Washington Health Alliance
Treatment intensity:
“the impact of more
or fewer services
used in treatments.”
22
https://www.wacommunitycheckup.org/highlights/inpatient-spending-trends-in-washington-state-february-2020/Ex. Massachusetts Health Policy Commission
23
https://www.mass.gov/service-details/annual-cost-trends-reportA top-down approach
Unit price
Price
Service
Total intensity
Spending
Membership
Utilization
(volume) Service
frequency
24A bottom-up approach
Identify Which
Identify Identify
associated treatments Stratify Dx Establish
common trends that
Dx codes for are by age and statewide
inpatient diverge from
that appropriate sex profile
procedure expected
procedure for that Dx?
25Discussion
• Pros and cons of the
different approaches?
• Other ideas for thinking
about intensity?
• How does intensity
intersect with low-value
care?
26Next Meeting
Wednesday, November 24 [CANCELED]
Updates sent via email
27You can also read


