City of Menasha COVID-19 Data Summary Date: April 14, 2022
←
→
Page content transcription
If your browser does not render page correctly, please read the page content below
City of Menasha COVID-19 Data Summary
Date: April 14, 2022
Summary/What’s New
On Wednesday, April 13, the Transportation Security Administration (TSA) extended the requirement
to wear facial coverings on public transportation and in public transportation hubs until May 3.
The Food and Drug Administration (FDA) authorized a second mRNA booster dose for people 50
years and older, and certain immunocompromised individuals. This recommendation was supported
by the CDC and WI DHS. The Menasha Health Department will be administering the 2nd booster for
eligible people during our weekly Wednesday vaccination clinics.
The CDC updated their masking guidance to correlate to COVID-19 Community Levels. Knowing which
COVID-19 Community Level your county is in will help determine which prevention measures are
needed to protect yourself and your family.
The virus that causes COVID-19 is still here, and can cause serious illness and death in individuals at
high risk and those who are not up to date with their COVID-19 vaccines. Consider your risks and the
risks of those you live or interact with when choosing whether to wear a mask when in public places;
and consider getting the COVID-19 vaccine if you haven’t already for the most protection.
Vaccination is the best tool to prevent serious disease, hospitalization, and death due to COVID-19.
Wisconsin residents ages 5 and older are eligible to receive the COVID-19 vaccine. COVID-19
vaccines are safe, effective, and free. You do not need an ID or insurance to get a vaccine.
o Visit the Menasha Health Department’s COVID-19 vaccine webpage for clinic information.
o If you have questions about the COVID-19 vaccine, call: 211 or 877-947-2211. Language
assistance is available. Visit vaccines.gov to find a place to get your FREE COVID-19 vaccine.
Everyone ages 12 and older is recommended to get a booster dose for the best protection against
COVID-19 and circulating variants.
COVID-19 testing is available in the community if you are in need of a test. Visit our testing sites
webpage for more information. You may also order two sets of four free at-home test kits from the
federal government here.
o Follow current isolation and quarantine guidance if you test positive for COVID-19, have
symptoms, or have been exposed.
As of April 12, 61.8% of City of Menasha residents have received at least one dose of the vaccine and
59.1% are fully vaccinated. To read more about vaccine data, see this dashboard.
Currently in the City of Menasha the burden of confirmed and probable COVID-19 cases is
moderately high and the activity level is high. The combined case rate for this 2-week period (Mar 30
– Apr 12) is 82.3 cases per 100,000 population, which is an increase from the case rate of 66.2 from
the previous 2-week period (Mar 23 – Apr 5).
Background
This data summary provides preliminary data on the cases of COVID-19 in the City of Menasha from
March 30, 2022 – April 12, 2022. Data included in this report is for lab-confirmed cases of COVID-19 and
probable cases of COVID-19. A person is counted as a probable case of COVID-19 if they have a positive
antigen test OR has symptoms of COVID-19 AND has a known exposure to COVID-19. Case counts
utilized for all graphs and tables are based on the date public health staff received and recorded the test
results. Numbers here may not represent final case counts for this reporting period.
Page 1 of 7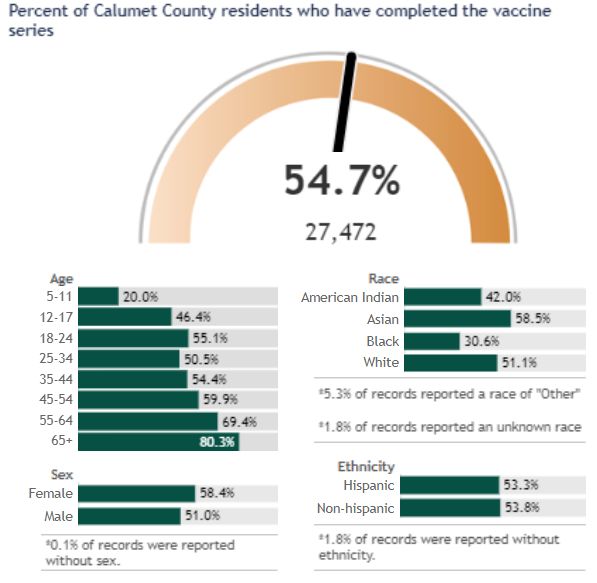
More Information
Additional resources and information about COVID-19 can be found on the following websites:
City of Menasha Health Department COVID-19 webpage
Wisconsin Department of Health Services
Winnebago County Health Department
Calumet County Public Health Division
Centers for Disease Control and Prevention
Number and percent of City of Menasha, Calumet and Winnebago County
residents who have received the COVID-19 vaccine (as of April 12)
Completed
Received at Completed Booster/Additional
Population
least 1 dose vaccine series dose (N/D=no data
available)
City of
11,200 (61.8%) 10,705 (59.1%) N/D 18,114
Menasha*
Calumet 28,574 (56.9%) 27,472 (54.7%) 15,431 (30.7%) 50,209
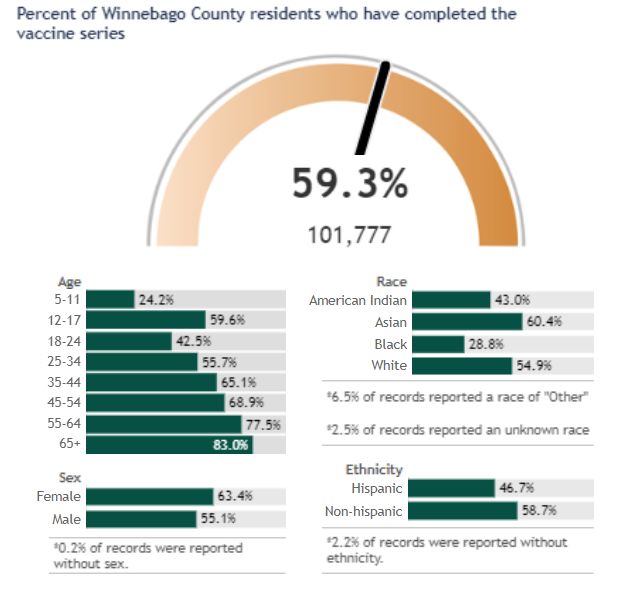
Winnebago 106,893 (62.3%) 101,777 (59.3%) 56,470 (32.9%) 171,631
*Vaccine data was retrieved from: https://www.dhs.wisconsin.gov/covid-19/vaccine-data.htm under the “Municipality” tab.
Other municipal-level demographic data is not yet available. To view more COVID-19 vaccine data, please visit:
https://www.dhs.wisconsin.gov/covid-19/vaccine-data.htm
Age range and ethnicity COVID-19 vaccine data for Calumet and Winnebago
County residents who have completed the vaccine series (as of April 12)
Page 2 of 7Case counts, case rate per 100,000 people, burden class, trajectory and activity
level in the City of Menasha and the State of Wisconsin for the past two weeks (Mar
30 – Apr 12)
Note: The case rate, burden class, trajectory class, and activity level reflect both lab-confirmed and probable cases.
Case Case Rate Burden Trajectory Class Activity Population
Count for (per Class* (N/A=no statistically Level* **
Past 2 100,000 significant change;
Weeks people) N/D=no data available)
City of Moderately
15 82.8 N/D High 18,114
Menasha High
Wisconsin 8,882 152.3 High Growing High 5,832,655
*Burden Class is based on the case rate per 100,000 people in the past two weeks. Visit the DHS website for more information about Burden
and Activity Level visit; https://www.dhs.wisconsin.gov/covid-19/local.htm
**Population for the City of Menasha was retrieved from
https://data.census.gov/cedsci/table?q=Menasha%20City,%20Wisconsin&t=Age%20and%20Sex&tid=ACSST5Y2019.S0101&hidePreview=false
Burden (lab-confirmed & probable case rate)
Case Rate per 100,000 residents in City of Menasha number of cases in the
Burden Status
the past two weeks past two weeks
Low Case rate is less than or equal to 10. Less than 2 cases.
Case rate is greater than 10, but less Greater than 1 cases, but less than or
Moderate than or equal to 50. equal to 9 cases.
Case rate is greater than 50, but less Greater than 9 cases, but less than or
Moderately High than or equal to 100. equal to 18 cases.
Case rate is greater than 100, but Greater than 18 cases, but less than or
High less than or equal to 350. equal to 63 cases.
Case rate is greater than 350, but Greater than 63 cases, but less than or
Very High less than or equal to 1,000. equal to 181 cases.
Critically High Case rate is greater than 1,000. Greater than 181 cases.
Page 3 of 7City of Menasha COVID-19 laboratory confirmed and probable case rate trend and burden by 2-week periods*
4000
3500
3000
Rate per 100,000 people
2500
2000
1500
1000
500
0
*Refer to the table above for more information on burden categories and thresholds.
Page 4 of 7Current CDC COVID-19 Community Levels
Calumet County Winnebago County City of Menasha*
Current Status**
Low Low Low
*City of Menasha residents may reside in either Calumet or Winnebago County. The City of Menasha will take the higher level of the two
counties for COVID-19 Community Level indicators should the two counties differ. For more information on COVID-19 Community Levels, visit
this webpage: https://www.cdc.gov/coronavirus/2019-ncov/your-health/covid-by-county.html
**See table below for COVID-19 Community Level thresholds.
CDC COVID-19 Community Levels - Use the Highest Level that Applies to Your Community*
New COVID-19
Cases
Indicators Low Medium High
(Per 100,000 people
in the past 7 days)
New COVID-19 admissions
per 100,000 population (7-Number and percentage of laboratory confirmed and probable cases of COVID-19
by age range, cumulative and past two weeks
Cumulative Total Cases Total Cases in the Past Two Weeks
Number of Percentage of Number of Percent of Cases in Past Two
Age Group Cases Total Cases Cases Weeks
0-9 422 8.2% 1 6.7%
10-19 728 14.1% 2 13.3%
20-29 824 16.0% 2 13.3%
30-39 949 18.4% 5 33.3%
40-49 785 15.2% 3 20.0%
50-59 705 13.7% 0 0.0%
60-69 436 8.4% 1 6.7%
70-79 200 3.9% 1 6.7%
80+ 114 2.2% 0 0.0%
Combined Total 5,163 100% 15 100%
Daily new cases (lab-confirmed and probable) in the City of Menasha and the
7-day average of total new cases
3 1.8
1.6
Daily Number of New Cases
1.4
2 1.2
1.0
0.8
1 0.6
0.4
0.2
0 0.0
3/30 3/31 4/1 4/2 4/3 4/4 4/5 4/6 4/7 4/8 4/9 4/10 4/11 4/12
Date
Daily New Cases 7-day Average of New Cases
Page 6 of 7COVID-19 Metrics
Metric Thresholds Current Status
Total confirmed and Red (High): > 100 60.7 cases per 100,000 /
probable cases per Orange (Substantial): 50-99.99 7 days
Case Incidence 100,000 in the past 7 Yellow (Moderate): 10-49.99
days Blue (Low): 0-9.99
Percent PCR Positive Red: >10% 12.3% positive tests /
7-day average Yellow: 5-10% day
Green: 90% 97.0% of inpatient beds
inpatient beds in the Yellow: 80-90% occupied
community that are Green: 90% 93.0% ICU beds
Fox Valley intensive care unit Yellow: 80-90% occupied
HERC Hospital beds in the Green: 15% 1.1% beds occupied by
inpatient beds in the Yellow: 10-15% patients with COVID-19
community that are Light Green: 5-10%
occupied by patients Dark Green:You can also read


