Cat Coat Color, Personality Traits and the Cat-Owner Relationship Scale: A Study with Cat Owners in Mexico - MDPI

Page created by Monica Garner
 
CONTINUE READING
Cat Coat Color, Personality Traits and the Cat-Owner Relationship Scale: A Study with Cat Owners in Mexico - MDPI
animals
Article
Cat Coat Color, Personality Traits and the Cat-Owner
Relationship Scale: A Study with Cat Owners in Mexico
Mónica Teresa González-Ramírez *                     and René Landero-Hernández

                                          School of Psychology, Autonomous University of Nuevo León, San Nicolás de los Garza C.P. 64455, Mexico;
                                          rene.landerohr@uanl.edu.mx
                                          * Correspondence: monica.gonzalezrz@uanl.edu.mx; Tel.: +52-81-833-382-33

                                          Simple Summary: Studies regarding the cat-owner bond are quite rare, and several aspects like
                                          personality trait differences in cats related to coat color and the cat-owner relationship require more
                                          research. With that purpose, we apply a survey to 211 cat-owners from Mexico. Owners perceived
                                          their cats as being bold and friendly. Gray cats had the highest score for being as shy, aloof and
                                          intolerant, while orange cats had the highest scores for being trainable, friendly and calm. Tabbies the
                                          highest for bold and active, tricolor cats for stubborn, and bicolor cats for tolerant. Higher cat-owner
                                          interaction was related with an active and friendly personality and with lower score of aloofness.
                                          Higher emotional closeness was related with an active, bold and friendly personality, and higher
                                          perceived cost was related with lower score of boldness.

                                          Abstract: Studies regarding the cat-owner bond are quite rare, and several aspects merit more
                                          research, including personality trait differences in cats related to coat color and the cat-owner
                                          relationship. The objectives of the study were to describe, from the perspective of their owners,
                                the personality traits of cats based on their coat colors and to evaluate the relationships among the
         
                                          Cat Owner Relationship Scale (CORS), its subscales and the traits of cats. Therefore, the CORS was
Citation: González-Ramírez, M.T.;
                                          translated into Spanish, and its psychometric properties were assessed. For the personality traits of
Landero-Hernández, R. Cat Coat
Color, Personality Traits and the
                                          cats, participants answered a 7-point Likert scale indicating the extent to which they agreed with the
Cat-Owner Relationship Scale: A           following characteristics in describing their cats: active, aloof, bold, calm, friendly, intolerant, shy,
Study with Cat Owners in Mexico.          stubborn, tolerant and trainable. 211 cat owners living in Mexico participated. Owners perceived
Animals 2022, 12, 1030. https://          their cats as being bold and friendly. Gray cats had the highest score for being as shy, aloof and
doi.org/10.3390/ani12081030               intolerant, while orange cats had the highest scores for being trainable, friendly and calm. Tabbies
                                          the highest for bold and active, tricolor cats for stubborn, and bicolor cats for tolerant. The 3 CORS
Academic Editors: Atsuko Saito,
Saho Takagi and Minori Arahori
                                          subscales had adequate psychometric properties when evaluated separately. Cat-owner interaction
                                          was positively correlated with an active and friendly personality and negatively correlated with
Received: 9 January 2022                  aloofness. Emotional closeness was positively correlated with an active, bold and friendly personality,
Accepted: 10 April 2022
                                          and perceived cost was negatively correlated with boldness.
Published: 15 April 2022

Publisher’s Note: MDPI stays neutral      Keywords: cat-owner interaction; cat personality traits; coat color
with regard to jurisdictional claims in
published maps and institutional affil-
iations.
                                          1. Introduction
                                                Cats, dogs and other species are considered companion animals [1]. The preference
Copyright: © 2022 by the authors.
                                          for cats in households has recently increased [2], even surpassing preference for dogs in
Licensee MDPI, Basel, Switzerland.
                                          some countries [3], and in Europe, cats are the most common pet [4]. However, some
This article is an open access article
                                          years ago, Bernstein [3] indicated that studies regarding the cat-owner bond were still
distributed under the terms and           quite rare and that many aspects regarding cats and the cat-owner relationship required
conditions of the Creative Commons        further study. Recently, Ines et al. [5] asserted that little is known about the emotional
Attribution (CC BY) license (https://     relationships that cats form with humans. One issue requiring more research is personality
creativecommons.org/licenses/by/          trait differences in cats based on their coat colors. Stelow et al. [6] suggested that people
4.0/).

Animals 2022, 12, 1030. https://doi.org/10.3390/ani12081030                                                 https://www.mdpi.com/journal/animals
Cat Coat Color, Personality Traits and the Cat-Owner Relationship Scale: A Study with Cat Owners in Mexico - MDPI
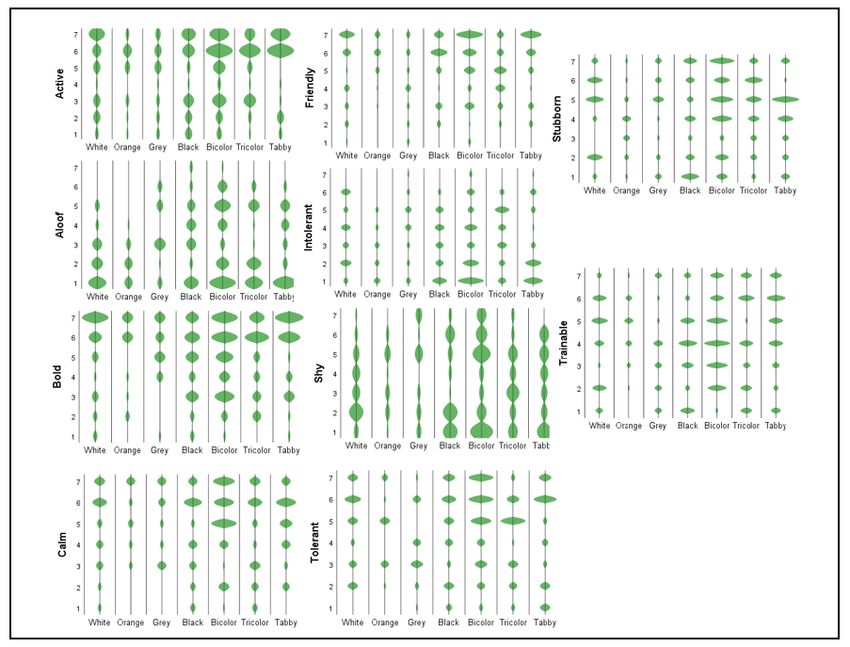
Animals 2022, 12, 1030                                                                                             2 of 21

                         commonly believe that calico cats are “crazy”, black cats are “wild and unpredictable”, and
                         orange cats are “friendly”.
                               The association between physical appearance and personality in mammals has been
                         investigated in different species. In his famous research on fox domestication, Belyaev [7]
                         concluded that physical differences were due to prolonged selection for a tame genotype.
                         Díaz Videla [8] mentioned that specific phenotypes, e.g., coat color, could be considered
                         indicators of personality traits in dogs. When Díaz Videla performed a systematic review
                         studying black dog syndrome, he only found 18 studies that met his inclusion criteria
                         for investigating personality traits associated with coat color in dogs, demonstrating the
                         scarcity of studies in this regard [8].
                               The hypothetical relationship between coat color and personality traits is based on the
                         fact that the pigment melanin shares a synthesis pathway with a group of catecholamines
                         and neurotransmitters [9], such as dopamine, which may lead to associations between
                         pigmentation and personality traits [8]. Although such associations have rarely been
                         studied in domestic cats [10], Stelow et al. [6] cited a series of studies indicating that a
                         cat’s personality is stable from kittenhood, and that a genetic component is apparently
                         involved; for example, Siamese cats have been reported to be more demanding compared
                         with other breeds.
                               Delgado et al. [10] reported that the few studies related to cat color and personality
                         show mixed results. In their research, they asked about the degree to which people felt
                         that the color of a cat reflected specific personality traits and found that people believe that
                         orange cats are the friendliest, tricolor cats the most intolerant, and white and tricolor cats
                         the most aloof. They found no significant differences in terms of stubbornness. In the same
                         study, white cats were reported to be perceived as less active, shyer and calmer than other
                         cats. In another study, Stelow et al. [6] reported that cat owners believe that bicolor cats are
                         more frequently aggressive toward humans.
                               The impact of this type of research can be reflected in cat adoption and abandonment.
                         People report that when selecting a cat to adopt, the cat’s personality is a more important
                         factor than its color. Nevertheless, adoption decisions are influenced by the color of a
                         cat when people have beliefs about the relationship between color and personality [10].
                         Thus, although adopting people say that color is not relevant and that they consider how
                         playful cats are and how willing they are to interact with people black cats usually remain
                         in shelters longer before being adopted [11]. In addition, Carini et al. [12] found that coat
                         color can be advantageous or disadvantageous with respect to adoption opportunities for
                         cats in shelters.
                               Although Evans et al. [13] suggested that the features that humans consider when
                         choosing a cat remain unclear, they cite studies mentioning that cats are often selected for
                         their color (e.g., Robinson [14]). Evans et al. [13] added that the personality of a cat can
                         predict owner satisfaction with the relationship and documented the important impact of
                         pets, which are often thought of as family members, on the lives of their owners.
                               When pets are perceived as family members, they can serve as social resources that
                         promote human health and well-being [15]. Thus, a good cat-owner relationship can
                         reasonably be anticipated to generate benefits for the cat’s owner and motivate him or her
                         to care for and ensure the cat’s quality of life; in contrast, a bad relationship may result in
                         abuse, neglect or even abandonment [2].
                               Howell et al. [2] adapted the Monash Dog-Owner Relationship Scale (MDORS), de-
                         signed by Dwyer et al. [16] to evaluate the cat-owner relationship. This scale is known as
                         the Cat Owner Relationship Scale (CORS) and is based on social exchange theory, which
                         specifies that relationships are maintained only when the perceived cost and benefits are
                         balanced or when the perceived benefits are greater than the costs of the relationship. The
                         CORS includes 1 negative component of the relationship, perceived cost, and 2 components
                         more oriented toward evaluating the relationship: interactions and perceived emotional
                         closeness [2].
Cat Coat Color, Personality Traits and the Cat-Owner Relationship Scale: A Study with Cat Owners in Mexico - MDPI
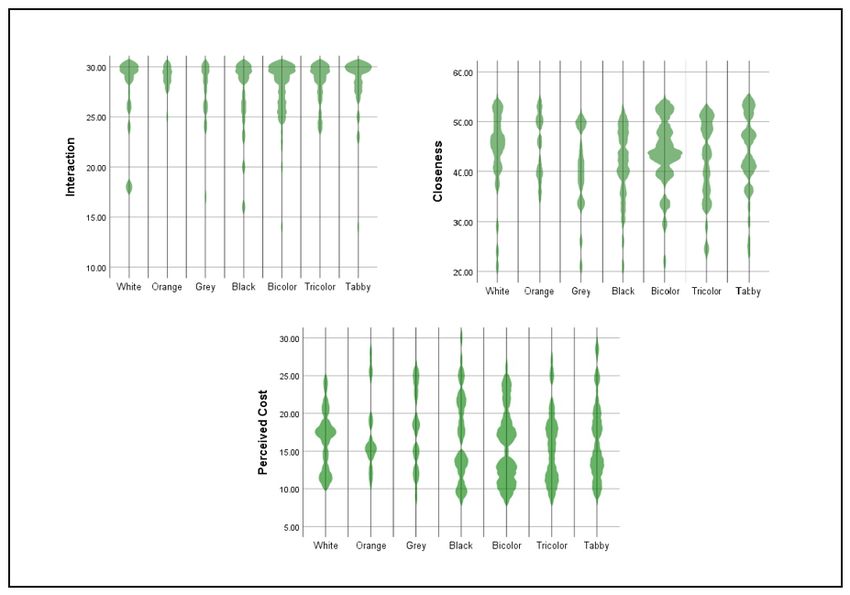
Animals 2022, 12, 1030                                                                                              3 of 21

                               Based on the above information, the main objectives of the present study were to
                         describe, from the perspective of their owners, the personality traits of cats based on their
                         coat colors and to evaluate the relationship between the CORS subscales and the personality
                         traits of cats. Accordingly, the CORS needed to be translated into Spanish and evaluated
                         for its psychometric properties.

                         2. Materials and Methods
                         2.1. Participants
                              Cat owners living in Mexico participated in this study. Snowball sampling was used
                         by asking participants to seek other people with cats to answer the questionnaire. An
                         online system (SurveyMonkey.com accessed on 1 July 2019) was used. The survey link
                         was posted on the author’s wall on Facebook, and contacts were asked to share it. No
                         cat characteristics were used as inclusion criteria. The survey was closed after 2 weeks of
                         no new participants. We received 235 questionnaires, incomplete ones were eliminated,
                         resulting in a sample of 211 participants.

                         2.2. Instruments
                               The Cat Owner Relationship Scale (CORS), adapted by Howell et al. [2] from the
                         MDORS [16] was used. The CORS consists of 26 items scored on a 5-point Likert-type
                         scale and is divided into 3 subscales, with 6 items for the pet-owner interaction subscale,
                         11 items for the perceived emotional closeness subscale and 9 items for the perceived
                         cost subscale. Howell et al. [2] reported adequate psychometric properties for the CORS.
                         Considering that a version of the MDORS has been translated into Spanish for the Mexican
                         population, with adequate psychometric properties [17], this translation was used for the
                         present study, replacing the word dog with cat and using the back translation method
                         for the items added by Howell et al. [2] for the CORS. The version used in this study is
                         presented in Appendix A.
                               For the personality traits of cats, the research by Delgado et al. [10] was used as a
                         reference. Using a 7-point Likert scale (ranging from totally agree to totally disagree), the
                         participants were asked: from your perspective, how present are each of the following
                         characteristics in your cat. Characteristics were: active, aloof, bold, calm, friendly, intoler-
                         ant, shy, stubborn, tolerant and trainable (Appendix B). These 10 traits were selected by
                         Delgado et al. [10] based on previous studies. To facilitate the comparison of personality
                         traits between cats grouped by color, an index ranging from 0 to 100 was calculated based
                         on the intragroup mean such that the extent to which a particular trait was evident in each
                         color group could be determined.
                               The question addressing cat colorpoint was a close-ended question referring to the
                         5 basic colors described in the study by Delgado et al. [10] and those in the study by
                         Stelow et al. [6], i.e., orange or yellow, tricolor, white, black, gray, bicolor and Siamese, with
                         the addition of tabby, calico, tortoiseshell and other. Owners were also asked to describe the
                         color of their cats if they felt that a description was necessary. Based on these responses, the
                         colors were recoded using the following classification: white, orange, gray, black, bicolor,
                         tricolor and tabby.
                               Participants also responded to some questions about demographics, including age,
                         gender and marital status. Additionally, they reported the number of cats in their houses
                         and whether they also had dogs. Participants were instructed to choose one of their cats
                         if they had more than one when providing demographic information (age and sex) and
                         completing the questionnaires described above. A pilot test was carried out to assess the
                         understanding of the questionnaires.

                         2.3. Statistical Analysis
                             All statistical analyses were performed with IBM® SPSS® Statistics version 26 (IBM,
                         Armonk, NY, USA). We began with a descriptive analysis of the variables using the
                         Kolmogorov-Smirnov test to determine whether the data had a normal distribution. Be-
Animals 2022, 12, 1030                                                                                              4 of 21

                         cause the data did not follow a normal distribution (p < 0.05), we used nonparametric tests,
                         Spearman correlations and the Kruskal-Wallis test, and chi-squared test to evaluate cat
                         color and sex association.
                              Also using IBM® SPSS® Statistics version 26, we conducted a simulation using
                         weighted data technique to estimate the results that would be obtained in a larger sample.
                         This technique gives cases specific weights, using simulated replication. With weighted
                         data the sample size can be modified arithmetically. To Weight Cases, in SPSS, from the
                         menus choose Data, then Weight Cases by, and a frequency variable should be selected. The
                         values of the frequency variable are used as case weights. In this study, each participant
                         was assigned a specific weight of 5, simulating that the sample and therefore the subgroups
                         were 5 times larger.
                              For the analysis of the CORS, Cronbach’s alpha coefficient was used, and exploratory
                         and confirmatory factor analyses were performed with SPSS Amos version 24 (Computer
                         Program. Chicago: IBM SPSS) using the maximum likelihood method. The following
                         goodness of fit statistics were considered: the chi-squared test (X2 /df) a good fit is indicated
                         by a small ratio, and values less than 3 indicate a good fit. The goodness-of-fit index (GFI)
                         developed by Jöreskog and Sörbom [18], a value of 1 indicates a perfect fit; the adjusted
                         goodness-of-fit index (AGFI) developed by the same authors, it corrects the GFI statistic
                         based on the degrees of freedom and the number of variables, and both the GFI and
                         AGFI reach a value of 1 when all residuals are zero [19]. The root mean square error of
                         approximation (RMSEA) values between 0.05 and 0.08 or less indicate a reasonable error of
                         approximation, and values greater than 0.1 indicate that the model is not adequate [20];
                         and the comparative fit index (CFI), values close to 1 indicate a very good fit [21].

                         2.4. Ethical Aspects
                              The research presented herein was evaluated and approved regarding its ethical and
                         methodological aspects by researchers of the Social and Health Psychology Research Group
                         of the Autonomous University of Nuevo León (CAPS-20-19-11). At the beginning of the
                         questionnaire, the purpose of the research was explained, and participants were asked to
                         proceed if they willingly agreed to participate. The anonymity and confidentiality of the
                         information provided was guaranteed at all times.

                         3. Results
                         3.1. Personality Traits Based on Cat Coat Color
                               In this study, 211 people with an average age of 34.3 years (SD = 10.9) participated,
                         81.0% of whom were female (n = 171), while 19.0% were male (n = 40). A total of 56.9% of
                         the participants were single, 37.9% were married or in a domestic partnership, 3.8% were
                         divorced or separated, and 1.4% were widowed. The participants indicated that they had
                         an average of 2.9 cats (SD = 3.2, median = 2.0). Overall, 48.8% of the participants reported
                         having at least one dog and one cat. The average age of the cats was 4.7 years (SD = 3.7);
                         57.0% of the cats were female, and 43.0% were male.
                               Table 1 provides the descriptive statistics and the estimated index for each personality
                         trait based on the coat color of the cat. Figure 1 shows individual distributions of the
                         scores. Most cats were described by their owners as bold and friendly. When comparing the
                         cats by coat color, gray cats had the highest scores for shyness, aloofness and intolerance,
                         while orange cats had the highest scores for trainability, friendliness and calmness. Tabby
                         cats had the highest scores for bold and active, tricolor cats for stubborn, and bicolor cats
                         for tolerant. In each of the personality traits, the mentioned coat color is more than one
                         standard deviation above the sample mean, with the exception of tabby cats in the bold
                         personality trait (Table 1).
Animals 2022, 12, 1030                                                                                                                                                       5 of 21

                          Table 1. Personality traits based on cat coat color.

                         Active        Aloof           Bold           Calm       Friendly       Intolerant        Shy       Stubborn   Tolerant   Trainable   Predominant Trait
                                                                                                 White cat (n = 29)
           Mean            4.8           2.3            5.3             4.8         5.2              3.6             3.3       4.4        4.8        4.1
           Median          5.0           2.0            6.0             5.0         6.0              4.0             3.0       5.0        5.0        5.0
                                                                                                                                                              Friendly and bold
            SD            2.1           1.3            2.0             1.9         2.0               1.7             1.6      1.9        1.8        1.9
           Index          68.5          32.5           75.9            68.5        73.9             51.2            46.8      62.6       68.0       58.6
                                                                                            Yellow or orange cat (n = 16)
           Mean            4.9           2.0            5.4             5.4         5.7              2.6             3.7       3.8        4.7        4.6
           Median          5.5           2.0            6.0             5.5         6.0              2.5             3.5       4.0        5.0        5.0        Friendly, calm
            SD            1.9           1.0            1.9             1.5         1.2               1.4             1.6      1.6        1.7        1.4            and bold
           Index          69.4          28.6           77.6            77.6        81.6             37.8            53.1      54.1       67.3       66.3
                                                                                                  Gray cat (n = 18)
           Mean            4.5           3.6            5.4             5.1         4.3              3.8             4.1       4.3        3.9        3.7
           Median          5.0           3.0            5.5             5.5         4.0              4.0             5.0       5.0        3.5        3.5
                                                                                                                                                               Bold and calm
            SD            2.0           1.7            1.5             1.6         2.0               1.8             2.2      2.1        1.7        2.1
           Index          64.3          50.8           77.0            73.0        61.1             54.0            58.7      61.9       55.6       52.4
                                                                                                  Black cat (n = 32)
           Mean            4.4           3.3            4.7             4.6         5.2              3.0             3.2       3.8        4.5        3.8
           Median          5.0           3.0            5.0             5.0         6.0              3.0             2.0       4.0        5.0        4.0
                                                                                                                                                                  Friendly
            SD            2.2           1.9            1.8             2.0         1.7               1.7             2.2      2.3        2.0        1.8
           Index          63.4          47.3           67.0            65.2        74.1             42.4            46.0      54.9       64.3       53.6
                                                                                                 Bicolor cat (n = 50)
           Mean            4.9           3.2            5.0             5.1         5.4              2.9             3.7       4.6        5.0        4.2
           Median          6.0           3.0            5.0             5.0         6.0              2.0             4.0       5.0        5.0        4.0
                                                                                                                                                                  Friendly
            SD            1.9           2.0            1.7             1.7         1.7               1.9             2.2      2.0        1.8        1.7
           Index          70.0          45.1           71.4            73.1        77.1             42.0            53.1      65.1       71.4       60.3
                                                                                                 Tricolor cat (n = 32)
           Mean            5.0           2.8            5.1             4.4         4.8              3.6             3.4       4.6        4.3        4.1
           Median          6.0           2.0            6.0             5.0         5.0              4.0             3.0       5.0        5.0        4.0
                                                                                                                                                               Bold and active
            SD            1.8           1.9            1.7             2.1         1.4               1.6             1.8      1.8        1.7        2.1
           Index          71.0          39.7           72.3            63.4        68.8             50.9            49.1      66.1       62.1       58.0
Animals 2022, 12, 1030                                                                                                                                                                                     6 of 21

                             Table 1. Cont.

                           Active          Aloof            Bold           Calm           Friendly       Intolerant          Shy         Stubborn         Tolerant        Trainable       Predominant Trait
                                                                                                          Tabby cat (n = 34)
           Mean               5.4           2.7             5.5             5.0              5.6             2.7            3.4              4.1             4.4             4.5
           Median             6.0           2.0             6.0             5.0              6.0             2.0            3.5              4.5             5.5             5.0
                                                                                                                                                                                          Friendly and bold
            SD               2.0           1.8             1.8              1.6              1.7            1.9            1.9               1.8            2.2              1.9
           Index             77.3          38.7            78.2            71.4             79.4            38.2           48.3             59.2            63.4            64.7
                          H = 5.130     H = 11.000      H = 6.200       H = 4.075        H = 10.956      H = 11.257     H = 3.152        H = 5.125       H = 6.344       H = 5.324
    Kruskal-Wallis test
                          p = 0.527     p = 0.0.88      p = 0.401       p = 0.667        p = 0.090       p = 0.081      p = 0.789        p = 0.528       p = 0.386       p = 0.503
                          H = 25.750    H = 56.211      H = 31.120      H = 20.454       H = 55.007      H = 56.503    H = 15.823        H = 25.722      H = 31.840      H = 26.722
       Weighted data
                          p = 0.001     p = 0.001       p = 0.001       p = 0.002        p = 0.001       p = 0.001      p = 0.015        p = 0.001       p = 0.001       p = 0.001
                                                                         Orange           Orange                                          Tricolor                        Orange
     Highest * Z-score    Tabby 1.78     Gray 1.30      Tabby 0.97                                       Gray 1.32       Gray 1.77                       Bicolor 1.35
                                                                           1.48             1.14                                            1.18                            1.38
                             SD: standard deviation; n: number of cats in this group; index: the extent to which the personality trait is evident in this coat color group; * Color with the highest score in each
                             personality trait.
Animals 2022, 12, x FOR PEER REVIEW                                                                                                       6 of 17
Animals 2022, 12, 1030                                                                                                                    7 of 21

                                Figure 1. Personality traits based on cat coat color: individual distribution.

                                     Although no significant differences in personality traits (p > 0.05) were found when
                                     Although no significant differences in personality traits (p > 0.05) were found when
                                comparing the groups based on coat color. The size of each group is a factor that could
                                comparing the groups based on coat color. The size of each group is a factor that could
                                explain it. When performing the Kruskal Wallis analysis with weighted data, simulating
                                explain it. When performing the Kruskal Wallis analysis with weighted data, simulating
                                that each group is 5 times larger, all differences were significant.
                                that each group is 5 times larger, all differences were significant.
                                3.2. Cat-Owner Relationship Scale: Mexican Version
                                3.2. Cat-Owner Relationship Scale: Mexican Version
                                      The following results address the psychometric properties of the Mexican version
                                of theThe   following
                                        CORS.            results address
                                                  The internal              the psychometric
                                                                   consistency    considering all   properties
                                                                                                       26 itemsof wasthe0.84,
                                                                                                                          Mexican
                                                                                                                               with version
                                                                                                                                      adequate of
                                the CORS.     The   internal  consistency    considering     all 26 items   was  0.84,
                                inter-item correlations except for items 11 (r = −0.054, item: My cat costs too much) andwith  adequate    inter-
                                item
                                16    correlations
                                   (r =  0.017, item:except     for items
                                                        How often      does11your
                                                                               (r = cat
                                                                                    −0.054,
                                                                                        stopitem:     My cat
                                                                                               you from        costs
                                                                                                           doing       too much)
                                                                                                                    things          andwant
                                                                                                                             that you     16 (rto=
                                0.017,When
                                do?).   item: How      often does
                                                eliminating    theseyour   catthe
                                                                      items,    stop  youincreased
                                                                                   alpha     from doing     things that you want to do?).
                                                                                                        to 0.85.
                                When    eliminating
                                      For  the closenessthese  items, the
                                                             subscale,  thealpha
                                                                             alphaincreased
                                                                                     was 0.86, to   0.85.
                                                                                                  and  the inter-item correlations ranged
                                fromFor0.35thetocloseness
                                                  0.69. Forsubscale,    the alpha
                                                              the interaction        was 0.86,
                                                                                  subscale,    theand  the inter-item
                                                                                                    alpha    was 0.80, correlations      ranged
                                                                                                                          and the inter-item
                                from   0.35  to  0.69. For  the  interaction   subscale,    the  alpha  was   0.80,   and
                                correlations ranged from 0.47 to 0.63. For the perceived cost subscale, the alpha was 0.74,the  inter-item   cor-
                                relations   ranged    from  0.47  to 0.63. For  the  perceived
                                and the inter-item correlations ranged from 0.29 to 0.56.          cost subscale,    the alpha   was   0.74, and
                                the inter-item
                                      Based on correlations
                                                   the exploratoryranged   from
                                                                       factor     0.29 to(Table
                                                                               analysis     0.56. 2) results, items 12 and 13 had high
                                      Based
                                factorial      on in
                                           loads   thethe
                                                        exploratory    factor analysis
                                                          cat-owner interaction            (Table
                                                                                     subscale    and2)low
                                                                                                       results,  items
                                                                                                           factorial     12 and
                                                                                                                       loads       13 perceived
                                                                                                                              in the  had high
                                factorial loads
                                emotional           in thesubscale,
                                              closeness     cat-owner    interaction
                                                                      which   is wheresubscale
                                                                                          they belongand according
                                                                                                          low factorial     loads
                                                                                                                        to the  CORSin the   per-
                                                                                                                                        authors.
                                ceived   emotional closeness
                                      A confirmatory                subscale,
                                                          factor analysis  waswhich     is where
                                                                                 performed      withthey   belong according
                                                                                                      3 correlated    factors. Thetocovariance
                                                                                                                                     the CORS
                                authors. the cat-owner interaction and perceived cost factors was the only nonsignificant
                                between
                                parameter (p = 0.690); however, when setting this parameter to zero, the goodness-of-fit
                                statistics still indicated that the model should be improved (X2 /df = 2.973; GFI = 0.766;
                                AGFI = 0.725; CFI = 0.684; RMSEA = 0.097: CI 0.090–0.104). A second model was tested
                                with items 12 and 13 in the cat-owner interaction subscale, and the only nonsignificant
                                parameter (p = 0.561) again corresponded to the same covariance, while the goodness-of-fit
                                statistics indicated improvement in the model (X2 /df = 2.905; GFI = 0.773; AGFI = 0.733;
                                CFI = 0.695; RMSEA = 0.095: CI 0.088–0.103).
Animals 2022, 12, 1030                                                                                                                                                                                       8 of 21

                                     Table 2. Exploratory factor analysis for the CORS.

                                                                                                                                   Perceived Emotional Closeness         Cat-Owner Interaction   Perceived Cost
 (7) ¿Con que frecuencia juegas con tu gato? (How often do you play games with your cat?)                                                                                         0.598
 (9) ¿Con qué frecuencia disfrutas del tiempo tan solo viendo a tu gato? (How often do you spend time enjoying watching
                                                                                                                                                                                  0.638
 your cat?)
 (15) ¿Con que frecuencia le hablas a tu gato? (How often do you talk to your cat?)                                                                                               0.608
 (21) ¿Con que frecuencia cargas o tienes en tus brazos a tu gato? (How often do you cuddle your cat?)                                                                            0.787
 (23) ¿Con que frecuencia tu gato está contigo mientras te relajas (por ejemplo mientras ves televisión)? (How often do you
                                                                                                                                                                                  0.641
 have your cat with you while relaxing, e.g., watching TV?)
 (26) ¿Con que frecuencia acaricias a tu gato? (How often do you pet your cat?)                                                                                                   0.758
 (2) Mi gato me da una razón para levantarme por la mañana. (My cat gives me a reason to get up in the morning.)                               0.606
 (4) ¿Con que frecuencia le das besos a tu gato? (How often do you kiss your cat?)                                                             0.401                              0.593
 (5) Quisiera que mi gato y yo nunca tuviéramos que separarnos. (I wish my cat and I never had to be apart.)                                   0.723
 (12) ¿Con que frecuencia compras cosas para tu gato (regalos, juguetes, etc.) (How often do you buy your cat presents?                                                           0.400
 (13) ¿Con que frecuencia le dices cosas a tu gato que no le dices a nadie mas? (How often do you tell your cat things that you
                                                                                                                                               0.284                              0.402
 do not tell anyone else?)
 (17) Quisiera que mi gato estuviera conmigo todo el tiempo. (I would like to have my cat near me all the time.)                               0.714
 (18) Si todos me dejaran, mi gato estaría ahí para mí (contaría con mi gato). (If everyone else left me, my cat would still be
                                                                                                                                               0.767
 there for me.)
 (20) Mi gato me ayuda en tiempos difíciles. (My cat helps me get through tough times.)                                                        0.803
 (22) Mi gato me brinda compañía constante. (My cat provides me with constant companionship.)                                                  0.734                              0.252
 (24) Mi gato siempre está para mí cuando necesito consuelo. (My cat is there whenever I need to be comforted.)                                0.798
 (25) ¿Qué tan doloroso crees que será para ti cuando tu gato muera? (How traumatic do you think it will be for you when
                                                                                                                                               0.569
 your cat dies?)
 (1) ¿Qué tan difícil es cuidar de tu gato? (How hard is it to look after your cat?)                                                                                                                 0.705
 (3) Hay cosas importantes relacionadas a tener a mi gato que no me gustan. (There are major aspects of owning a cat that I do
                                                                                                                                                                                                     0.615
 not like.)
 (6) Mi gato hace mucho desorden. (My cat makes too much mess.)                                                                                                                                      0.391
 (8) Me molesta que por mi gato he dejado de hacer cosas que disfrutaba haciendo antes de tenerlo. (It bothers me that my cat
                                                                                                                                                                                                     0.657
 stops me from doing things that I enjoyed before I owned it.)
 (10) Es molesto que algunas veces tengo que cambiar mis planes debido a mi gato. (It is annoying that I sometimes have to
                                                                                                                                                                                                     0.691
 change my plans because of my cat.)
 (11) Gasto mucho dinero en mi gato. (My cat costs too much money.)                                                                                                                                  0.414
 (14) ¿Con que frecuencia sientes que cuidar a tu gato es un trabajo difícil? (How often do you feel that looking after your cat
                                                                                                                                                                                                     0.561
 is a chore?)
 (16) ¿Con que frecuencia tu gato te limita de hacer cosas que tú quieres hacer? (How often does your cat stop you from doing
                                                                                                                                                                                                     0.606
 things that you want to do?)
 (19) ¿Con que frecuencia sientes que tener gato es más costo que beneficio? (How often do you feel that having a cat is more
                                                                                                                                                                                                     0.443
 trouble than it is worth?)
 Variance explained                                                                                                                           24.1%                              12.5%               7.9%
 Cronbach’s alpha                                                                                                                              0.86                               0.80               0.74
                                     Factorial loads higher than 0.40 are shown, and also those for items 12 and 13 in the subscale where they belong according to the CORS authors.
Animals 2022, 12, 1030                                                                                                  9 of 21

                                   Based on the above, we decided to retain the items in the subscales indicated by
                              Howell et al. [2] and estimate independent models for each subscale, thus obtaining
                              significant parameters and adequate statistical goodness of fit for each subscale: perceived
                              emotional closeness (X2 /df = 2.475; GFI = 0.913; AGFI = 0.857; CFI = 0.936; RMSEA = 0.084:
                              CI 0.063–0.105); cat-owner interaction (X2 /df = 2.841; GFI = 0.962; AGFI = 0.912; CFI = 0.949;
                              RMSEA = 0.094: CI 0.052–0.137); and perceived cost (X2 /df = 2.494; GFI = 0.943; AGFI = 0.897;
                              CFI = 0.897; RMSEA = 0.084: CI 0.058–0.111). Thus, for the following analyses, the subscales
                              were considered independently.

                              3.3. Cat Coat Color and Cat Owner Relationship
                                   The descriptive statistics are presented in Table 3 and individual distribution are
                              showed in Figure 2. A higher score indicates a stronger presence of the variable; that is,
                              a higher score reflects a higher perceived cost, greater emotional closeness and a better
                              interaction. For the sum of the CORS scores, the items for perceived cost were recoded. The
                              means are also shown because these data are usually reported in the MDORS. Based on
                              these data, the participants presented high levels of interaction and closeness with their
                              cats and perceived the cost of their relationships to be low.
                              Table 3. Descriptive statistics for the CORS.

                                           Mean                Median         Standard Deviation     K-S Normality Test
       Cat-owner interaction                27.7                 29.0                3.3
                                                                                                      Z = 0.244; p = 0.001
    Mean cat-owner interaction               4.6                  4.8                0.5
             White cat                       4.5                 4.8                 0.7
            Orange cat                      4.8                   4.8                0.2
              Gray cat                      4.5                  4.7                 0.6
              Black cat                     4.4                  4.8                 0.7
             Bicolor cat                    4.6                   4.8                0.5
            Tricolor cat                     4.7                  4.8                0.3
             Tabby cat                       4.7                  4.9                0.5
   Perceived emotional closeness            42.9                  43                 7.8
                                                                                                      Z = 0.089; p = 0.001
 Mean perceived emotional closeness          3.9                  3.9                0.7
             White cat                       4.0                 4.2                 0.7
            Orange cat                      4.1                   4.2                0.6
              Gray cat                      3.6                  3.6                 0.8
              Black cat                     3.7                   3.8                0.7
             Bicolor cat                    3.9                   3.9                0.6
            Tricolor cat                     3.8                  3.9                0.7
             Tabby cat                       3.9                  4.0                0.7
           Perceived cost                   16.6                 17.0                5.0
                                                                                                      Z = 0.111; p = 0.001
        Mean perceived cost                  1.8                  1.9                0.6
             White cat                       1.8                 1.9                 0.4
            Orange cat                      1.9                   1.7                0.6
              Gray cat                      2.0                  2.0                 0.6
              Black cat                     1.9                  1.9                 0.6
             Bicolor cat                    1.7                   1.7                0.5
            Tricolor cat                     1.7                  1.7                0.5
             Tabby cat                       1.8                  1.7                0.6
        Mean CORS scores                     4.1                  4.2                0.4              Z = 0.081; p = 0.002
             White cat                       4.2                 4.2                 0.4
            Orange cat                      4.2                   4.2                0.4
              Gray cat                      4.0                  4.0                 0.4
              Black cat                     4.0                  4.1                 0.4
             Bicolor cat                    4.2                   4.2                0.4
            Tricolor cat                     4.2                  4.1                0.4
             Tabby cat                       4.2                  4.3                0.5
                              K-S: Kolmogorov-Smirnov test.
Animals
Animals2022,
        2022,12,
             12,x1030
                  FOR PEER REVIEW                                                                                                       9 of
                                                                                                                                        10 of17
                                                                                                                                              21

                                                Catcolors
                                      Figure2.2.Cat
                                     Figure         colorsand
                                                           andCORS
                                                              CORSsubescales:
                                                                   subescales:individual
                                                                               individualdistribution.
                                                                                          distribution.

                                            Considering the groups based on coat color, the differences in the interaction (H = 5.593;
                                           Considering    the groups
                                      p = 0.470) and closeness    (H =based
                                                                        7.623; on
                                                                               p =coat  color,
                                                                                   0.267)       thewere
                                                                                           scores     differences
                                                                                                           analyzedin using
                                                                                                                       the interaction  (H =
                                                                                                                             Kruskal-Wallis
                                     5.593;  p = 0.470) orange
                                      test. Although    and closeness   (H = 7.623;
                                                                 cats scored  highestp =for
                                                                                          0.267)  scores were
                                                                                            interaction          analyzed using
                                                                                                           and closeness,          Kruskal-
                                                                                                                             the differences
                                     Wallis   test. Although   orange  cats scored  highest   for  interaction  and   closeness,
                                      among cats with different coat colors were not significant. Additionally, no significant   the  differ-
                                     ences   among   cats with  different coat  colors were   not   significant. Additionally,
                                      differences in perceived cost (H = 4.104; p = 0.663) were found when comparing the groups  no  signifi-
                                     cant
                                      baseddifferences  in perceived cost (H = 4.104; p = 0.663) were found when comparing the
                                              on coat color.
                                     groups based on coat color.
                                      3.4. Personality Traits and Cat Owner Relationship
                                     3.4. Personality  Traitsthe
                                            Table 4 shows     andcorrelations
                                                                  Cat Owner Relationship
                                                                                between the personality traits of cats, and between
                                           Table 4 traits
                                      personality    showsand thethe
                                                                  correlations   betweenThe
                                                                     CORS subscales.        thecat-owner
                                                                                                  personality  traits of cats,
                                                                                                            interaction        and was
                                                                                                                         subscale   between
                                                                                                                                         posi-
                                     personality   traitswith
                                      tively correlated    and the
                                                                the active
                                                                     CORSandsubscales.
                                                                                friendlyThe   cat-owner
                                                                                          traits           interaction
                                                                                                  and negatively        subscale
                                                                                                                  correlated   withwas  posi-
                                                                                                                                    aloofness.
                                     tively  correlated
                                      Emotional           withwas
                                                   closeness    the positively
                                                                     active andcorrelated
                                                                                 friendly traits
                                                                                             withand     negatively
                                                                                                    activeness,      correlated
                                                                                                                 boldness        with aloof-
                                                                                                                           and friendliness,
                                     ness.
                                      whichEmotional     closeness in
                                              were predominant       was
                                                                       thepositively  correlated
                                                                           cats (see Table          with activeness,
                                                                                             1). Perceived   cost was boldness
                                                                                                                       negativelyand  friend-
                                                                                                                                   correlated
                                      with bold
                                     liness,      cats.
                                              which     Nevertheless,
                                                      were   predominant  some   of these
                                                                             in the        correlations
                                                                                     cats (see  Table 1).were    weak cost
                                                                                                           Perceived   (r < 0.20). The other
                                                                                                                            was negatively
                                      predominant
                                     correlated  with trait,
                                                        bold calmness,   was not correlated
                                                               cats. Nevertheless,    some ofwiththesethe CORS.
                                                                                                        correlations  were weak (r < 0.20).
                                     The other predominant trait, calmness, was not correlated with the CORS.
                                      3.5. Other Variables
                                     Table Other
                                           4. Spearman  correlations
                                                  variables          betweenthe
                                                            could explain     CORS  subscalesinand
                                                                                differences        personality
                                                                                                personality    traits.
                                                                                                             traits among cats and the
                         1          2
                                     cat-owner
                                            3
                                               relationship,
                                                     4
                                                             the
                                                              5
                                                                 analyzes
                                                                       6
                                                                           presented
                                                                               7
                                                                                     below
                                                                                      8
                                                                                            were9
                                                                                                  performed
                                                                                                        10
                                                                                                            after
                                                                                                               11
                                                                                                                  the fact,
                                                                                                                        12
                                                                                                                            we
(1) Cat-owner                        included age and sex of the cats, and age and gender of the owner.
                         1
interaction
(2) Perceived                        3.5.1. Cat Age
                      0.576 **      1
emotional closeness                        Correlation between personality traits and cat age was analyzed. Negative relations
(3) Perceived cost      −0.026     −0.104      1
                                       were found   between age and active (rs = −0.249; p = 0.001), bold (rs = −0.146; p = 0.034)
(4) Active             0.225 **   0.166 *    −0.120       1
                                       and trainable (rs = −0.211; p = 0.002). And positive related with calm (rs = 0.167; p = 0.015).
(5) Aloof             −0.280 **    −0.133    0.117     −0.047        1
(6) Bold                 0.122    0.153Other  correlation
                                         * −0.197 ** 0.544with
                                                             **   age
                                                                   0.004were no 1 significant (p > 0.05). Thus, age of the cats could explain
(7) Calm                −0.084         some
                                   0.049     personality    traits,
                                             −0.096 −0.401 **       a structural
                                                                   0.054           equation
                                                                            -0.237 **     1 model was performed to analyzed it (Table 5)
(8) Friendly          0.184 **    0.146and
                                         * low   percentage
                                             −0.089    0.090 of     explained
                                                                 −0.498  **      variance
                                                                              0.069    0.144was
                                                                                             *   found
                                                                                                    1     for each personality trait; which is
(9) Intolerant         −0.176*     −0.074    0.094 with
                                       consistent      −0.026     0.400 **
                                                         the correlation      0.026    −0.109
                                                                             coefficients       −0.551 **
                                                                                           that were    mostly1 weak.
(10) Shy                 0.009     0.027     −0.002    −0.063     0.139 *   −0.169 * 0.205 ** −0.293 ** 0.214 **        1
(11) Stubborn            0.058     0.105     0.074     0.024      0.172 *     0.026    −0.057 −0.275 ** 0.384 **      0.106       1
(12) Tolerant          0.144 *     0.065     −0.083   0.179 ** −0.376 **      0.096    0.144 *   0.569 ** −0.568 ** −0.204 ** −0.182 **    1
(13) Trainable        0.313 **    0.199 **   −0.052   0.291 ** −0.345 ** 0.216 **      −0.044    0.369 ** −0.291 ** −0.071     −0.047   0.413 **
Animals 2022, 12, 1030                                                                                                                                                              11 of 21

                               Table 4. Spearman correlations between CORS subscales and personality traits.

                                            1                 2          3           4           5           6           7          8           9           10          11         12
 (1) Cat-owner interaction                 1
 (2) Perceived emotional closeness     0.576 **               1
 (3) Perceived cost                     −0.026             −0.104        1
 (4) Active                            0.225 **            0.166 *     −0.120        1
 (5) Aloof                             −0.280 **           −0.133      0.117       −0.047         1
 (6) Bold                                0.122             0.153 *    −0.197 **   0.544 **      0.004        1
 (7) Calm                               −0.084              0.049      −0.096     −0.401 **     0.054     −0.237 **      1
 (8) Friendly                          0.184 **            0.146 *     −0.089      0.090      −0.498 **    0.069      0.144 *       1
 (9) Intolerant                        −0.176*             −0.074      0.094       −0.026     0.400 **     0.026      −0.109     −0.551 **      1
 (10) Shy                                0.009              0.027      −0.002      −0.063      0.139 *    −0.169 *    0.205 **   −0.293 **   0.214 **       1
 (11) Stubborn                           0.058              0.105      0.074       0.024       0.172 *     0.026      −0.057     −0.275 **   0.384 **     0.106         1
 (12) Tolerant                          0.144 *             0.065      −0.083     0.179 **    −0.376 **    0.096      0.144 *    0.569 **    −0.568 **   −0.204 **   −0.182 **      1
 (13) Trainable                        0.313 **            0.199 **    −0.052     0.291 **    −0.345 **   0.216 **    −0.044     0.369 **    −0.291 **    −0.071      −0.047     0.413 **
                                * p < 0.05; ** p < 0.01.
were   found
                                    correlation
                                          Correlation
                                    trainable         =between
                                                     with    age     page
                                                                    were
                                                              between       and
                                                                            no    active
                                                                                    And (r
                                                                                 significant
                                                                             personality    s =(p
                                                                                            traits−0.249;
                                                                                                    > and  pcat
                                                                                                      0.05).  =performed
                                                                                                                0.001),
                                                                                                             Thus,
                                                                                                                 age age
                                                                                                                     was bold  (r(r  ==
                                                                                                                           ofanalyzed.
                                                                                                                              the    scats−0.146; pit=p
                                                                                                                                              could
                                                                                                                                               Negati   e(T
                                    3.5.1.
                                    were   Cat (r
                                    personality
                                           found
                                    correlation
                                    low          Age
                                         percentage  with−0.211;
                                                    s traits,
                                                       between
                                                             age
                                                            of      were= 0.002).
                                                                aexplained
                                                                   structural
                                                                      age   and
                                                                            no    active positive
                                                                                   equation
                                                                                         (r
                                                                                 significant
                                                                                  variance    =model
                                                                                            swas(p  >  related
                                                                                                  −0.249;was
                                                                                                           p
                                                                                                      0.05).
                                                                                                     found    =  with
                                                                                                                0.001),
                                                                                                             Thus,
                                                                                                             for     age
                                                                                                                  each  calm
                                                                                                                         bold
                                                                                                                           of to
                                                                                                                              the(r
                                                                                                                         personality   = 0.167;
                                                                                                                                  sanalyzed
                                                                                                                                     scats−0.146;
                                                                                                                                              could
                                                                                                                                               trait;  p  0
                                                                                                                                                        e(T
                                                                                                                                                        w
                                    were  Correlation
                                    trainable
                                    personality
                                           found
                                    correlation  (r   =
                                                    s traits,
                                                       between
                                                     with     between
                                                         −0.211;
                                                             agea    p  =
                                                                   structural
                                                                      age
                                                                    were     personality
                                                                          0.002).
                                                                            and
                                                                            no      And
                                                                                  active (r
                                                                                 significanttraits
                                                                                         positive
                                                                                   equation    model
                                                                                              =model  and
                                                                                                (p−0.249;
                                                                                                    >found  cat
                                                                                                       related
                                                                                                         was
                                                                                                           pcat
                                                                                                      0.05).     age
                                                                                                                 withwascalm
                                                                                                                performed
                                                                                                              =performed
                                                                                                                0.001),
                                                                                                             Thus,   age    analyzed.
                                                                                                                         bold  (r
                                                                                                                              to     =   0.167;
                                                                                                                                  sanalyzed
                                                                                                                                 (rsanalyzed
                                                                                                                           ofanalyzed.
                                                                                                                              the      =0.167;
                                                                                                                                     scats
                                                                                                                                               Negati
                                                                                                                                          −0.146; p
                                                                                                                                              could it=pw 0
                                                                                                                                                        e(T
                                    low  percentage
                                          Correlation
                                    trainable
                                    personality
                                    sistent  with(r   =     of
                                                         −0.211;
                                                    s traits,
                                                       the      aexplained
                                                              betweenp  = 0.002).
                                                                   structural
                                                            correlation           variance
                                                                             personality
                                                                                    And     swas
                                                                                            traits
                                                                                         positive
                                                                                   equation
                                                                               coefficients    that   and    for
                                                                                                       related
                                                                                                         was
                                                                                                      were        each
                                                                                                                 age
                                                                                                                 with
                                                                                                             mostly  was personality
                                                                                                                        calm
                                                                                                                       weak.   (r
                                                                                                                              to     =         trait;
                                                                                                                                               Negati
                                                                                                                                                  p it=   0
                                    were   found
                                    correlation
                                    low  percentage
                                    trainable
                                    personality  (r   =between
                                                     with    age
                                                            of
                                                         −0.211;
                                                    s traits,   a     age
                                                                    were
                                                                 explained
                                                                     p  =   and
                                                                          0.002).
                                                                   structural     active (r
                                                                            nocoefficients
                                                                                 significant
                                                                                  variance
                                                                                    And       =model
                                                                                            swas(p−0.249;
                                                                                         positive
                                                                                   equation         >found p Thus,
                                                                                                      0.05).  =performed
                                                                                                             for
                                                                                                       related
                                                                                                         was    0.001),
                                                                                                                     age
                                                                                                                  each
                                                                                                                 with    bold
                                                                                                                           of the(rsanalyzed
                                                                                                                         personality
                                                                                                                        calm   (r
                                                                                                                              to     = =0.167;
                                                                                                                                     scats−0.146;
                                                                                                                                              could
                                                                                                                                               trait;
                                                                                                                                                  p it=pw
                                                                                                                                                        e(T
                                                                                                                                                          0
                                    sistent
                                    were
                                    low      with
                                           found
                                    correlation
                                         percentage
                                          Age          the
                                                 ofswith
                                                      the   correlation
                                                       between
                                                             age
                                                            of
                                                            cats      age
                                                                    were
                                                                 explained
                                                                    was     and   active (r
                                                                            nocoefficients
                                                                                 significant
                                                                                  variance
                                                                          equivalent           that
                                                                                              =model
                                                                                            swas
                                                                                         among        were
                                                                                                (p−0.249;
                                                                                                    >found
                                                                                                      0.05).
                                                                                                     the  catmostly
                                                                                                           p Thus,
                                                                                                              =color
                                                                                                             for0.001),weak.
                                                                                                                     age
                                                                                                                  each   bold
                                                                                                                           of the(rsanalyzed
                                                                                                                         personality
                                                                                                                     groups      (H    ==0.167;
                                                                                                                                     scats−0.146;
                                                                                                                                              could p=pw
                                                                                                                                               trait;
                                                                                                                                           2.920;       e(T
                                                                                                                                                         =0
                                    trainable
                                    personality
                                    sistent  with
                                    correlation  (r   =  −0.211;
                                                      traits,
                                                       the      a    p  = 0.002).
                                                                   structural
                                                            correlation             And  positive
                                                                                   equation    that    related
                                                                                                         was
                                                                                                      were       with   calm
                                                                                                                performed
                                                                                                             mostly    weak.   (r
                                                                                                                              to     =            p it
    Animals 2022, 12, 1030          low   Age
                                    trainable
                                    personality
                                    sistent
                                    age  doeswithofswith
                                         percentage
                                                 (r
                                                not   the
                                                      =the   age
                                                            of
                                                            cats
                                                         −0.211;
                                                      traits,       were
                                                                aexplained
                                                                    was     nocoefficients
                                                                     presults
                                                            correlation
                                                        explain         = 0.002).
                                                                   structural    significant
                                                                                  variance
                                                                          equivalent
                                                                                 showed   inwas
                                                                                    Andamong    (p >found
                                                                                         positive
                                                                                   equation    model
                                                                                               that
                                                                                               Table
                                                                                                      0.05).
                                                                                                     the     Thus,
                                                                                                             for
                                                                                                       related
                                                                                                        1.was
                                                                                                      were       withage
                                                                                                                  each
                                                                                                          catmostly
                                                                                                               color       of the
                                                                                                                         personality
                                                                                                                     groups
                                                                                                                        calm
                                                                                                                performed
                                                                                                                       weak.   (r(H
                                                                                                                              to     =cats
                                                                                                                                  sanalyzed
                                                                                                                                      12
                                                                                                                                              could
                                                                                                                                             21trait;
                                                                                                                                        =0.167;
                                                                                                                                           2.920;
                                                                                                                                          of      pitp=we(T
                                                                                                                                                         =0
                                    correlation
                                    low  percentage
                                          Age
                                    personality  of  with
                                                      the    age
                                                            of
                                                            cats
                                                      traits,       were
                                                                 explained
                                                                    was
                                                                aexplained  no   significant
                                                                                  variance
                                                                          equivalent
                                                                   structural                was
                                                                                         among
                                                                                   equation     (p
                                                                                               model> 0.05).
                                                                                                     found
                                                                                                     the  catThus,
                                                                                                             for
                                                                                                               color age
                                                                                                                  each     of the
                                                                                                                         personality
                                                                                                                     groups      (H   cats
                                                                                                                                        =     could
                                                                                                                                               trait;
                                                                                                                                           2.920;   p   e
                                                                                                                                                        w=
                                    sistent
                                    age does
                                    low      with
                                    correlation not
                                         percentage
                                          Age    of    the
                                                      the   correlation
                                                        explain
                                                     with    age
                                                            of
                                                            cats      results
                                                                    were
                                                                    was     no coefficients
                                                                                 showed
                                                                                  variance
                                                                          equivalent      inwas
                                                                                 significant
                                                                                         among that
                                                                                               Table
                                                                                                (p  >   1.was
                                                                                                      were
                                                                                                      0.05).
                                                                                                     found
                                                                                                     the  cat   performed
                                                                                                             mostly
                                                                                                             Thus,
                                                                                                             for
                                                                                                               color   weak.
                                                                                                                     age
                                                                                                                  each     of to(H
                                                                                                                              the
                                                                                                                         personality
                                                                                                                     groups         analyzed
                                                                                                                                      cats
                                                                                                                                        =     could itp w
                                                                                                                                               trait;
                                                                                                                                           2.920;       e(T
                                                                                                                                                         =
                                    personality
                                    sistent
                                    age does
                                    low      with
                                                not
                                         percentage
                                          Age    of   traits,
                                                       the
                                                      the   of
                                                            catsaexplained
                                                                   structural
                                                            correlation
                                                        explain       results
                                                                    was            equation
                                                                               coefficients
                                                                                 showed
                                                                                  variance
                                                                          equivalent      inwas
                                                                                         among model
                                                                                               that
                                                                                               Table    1.was
                                                                                                      were
                                                                                                     found
                                                                                                     the  catforperformed
                                                                                                             mostly
                                                                                                                  each
                                                                                                               color   weak.  to(H
                                                                                                                         personality
                                                                                                                     groups         analyzed
                                                                                                                                        =           itp w
                                                                                                                                               trait;
                                                                                                                                           2.920;        (T
                                                                                                                                                         =
                                    Table
                                    sistent
                                    age
                                      Table5. Personality
                                    personality
                                            5.with
                                         does   not   traits,
                                                       the      atraits
                                                            correlation
                                                        explain
                                               Personality   traits      and
                                                                   structural
                                                                      results
                                                                    and cat    cat  age. in that
                                                                                   equation
                                                                               coefficients
                                                                            age. showed        model
                                                                                               Table    1.was
                                                                                                      were      performed
                                                                                                             mostly    weak.  to(H  analyzed        itp w(T
                                    low
                                    Tablepercentage
                                          Age
                                    sistent
                                    age    5.with
                                         does    of   the
                                              Personality
                                                not    the  of
                                                            cats explained
                                                                    was
                                                                 traits
                                                            correlation
                                                        explain                   variance
                                                                          equivalent
                                                                         and coefficients
                                                                      results  cat           was
                                                                                         among
                                                                                    age. in that
                                                                                 showed        Table found
                                                                                                     the
                                                                                                      werecatfor  each
                                                                                                               color
                                                                                                        1.catmostly      personality
                                                                                                                     groups
                                                                                                                       weak.            =      trait;
                                                                                                                                           2.920;        =
                                    low
                                    Tablepercentage
                                          Age
                                    sistent
                                    age    5.with
                                         does    of   the
                                              Personality
                                                not    the  of
                                                            cats explained
                                                                    was
                                                                 traits
                                                            correlation
                                                        explain                   variance
                                                                          equivalent
                                                                         and coefficients
                                                                      results  cat           was
                                                                                         among
                                                                                    age. in that
                                                                                 showed        Table found
                                                                                                     the
                                                                                                      were   for  each
                                                                                                               color
                                                                                                        1.catmostly      personality
                                                                                                                     groups
                                                                                                                       weak.     (H     =      trait;
                                                                                                                                           2.920;   p   w=
                                          Age    of   the   cats    was        S
                                                                          equivalent     among S   p the       color      p Variance
                                                                                                                  Explained
                                                                                                                     groups      (H     =       Explain
                                                                                                                                           2.920;   p    =
                                    Table
                                    sistent5.
                                    age does  Personality
                                             with
                                                not    the
                                                        explain  traits
                                                            correlation  and
                                                                      results  cat  age.
                                                                               coefficients
                                                                                 showedamong
                                                                                          in   that
                                                                                               Table
                                                                                               S      were
                                                                                                        1.catmostly    weak.
                                                                                                                          p                     Explain
  Active Active                     
                                    Table
                                    age   Age
                                         does    of
                                                not   the
                                                     Cat
                                           5. Personality   cats
                                                          age
                                                        explainCat  was
                                                                    age
                                                                 traits   equivalent
                                                                            −
                                                                      results 0.287
                                                                         and cat           −0.287
                                                                                    age. in S
                                                                                 showed              the
                                                                                                 0.001
                                                                                               Table           color groups
                                                                                                                        0.001
                                                                                                                         8.2%
                                                                                                        1.cat color groupsp
                                                                                                                                 (H     =  2.920;   p
                                                                                                                                                Explain
                                                                                                                                                         =
  Active
  Aloof
          Aloof                     
                                    Table
                                    age
                                    
                                          Age    of   the
                                                     Cat
                                           5. Personality
                                         does               cats
                                                          age
                                                notCatexplain  Cat  was
                                                                    age
                                                                 traits
                                                               Cat  age
                                                                          equivalent
                                                                            − 0.047
                                                                         and cat
                                                                      results            among
                                                                                    age. in
                                                                                 showed    −0.287    the
                                                                                                 0.494
                                                                                               Table
                                                                                           −0.047
                                                                                               S        1.              0.001
                                                                                                                         0.2%
                                                                                                                        0.494
                                                                                                                          p
                                                                                                                                 (H     =  2.920;   p
                                                                                                                                                Explain
                                                                                                                                                         =
  Active   Bold                     
                                    Table  5. Personality
                                    age does notCatexplain
                                                         age Cat   age
                                                                 traits  and−0.217
                                                                      results  cat  age.
                                                                                 showed in −0.2870.001
                                                                                               Table    1.              0.001
                                                                                                                         4.7%
  Aloof
   Bold Calm                                                  Cat age                     −0.047
                                                                                               S                        0.494
                                                                                                                          p                     Explain
  Active                                                  age Cat age
                                    Table 5. PersonalityCat      traits      0.133         −0.217
                                                                                           −0.2870.051                  0.001
                                                                                                                         1.8%
  Aloof
   Bold Friendly
                                   
                                                                    age and cat age.               −0.047
                                                                                                       S                            0.494
                                                                                                                                      p                    Explain
  Active                                             Cat age Cat
                                    Table 5. Personality             age
                                                                 traits    and     cat age. −0.217
                                                                               −0.126               −0.287
                                                                                                         0.065                      0.001
                                                                                                                                     1.6%
  Calm
  Aloof                                                       Cat    age                             0.133
                                                                                                    −0.047
                                                                                                       S                            0.051
                                                                                                                                    0.494
                                                                                                                                      p                    Explain
   Bold Intolerant
  Active                           
                                                     Cat age Cat
                                    Table 5. Personality             age and0.104
                                                                 traits            cat age. −0.217  −0.287
                                                                                                         0.128                      0.001
                                                                                                                                     1.1%
  Calm
  Aloof
 Friendly                                                    Cat
                                                              Cat    age
                                                                     age                             0.133
                                                                                                    −0.047
                                                                                                       S
                                                                                                    −0.126                          0.051
                                                                                                                                    0.494
                                                                                                                                      p
                                                                                                                                    0.065                  Explain
   Bold
  Active
  Calm     Shy                                       Cat age
                                                              Cat    age       −0.015               −0.217
                                                                                                    −0.287
                                                                                                         0.826
                                                                                                     0.133                          0.001
                                                                                                                                     0.0%
                                                                                                                                    0.051
  Aloof
 Friendly
   Bold Stubborn                                             Cat ageage                            −0.047
                                                                                                       S
                                                                                                    −0.126
                                                                                                    −0.217                          0.494
                                                                                                                                      p
                                                                                                                                    0.065
                                                                                                                                    0.001                  Explain
  Active
Intolerant
  Calm
  Aloof                                              Cat age Cat               0.067               −0.287
                                                                                                         0.128
                                                                                                     0.104
                                                                                                     0.133
                                                                                                    −0.047
                                                                                                                                     1.1%
                                                                                                                                    0.128
                                                                                                                                    0.051
                                                                                                                                    0.494
 Friendly
   Bold Tolerant                                             Cat ageage −0.106                        S
                                                                                                    −0.126
                                                                                                    −0.217                            p
                                                                                                                                    0.065
                                                                                                                                    0.001                  Explain
  Active
Intolerant
  Calm
  Aloof                                              Cat age Cat                                   −0.287
                                                                                                         0.122
                                                                                                     0.104
                                                                                                     0.133
                                                                                                    −0.047
                                                                                                                                     1.1%
                                                                                                                                    0.128
                                                                                                                                    0.051
                                                                                                                                    0.494
   Shy
 Friendly
   Bold Trainable
  Active                           
                                                             Cat
                                                              Cat age
                                                      Cat age Cat    age
                                                                     age −0.268                     −0.015
                                                                                                    −0.126
                                                                                                    −0.217
                                                                                                    −0.287
                                                                                                         0.001                      0.826
                                                                                                                                    0.065
                                                                                                                                    0.001
                                                                                                                                     7.2%
Intolerant
  Calm
  Aloof                            
                                                                                                    0.104
                                                                                                     0.133
                                                                                                    −0.047                          0.128
                                                                                                                                    0.051
                                                                                                                                    0.494
   Shy
 Friendly
   Bold
Stubborn                                                     Cat age
                                                              Cat    age                            −0.015
                                                                                                    −0.126
                                                                                                    −0.217
                                                                                                     0.067                          0.826
                                                                                                                                    0.065
                                                                                                                                    0.001
                                                                                                                                    0.128
Intolerant
  Calm
  Aloof
   Shy
 Friendly                          
                                      S = Standardized estimates;
                                                              Cat  p
                                                              Cat ageage
                                                                     = Statistical significance.     0.104
                                                                                                     0.133
                                                                                                    −0.047
                                                                                                    −0.015
                                                                                                    −0.126                          0.051
                                                                                                                                    0.494
                                                                                                                                    0.826
                                                                                                                                    0.065
   Bold
Stubborn
Intolerant
  Calm                                                       Cat    age                            −0.217
                                                                                                     0.067
                                                                                                     0.104
                                                                                                     0.133                          0.001
                                                                                                                                    0.128
                                                                                                                                    0.051
 Tolerant
   Shy
 Friendly
   Bold                            
                                                             Cat
                                                              Cat    age
                                                                      equivalent among the−0.126
                                                                     age                            −0.106
                                                                                                    −0.015
                                                                                                    −0.217                          0.122
                                                                                                                                    0.826
                                                                                                                                    0.065
                                                                                                                                    0.001
Stubborn
Intolerant
  Calm                             
                                   
                                             Age of the catsCatwasage                                cat color groups (H = 2.920;
                                                                                                     0.067
                                                                                                     0.104
                                                                                                     0.133                             p = 0.819), thus
                                                                                                                                    0.128
                                                                                                                                    0.051
 Tolerant
   Shy                                                        Cat age                               −0.106
                                                                                                    −0.015                          0.122
                                                                                                                                    0.826
 Friendly
Trainable
Stubborn
Intolerant
  Calm
 Tolerant                         ⇦age does not explainCat
                                                             Cat    age
                                                                results
                                                                     age showed in Table 1.−0.106
                                                                                                    −0.126
                                                                                                    −0.268
                                                                                                     0.067
                                                                                                     0.104
                                                                                                     0.133
                                                                                                                                    0.065
                                                                                                                                    0.001
                                                                                                                                    0.128
                                                                                                                                    0.051
                                                                                                                                    0.122
   Shy
 Friendly                          ⇦                                                               −0.015
                                                                                                    −0.126                          0.826
                                                                                                                                    0.065
Trainable
Stubborn
Intolerant
 Tolerant                                  The  correlationsCatbetween
                                                              Cat    age
                                                                     age        age   and    the    −0.268
                                                                                                     0.067
                                                                                                     0.104
                                                                                                  CORS
                                                                                                    −0.106 subscales  were          0.001
                                                                                                                                    0.128 Emotional
                                                                                                                             analyzed.
                                                                                                                                    0.122
   Shy
 Friendly
Trainable
Stubborn
Intolerant                         
                                  S⇦= Standardized estimates;
                                                              Cat ageage      p = Statistical −0.015significance.
                                                                                                    −0.126
                                                                                                    −0.268
                                                                                                     0.067
                                                                                                     0.104
                                                                                                                                    0.826
                                                                                                                                    0.065
                                                                                                                                    0.001
                                                                                                                                    0.128
 Tolerant
   Shy                              S =closeness  was positively
                                         Standardized         Cat    and weak
                                                             estimates;       p =   correlated with
                                                                                    Statistical          age (rs = 0.170; p = 0.014).
                                                                                                    −0.106
                                                                                                    significance.
                                                                                                    −0.015                              The cat-owner
                                                                                                                                    0.122
                                                                                                                                    0.826
Trainable
Stubborn
Intolerant
 Tolerant
   Shy
                                  
                                   S⇦=  Standardized
                                       interaction  subscale
                                                              Cat
                                                              Cat    age
                                                                      −0.014;
                                                               (rs =age
                                                             estimates;       p =
                                                                                                    −0.268
                                                                                                     0.067
                                                                                                     0.104
                                                                                                     perceived cost (rs = −0.115;
                                                                                    = 0.843) and−0.106
                                                                                  p Statistical     significance.
                                                                                                    −0.015
                                                                                                                                    0.001
                                                                                                                                    0.128
                                                                                                                                    0.122
                                                                                                                                       p = 0.097) were
                                                                                                                                    0.826
Trainable
Stubborn                           ⇦
                                                            Cat ageage                            −0.268
                                                                                                     0.067                          0.001
                                                                                                                                    0.128
 Tolerant
   Shy
Trainable
Stubborn                          
                                            The correlations
                                    S⇦=noStandardized
                                           significantly      Cat
                                                             estimates;
                                                          related
                                                              Cat    with
                                                                     age
                                                                         between
                                                                           catp =age.     age and
                                                                                    Statistical     −0.106
                                                                                                    −0.015
                                                                                                    −0.268
                                                                                                     0.067
                                                                                                          the CORS subscales
                                                                                                    significance.                   0.122
                                                                                                                                    0.826
                                                                                                                                    0.001
                                                                                                                                    0.128
                                                                                                                                           were analyzed
 Tolerant                          S =     The    correlations
                                         Standardized         Cat agebetween
                                                             estimates;       p =         age
                                                                                    Statistical  and−0.106the   CORS
                                                                                                    significance.         subscales 0.122  were       analyzed
Trainable
Stubborn
 Tolerant
                                   
                                  
                                    S⇦= Standardized
                                    closeness
                                            The    was positively
                                                              Cat age
                                                   correlations
                                                              Cat    age and weak correlated
                                                             estimates;  between
                                                                              p =         age
                                                                                    Statistical  and−0.268
                                                                                                     0.067
                                                                                                    −0.106the   with age
                                                                                                                CORS
                                                                                                    significance.
                                                                                                                              (rs =0.122
                                                                                                                          subscales  0.170;
                                                                                                                                    0.001
                                                                                                                                    0.128
                                                                                                                                           were p = 0.014).
                                                                                                                                                      analyzed Th
Trainable
 Tolerant                          ⇦ 3.5.2.
                                    closeness Cat
                                            The
                                    interaction
                                                   Sex
                                                   was
                                    S⇦= Standardized
                                                          positively
                                                      subscaleCat
                                                   correlations
                                                              Cat age
                                                                     age
                                                             estimates;
                                                                            and
                                                                        sbetween
                                                                          = and
                                                                     (rmale  −0.014;
                                                                              pand
                                                                                     weak age
                                                                                = Statistical
                                                                                               correlated
                                                                                                 and
                                                                                           p =cats  −0.268
                                                                                                 0.843)
                                                                                                    −0.106the
                                                                                                            and with
                                                                                                                CORS
                                                                                                    significance.
                                                                                                                        age   (r s =0.001
                                                                                                                          subscales
                                                                                                                   perceived         0.170;
                                                                                                                                    cost   were
                                                                                                                                    0.122 (r    p  =  0.014).
                                                                                                                                                      analyzed
                                                                                                                                              s = −0.115;     pTh
                                                                                                                                                                =
Trainable                          closeness      was
                                             Differences
                                            The           positively
                                                              Cat age
                                                           between
                                                   correlations          between     weak
                                                                                     female
                                                                                          age  correlated
                                                                                                 and−0.268
                                                                                                     regarding
                                                                                                          the   with    age
                                                                                                                 personality
                                                                                                                CORS          (r s =0.001
                                                                                                                               traits
                                                                                                                          subscales  0.170;
                                                                                                                                       were     p  =
                                                                                                                                             analyzed,
                                                                                                                                           were       0.014).
                                                                                                                                                      analyzed Th
                                    interaction
                                    S =  Standardized
                                     ⇦=significant
                                    closeness
                                    no
      Animals 2022, 12, x FOR PEERREVIEW
Trainable                                          was
                                         significantlysubscale
                                                          positively
                                                             related
                                                              Catwere(r
                                                             estimates; s =  −0.014;
                                                                              p
                                                                            and
                                                                     age with   =    weak
                                                                                     cat   p  =
                                                                                    Statistical
                                                                                           age.  0.843)
                                                                                               correlated
                                                                                                    −0.268  and
                                                                                                    significance.  perceived
                                                                                                                with    age   (rand cost
                                                                                                                                 s =0.001
                                                                                                                                     0.170;(r s =   −0.115;
                                                                                                                                                p =of−0.115;
                                                                                                                                                11    0.014).
                                                                                                                                                      17      p =
                                                                                                                                                               Th
                                    S       The
                                    interaction     differences
                                                   correlations
                                         Standardized subscale       (r
                                                             estimates;   =found
                                                                        sbetween
                                                                             −0.014;
                                                                              p =    in aloof,
                                                                                          age
                                                                                           p  =
                                                                                    Statistical  bold,
                                                                                                 and
                                                                                                 0.843) friendly,
                                                                                                          the
                                                                                                            and
                                                                                                    significance.  intolerant
                                                                                                                CORS      subscales
                                                                                                                   perceived         trainable.
                                                                                                                                    cost   (r s = Thus,
                                                                                                                                           were       analyzedp =
                                    closeness
                                    no
                                    S =sex  The    was
                                         significantly
                                         Standardized
                                                          positively
                                                       could related
                                            of the correlations
                                    interaction    catsubscale       (r
                                                               explain
                                                             estimates;   = and
                                                                           with
                                                                        sbetween
                                                                             −0.014; weak
                                                                                     cat
                                                                           personality
                                                                              p =          age.
                                                                                          age
                                                                                           p  =correlated
                                                                                                 and
                                                                                                 0.843)
                                                                                            traits.
                                                                                    Statistical           the
                                                                                                     Figure and with
                                                                                                                CORS    age
                                                                                                                   perceived
                                                                                                             3 shows
                                                                                                    significance.
                                                                                                                              (rs =cost
                                                                                                                          subscales
                                                                                                                       individual    0.170;were
                                                                                                                                           (r   p = 0.014).
                                                                                                                                                      analyzed
                                                                                                                                              s = −0.115;
                                                                                                                                      distributions     of    pTh
                                                                                                                                                                =
                                    closeness
                                    no      The    was
                                         significantly    positively
                                                             related
                                            scores.correlations
                                    interaction
                                       the            subscale              and
                                                                          =with
                                                                     (rsbetween
                                                                             −0.014; weak
                                                                                     cat   p =correlated
                                                                                           age.
                                                                                          age    and the
                                                                                                 0.843)     and with
                                                                                                                CORS    age   (rs =cost
                                                                                                                          subscales
                                                                                                                   perceived         0.170;were
                                                                                                                                           (r   p = 0.014).
                                                                                                                                                      analyzed
                                                                                                                                              s = −0.115;     pTh
                                                                                                                                                                =
                                     3.5.2.
                                     no     Cat correlations
                                     closeness
                                           The
                                     interaction Sex
                                                 was
                                         significantlypositively
                                                         related
                                                   subscale         and
                                                                  =with
                                                              (rsbetweenweak
                                                                        cat
                                                                    −0.014; p =correlated
                                                                            age.
                                                                           age  and the
                                                                                0.843) andwith
                                                                                          CORS   age (rs =cost
                                                                                                  subscales
                                                                                            perceived       0.170;
                                                                                                                were
                                                                                                                (r   p = 0.014).pTh
                                                                                                                         analyzed
                                                                                                                   s = −0.115;     =
                                     3.5.2.
                                     no     Cat
                                     closeness
                                     interaction Sex
                                                 was
                                         significantly
                                           The        positively
                                                         related
                                                 correlations
                                                   subscale   (r  = and
                                                                   with
                                                                sbetween
                                                                        weak
                                                                        cat
                                                                    −0.014;age
                                                                            p =correlated
                                                                            age.and  the
                                                                                0.843) andwith
                                                                                          CORS   age (r s = 0.170; p = 0.014). Th
                                                                                                  subscales
                                                                                            perceived     cost  were
                                                                                                                (r       analyzed
                                                                                                                   s = −0.115;  p  =
                                     3.5.2.
                                     no    Differences
                                            Cat Sex
                                     closeness   was
                                         significantly    between
                                                      positively
                                                         related      male
                                                                    and cat
                                                                   with weakand  female
                                                                               correlated
                                                                            age.          cats
                                                                                          with  regarding
                                                                                                 age (rs =cost personality
                                                                                                            0.170;            trait
                                                                                                                     p = 0.014).pTh
                                     interaction
                                     3.5.2.
                                     no     Cat
                                     closeness     subscale
                                           Differences
                                                 Sex
                                                 was
                                         significantly        (r
                                                      positively
                                                         relateds = −0.014;
                                                          between     male
                                                                    and
                                                                   with weak
                                                                        cat p =
                                                                            and 0.843)
                                                                                 femaleand
                                                                               correlated
                                                                            age.            perceived
                                                                                          cats
                                                                                          with  regarding       (r s = −0.115;
                                                                                                               personality
                                                                                                 age (rfriendly,              trait
                                                                                                        s = 0.170; p = 0.014). Th
                                                                                                                                   =
                                     lyzed,  significant
                                     interaction   subscale
                                           Differences     differences
                                                              (r
                                                          between
                                                                s =     were
                                                                    −0.014;
                                                                      male  p =
                                                                            andfound
                                                                                0.843)in
                                                                                 female  aloof,
                                                                                       and      bold,
                                                                                            perceived
                                                                                          cats regarding  cost  (r   intolerant
                                                                                                                     = −0.115;
                                                                                                               personality
                                                                                                                   s            p an
                                                                                                                              trait=
                                     3.5.2.
                                     no
                                     lyzed, Cat
                                     interaction Sex
                                         significantly
                                             significant related
                                                   subscale   (r  =with
                                                           differences  cat
                                                                        were
                                                                    −0.014; age.
                                                                            p =found
                                                                                0.843)in aloof,
                                                                                       and      bold,
                                                                                            perceived  friendly,
                                                                                                          cost  (r   intolerant
                                                                                                                     = −0.115;  p an
                                                                                                                                   =
                                     Thus,
                                     3.5.2.
                                     no
                                     lyzed,Differences
                                             sex
                                            Cat  Sex
                                         significantly
                                             significant  between
                                                  of the related
                                                          cat   s
                                                              could   male
                                                                   with
                                                           differences  cat
                                                                        wereand
                                                                      explain
                                                                            age. female
                                                                               personality
                                                                               found  in  cats
                                                                                         aloof, regarding
                                                                                            traits. Figure
                                                                                                bold,         3personality
                                                                                                       friendly,
                                                                                                                   s
                                                                                                                shows         trait
                                                                                                                          individu
                                                                                                                     intolerant   an
                                     Thus,
                                     3.5.2.
                                     no
                                     lyzed,
                                     tions Differences
                                             sex
                                            Cat
                                            of   Sex
                                         significantly
                                             significant
                                               the        between
                                                  ofscores.
                                                     the related
                                                          cat could   male
                                                                   with
                                                           differences  cat
                                                                        wereand
                                                                      explain
                                                                            age. female
                                                                               personality
                                                                               found      cats
                                                                                      in aloof, regarding
                                                                                            traits. Figure
                                                                                                bold,          personality
                                                                                                              3 shows
                                                                                                       friendly,              trait
                                                                                                                          individu
                                                                                                                     intolerant   an
                                     Thus,
                                     3.5.2.
                                     lyzed,
                                     tions Differences
                                             sex
                                            Cat
                                            of    of
                                                 Sex the
                                             significant
                                               the        between
                                                          cat
                                                    scores.   could
                                                           differencesmale
                                                                        wereand
                                                                      explain    female
                                                                               personality
                                                                               found  in  cats
                                                                                         aloof, regarding
                                                                                            traits. Figure
                                                                                                bold,         3personality
                                                                                                       friendly,shows         trait
                                                                                                                          individu
                                                                                                                     intolerant   an
                                     Thus,
                                     3.5.2.
                                     lyzed,
                                     tions Differences
                                             sex
                                            Cat
                                            of   Sex
                                             significant
                                               the        between
                                                  ofscores.
                                                     the cat  could male
                                                           differences  wereand
                                                                      explain    female
                                                                               personality
                                                                               found  in  cats
                                                                                         aloof, regarding
                                                                                            traits. Figure
                                                                                                bold,         3personality
                                                                                                       friendly,shows         trait
                                                                                                                          individu
                                                                                                                     intolerant   an
                                     Thus,
                                     lyzed,
                                     tions Differences
                                             sex
                                             significant
                                            of the        between
                                                  ofscores.
                                                     the cat  could male
                                                           differences  wereand
                                                                      explain    female
                                                                               personality
                                                                               found  in  cats
                                                                                         aloof, regarding
                                                                                            traits. Figure
                                                                                                bold,         3personality
                                                                                                       friendly,shows         trait
                                                                                                                          individu
                                                                                                                     intolerant   an
                                     Thus,
                                     lyzed,
                                     tions   sex
                                            of theofscores.
                                                     the cat
                                             significant      could explain
                                                           differences  were   personality
                                                                               found  in    traits.
                                                                                         aloof,     Figure
                                                                                                bold,         3 shows
                                                                                                       friendly,          individu
                                                                                                                     intolerant   an
                                     Thus,
                                     tions   sex
                                            of theofscores.
                                                     the cat could explain personality traits. Figure 3 shows individu
                                     Thus,
                                     tions ofsex
                                               theofscores.
                                                     the cat could explain personality traits. Figure 3 shows individu
                                     tions of the scores.

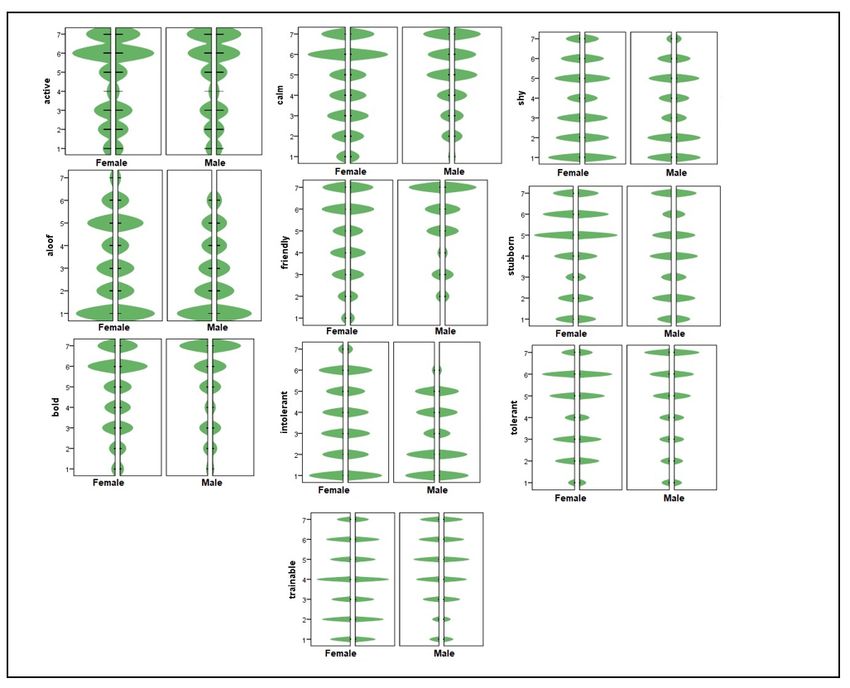
                                          Figure3.3.Personality
                                         Figure      Personalitytraits
                                                                 traits and
                                                                        and cat
                                                                            cat sex: individual
                                                                                     individual distribution.
                                                                                                distribution.

                                               Although the distribution of cats according to sex is equivalent in the complete sam-
                                          ple (57.0% female, 43.0% male), in the groups by cat color there is a predominance of males
                                          in orange cats and females in gray, tricolor and tabby. In addition, color and sex are sig-
                                          nificantly associated (X2 = 22.791; p = 0.001).
Animals 2022, 12, 1030                                                                                          13 of 21

                              Although the distribution of cats according to sex is equivalent in the complete sample
                         (57.0% female, 43.0% male), in the groups by cat color there is a predominance of males
                         in orange cats and females in gray, tricolor and tabby. In addition, color and sex are
                         significantly associated (X2 = 22.791; p = 0.001).
                              We analyze differences in personality traits separating male and female cats, no
                         significant differences among color cat groups (p > 0.05) were found. Analyzing the
                         differences in personality between males and females, separating by colors, significant
                         differences were only found in white cats in these personality traits: aloof, bold, friendly,
                         intolerant, stubborn and tolerant (p < 0.05) (Table 6).
                              Higher score for male cats were found in emotional closeness (Z = 2.288; p = 0.022).
                         No significant differences were found between male and female cats when the cat-owner
                         interaction subscale (Z = −1.625; p = 0.104) and perceived cost (Z = −0.278; p = 0.781)
                         were analyzed.

                         3.5.3. Owner Age
                              Personality traits is not an objective variable, it reflects owners’ perception, therefor
                         some owner variables, such as age and gender, could explain it. Correlation between
                         personality traits and owner age were no significant (p > 0.05). Separating cats according its
                         color and comparing owner age among groups we found age of the owner was equivalent
                         among the groups (H = 8.451; p = 0.207). These results suggest owners’ age is not a variable
                         that could explain their perception of personality traits. Nevertheless, a structural equation
                         model was performed to analyzed it. All regression weights for owner age in the prediction
                         of each personality trait were not significant (p > 0.05).
                              The correlations between owner age and the CORS subscales were analyzed. Emo-
                         tional closeness (rs = 0.200; p = 0.004) and perceived cost (rs = −0.165; p = 0.017) were
                         significantly correlated with owner age. The cat-owner interaction subscale (rs = 0.090;
                         p = 0.195) was no significantly related with owner age.

                         3.5.4. Owner Gender
                              Most of participants were female (n = 171, 81.0%). We found equivalence in scores of
                         each personality trait between perception of male and female owners (p > 0.05).
                              When analyzing the differences in the perception of personality traits, separating men
                         and women, the perception of men indicates significant differences exclusively in stubborn
                         personality when comparing cats according to their color (p < 0.05). Tricolor cats had highest
                         score in complete sample, men and women groups (Table 7). Color with the highest score in
                         each personality trait does not change when men are excluded from analysis; nevertheless,
                         considering only men, color with the highest score in each personality trait varies.
                              Significant differences between men and women were found comparing scores of
                         emotional closeness (Z = 3.691; p = 0.001) and cat-owner interaction subscale (Z = −2.066;
                         p = 0.039), with higher scores from women. Perceived cost scores were equivalents (Z = −1.766;
                         p = 0.77).
Animals 2022, 12, 1030                                                                                                                                                        14 of 21

                                 Table 6. Personality traits, cat sex and cat coat color.

                          Active             Aloof              Bold              Calm            Friendly     Intolerant       Shy        Stubborn       Tolerant     Trainable
 Mean (SD) male           4.9 (1.9)        2.5 (1.6)          5.4 (1.8)         5.1 (1.6)         5.6 (1.6)     2.8 (1.5)     3.4 (1.9)     4.1 (2.0)     4.8 (1.9)     4.5 (1.8)
 Mean (SD) female         4.8 (1.9)        3.1 (1.9)          4.9 (1.8)         4.7 (1.9)         4.9 (1.8)     3.4 (1.9)     3.6 (2.0)     4.5 (1.9)     4.4 (1.8)     3.8 (1.8)
                        Z = −0.703;      Z = −2.199;         Z = −2.607;       Z = −1.645;       Z = −3.059;   Z = −2.186;   Z = −0.579;   Z = −1.527;   Z = −1.936:   Z = −2.709;
  Male vs. female
                         p = 0.482         p = 0.028          p = 0.009         p = 0.100         p = 0.002     p = 0.029     p = 0.563     p = 0.127     p = 0.053     p = 0.007
 Color with the highest score in each personality trait
                           Tabby             Gray              Tabby             Orange           Orange         Gray          Gray         Tricolor       Bicolor      Orange
      % male               39.4%             27.8%             39.4%              78.6%            78.6%         27.8%         27.8%         15.6%          55.1%        78.6%
     % female              60.6%             72.2%             60.6%             21.4%            21.4%          72.2%         72.2%         84.4%         44.9%        21.4%

                                 Table 7. Owner gender, personality traits and cat coat color.

   Owner Gender           Active             Aloof              Bold              Calm            Friendly     Intolerant       Shy        Stubborn       Tolerant     Trainable
                        Z = 10.141;       Z = 5.579;         Z = 10.129;        Z = 12.129;      Z = 6.233;    Z = 3.589;    Z = 4.663;    Z = 13.667;   Z = 4.299;    Z = 12.818;
         Male
                         p = 0.119         p = 0.472          p = 0.119          p = 0.059       p = 0.398     p = 0.732     p = 0.588      p = 0.034    p = 0.636      p = 0.046
                         Z = 9.393;       Z = 7.981;         Z = 7.228;         Z = 8.979;       Z = 7.148;    Z = 8.192;    Z = 4.698;    Z = 1.436;    Z = 6.855;    Z = 4.501;
      Female
                         p = 0.153         p = 0.240          p = 0.300          p = 0.175       p = 0.307     p = 0.224     p = 0.583      p = 0.964    p = 0.335      p = 0.609
 Color with the highest score in each personality trait
   Total sample           Tabby              Gray              Tabby             Orange           Orange         Gray          Gray         Tricolor       Bicolor      Orange
   Male owners             Black             Black             Orange            White            Orange         Gray          White        Tricolor       White        Tabby
  Female owners           Tabby              Gray              Tabby             Orange           Orange         Gray          Gray         Tricolor       Bicolor      Orange
Animals 2022, 12, 1030                                                                                           15 of 21

                         4. Discussion
                               In this study, people reported to perceive their cats as bold and friendly. Highest score
                         for each personality trait showed that gray cats had the highest score for being as shy, aloof
                         and intolerant, while orange cats had the highest scores for being trainable, friendly and
                         calm. Tabbies the highest for bold and active, tricolor cats for stubborn, and bicolor cats
                         for tolerant. No significant differences in personality traits (p > 0.05) were found when
                         comparing the groups based on coat color. It is possible that with a larger sample size and
                         balanced groups in size, the differences were significant.
                               Contextualizing the findings of any coat color study with the existing literature is not
                         simple due to the lack of uniform color patterning in cats [12]. The results of the present
                         study partially coincide with those found by Delgado et al. [10], who reported that orange
                         cats are considered friendly and tricolor cats are intolerant. Nevertheless, Stelow et al. [6]
                         indicated that recent studies found no relationship between cat coat color and behavior.
                               Notably, despite the myths surrounding black cats, their predominant trait according
                         to the owners’ reports is friendliness. Jones & Hart [22] using evaluation of cats’ photos
                         found in their sample that people rated black cats as less friendly and more aggressive
                         than their non-black counterparts. For dogs, anecdotal reports indicate that black dogs take
                         longer to be adopted; however, Díaz Videla [8] found that color is not a useful predictor
                         of the fate of shelter dogs. Jones & Hart [22] did not find a bias related to black cats in the
                         willingness to adopt cats. These studies are evidence that people’s perception of cats may
                         differ from their own cat’s personality perception. Therefore, it is necessary to conduct more
                         researches such as the present one, in which the perception of the own cat is evaluated.
                               Physiological aspects must be considered in the study of the variables related to the
                         cat’s personality. As mentioned above, different studies have showed evidence of the
                         relationship between the physical appearance of mammals and personality traits [7,8],
                         which is based on the fact that the pigment melanin shares a synthesis pathway with a
                         group of catecholamines and neurotransmitters [9], such as dopamine, which may lead
                         to associations between pigmentation and personality traits [8]. Personality trait is a
                         multidetermined variable. Other variables, in addition to the color of the cats, could
                         explain the differences in personality traits. The age and sex of the cats, as well as the age
                         and gender of the owners, were analyzed. The age of cats is logically related to personality
                         traits such as active, trainable and bold. In our study, the age of the cats was equivalent
                         among the groups according to the color of the cats. The results showed that the sex of
                         cats is associated with their color. There is a predominance of males in orange cats and
                         females in gray, tricolor and tabby. These colors are the ones that obtained the highest
                         scores in most personality traits. Sex of the cat may be an important variable in the study
                         of cat personality.
                               Owner variables could affect their perception of personality traits in their cats, we
                         analyzed age and gender of the owner. The highest percentage of the sample corresponds
                         to women, so it was analyzed whether the difference in some scores when comparing
                         men and women affects our conclusions, when performing the analysis exclusively with
                         women, the colors identified with higher scores in each trait of personality does not vary.
                         However, it is detected that the perception of men and women can vary, for future research
                         it is suggested that men and women of the same family be evaluated to compare their
                         perception of the predominant personality trait in the same cat.
                               A good owner-cat relationship can provide what is known as the pet effect, which
                         refers to the benefits to an individual’s emotional well-being in the presence of a pet [23].
                         Identifying factors associated with a good owner-cat relationship, such as cats’ personality
                         traits, will allow us to further elucidate the pet effect. According to the results reported
                         by Janssens et al. [23], this effect varies between the presence of and interaction with a
                         companion animal. When a pet is simply present (passive), negative feelings are reduced;
                         however, interacting with the pet generates positive feelings.
                               The cat-owner interaction was found to be positively correlated with the traits: active-
                         ness and friendliness and negatively correlated with aloofness. Based on this result and the
You can also read