Dietary Effects of Carotenoid on Growth Performance and Pigmentation in Bighead Catfish (Clarias macrocephalus Günther, 1864) - MDPI

Page created by Leslie Brewer
 
CONTINUE READING
Dietary Effects of Carotenoid on Growth Performance and Pigmentation in Bighead Catfish (Clarias macrocephalus Günther, 1864) - MDPI
fishes
Article
Dietary Effects of Carotenoid on Growth Performance and
Pigmentation in Bighead Catfish (Clarias macrocephalus
Günther, 1864)
Tran Thi Thanh Hien, Trinh Van Loc, Tran Le Cam Tu, Tran Minh Phu, Pham Minh Duc, Hua Thai Nhan
and Pham Thanh Liem *

                                          College of Aquaculture and Fisheries, Can Tho University, Campus II, 3/2 Street, Ninh Kieu District,
                                          Can Tho City 900000, Vietnam; ttthien@ctu.edu.vn (T.T.T.H.); tvloc@ctu.edu.vn (T.V.L.);
                                          tlctu@ctu.edu.vn (T.L.C.T.); tmphu@ctu.edu.vn (T.M.P.); pmduc@ctu.edu.vn (P.M.D.); htnhan@ctu.edu.vn (H.T.N.)
                                          * Correspondence: ptliem@ctu.edu.vn; Tel.: +84-0292-3830642

                                          Abstract: This study investigates the effects of supplemental carotenoid pigments on growth and
                                          color performance in bighead catfish (Clarias macrocephalus). Two experiments were undertaken to
                                          determine the appropriate types, feed duration, and dose of astaxanthin (As), canthaxanthin (Ca),
                                          and xanthophyll (Xa) pigments individually and in combination. In the first experiment, fish were
                                          fed with one control diet (basic diet), six experimental diets comprised of three diets of As, Ca, and
                                          Xa at a 100 mg/kg rate of supplementation, respectively, and three diets combinations of As + Ca,
                                          As + Xa, and Ca + Xa at a supplement rate of 50 mg + 50 mg/kg. The results showed no significant
                                          difference in weight gain (WG), specific growth rate (SGR), survival rate (SR), and feed conversion
                                          ratio of fish among treatments (p > 0.05) after 6 weeks. The L* (Lightness) and a* (redness) values in
                                the Xa diet were significantly lower than other treatments, while b* (yellowness) was significantly
         
                                          higher than in the control and others treatments (p < 0.05). These values peaked after 4 weeks and
Citation: Hien, T.T.T.; Loc, T.V.; Tu,
T.L.C.; Phu, T.M.; Duc, P.M.; Nhan,
                                          remained stable until the end of the experiment. Consistently, the highest muscle carotenoid content
H.T.; Liem, P.T. Dietary Effects of       (16.89 ± 0.60 mg/100 g) was found in the fish fed with the Xa diet. The Xa diet was selected for the
Carotenoid on Growth Performance          second experiment. This experiment consisted of four Xa supplemented diets at rates of 25, 50, 75,
and Pigmentation in Bighead Catfish       and 100 mg/kg and a basal diet without any Xa supplementation. The results showed that there was
(Clarias macrocephalus Günther, 1864).    no difference in the SGR or SR of fish fed various Xa levels (p > 0.05). Fish fed the Xa diet of 75 mg/kg
Fishes 2022, 7, 37. https://doi.org/      were the most preferred by consumers for the natural “yellowness” of muscle. Thus, the results
10.3390/fishes7010037                     suggested that additional carotenoid pigments did not affect the growth performance of fish. Farmers
Academic Editor: Pedro                    and feed producers could utilize Xa at an optimal dose of 75 mg/kg to enhance color performance in
Gómez-Requeni                             the market size of bighead catfish for at least 4 weeks prior to harvest.

Received: 7 November 2021
                                          Keywords: carotenoids; Clarias macrocephalus; skin color; muscle yellowness; xanthophyll
Accepted: 1 February 2022
Published: 4 February 2022

Publisher’s Note: MDPI stays neutral
with regard to jurisdictional claims in   1. Introduction
published maps and institutional affil-
                                                Bighead catfish Clarias macrocephalus is one of the most popular and economically
iations.
                                          important indigenous fish in Southeast Asia [1–5]. The fish has become one of the most
                                          important freshwater species for the aquaculture industry in Vietnam [3–5]. The market
                                          values of this fish not only depend on meat quality and taste but also rely on skin and muscle
Copyright: © 2022 by the authors.
                                          pigmentation performance. Buyers and consumers alike prefer good quality bighead
Licensee MDPI, Basel, Switzerland.        catfish to have yellowish skin and muscle tone. This is the most important characteristic
This article is an open access article    of fish quality at the market. Other studies reported that the color of the fish is the
distributed under the terms and           first characteristic perceived and is a determinant selection criterion, directly related to
conditions of the Creative Commons        subsequent acceptance or rejection [6,7].
Attribution (CC BY) license (https://           Farmed bighead catfish typically exhibit pale muscle color and do not have the natural
creativecommons.org/licenses/by/          attractive color found in wild fish. This issue negatively affects profitability for farmers
4.0/).                                    because of reduced market prices and reduced consumer demand. To overcome this issue,

Fishes 2022, 7, 37. https://doi.org/10.3390/fishes7010037                                                      https://www.mdpi.com/journal/fishes
Dietary Effects of Carotenoid on Growth Performance and Pigmentation in Bighead Catfish (Clarias macrocephalus Günther, 1864) - MDPI
Fishes 2022, 7, 37                                                                                           2 of 16

                     numerous applications have been carried out by farmers, such as diet supplementation
                     with raw carotenoid ingredients such as pumpkin, sweet potato, and carrot [4,5]. However,
                     these applications did not provide any successful color improvement of the fish due to
                     faded color results.
                           Similar to other species, bighead catfish are not able to synthesize their own coloring
                     pigments de novo. The coloring pigments are related to carotenoid supplementation
                     and need to be incorporated into the diet [8,9]. In the wild, fish acquire pigments from
                     natural foods such as algae, crustaceans, etc. However, natural food varies the number of
                     carotenoids. The carotenoid pigments, astaxanthin, canthaxanthin, and xanthophyll, are
                     widely used in aquafeed [10]. The addition of these pigments to diets has been shown to
                     enhance color and growth performance, improve survival rate, and reduce stress [11–13].
                           Studies have shown that incorporating synthetic carotenoid pigments or natural
                     carotenoid-rich feed ingredients into fish diet enhances the growth and color performances
                     of different fish [12,14–18]. However, the optimum dietary supplementation level for each
                     of the carotenoid pigments (canthaxanthin, astaxanthin, xanthophylls) is species-specific.
                     The application of canthaxanthin or astaxanthin has been shown to be effective on rainbow
                     fillets Oncorhynchus mykiss at a dietary supplementation level of 80 mg/kg of diet [19].
                     Other studies have found that both xanthophylls and astaxanthin (37.7–75 mg/kg of diet)
                     were effective carotenoid sources for skin color improvement in large yellow croaker
                     Larimichthys croceus [12]. However, there is currently a lack of knowledge and scientific
                     literature on the effect of these carotenoids on the color performance of bighead catfish
                     C. macrocephalus. Therefore, the purpose of this study was to examine the appropriate
                     carotenoid pigment, supplemental dose, and administration period on the growth and
                     color performances of bighead catfish C. macrocephalus.

                     2. Materials and Methods
                     2.1. Experimental Fish
                          Juvenile bighead catfish (46.11 ± 1.19 g) were obtained from a reliable hatchery (Tam
                     Loc hatchery, Can Tho City, Vietnam). Fish were placed in plastic containers with gentle
                     aeration then transferred to the wet lab of the College of Aquaculture and Fisheries, Can
                     Tho University. The fish were acclimatized to the experimental conditions for 2 weeks prior
                     to use for the trial, and they were fed with a basal diet during this period.

                     2.2. Experimental Design
                          Two experiments were conducted to examine the appropriate dietary pigments sup-
                     plementation for optimal growth and color performance of bighead catfish.
                          In the first experiment, fish were fed with seven dietary levels or combinations of
                     astaxanthin (As), canthaxanthin (Ca), and xanthophyll (Xa) (Manufacturer BASF, Germany),
                     including a control diet without additional pigment supplementation (Basic diet only,
                     Table 1). Three diets were supplemented with As, Ca, and Xa at the level of 100 mg/kg of
                     feed, and three combination diets were supplemented with 50 mg As + 50 mg Ca/kg of
                     feed, 50 mg As + 50 mg Xa/kg of feed, and 50 mg Ca + 50 mg Xa/kg of feed. Overall, the
                     diets were labelled as control, As, Ca, Xa, As + Ca, As + Xa, and Ca + Xa diets, respectively.
                     These reference levels were based upon the approved carotenoid pigments level for use
                     in aquaculture feed in the United States and the European Union and range from 80 to
                     135 mg/kg of feed (USA: 21CFR Section and EU Code No. (EC, 2003b), regulation No:
                     CD70/524/EEC).
Dietary Effects of Carotenoid on Growth Performance and Pigmentation in Bighead Catfish (Clarias macrocephalus Günther, 1864) - MDPI
Fishes 2022, 7, 37                                                                                                                3 of 16

                     Table 1. Chemical composition of basal diet (dry matter basis).

                                           Ingredient                                                Amount (%)
                                         Fish meal      1                                                 25.0
                                  Defatted soybean meal 2                                                 35.0
                                        Blood meal 3                                                      7.00
                                         Rice bran 4                                                      15.0
                                       Cassava meal 5                                                     14.5
                                          Fish oil 6                                                      1.00
                                Premix mineral and vitamin 7                                              1.00
                                   Shrimp soluble extract 8                                               1.00
                                        Guar gum 9                                                         0.5
                                            Total                                                         100
                         Proximate analysis (% as dry matter basis)
                                      Crude Protein                                                       43.8
                                       Crude Lipid                                                        6.82
                                           Ash                                                            11.9
                                      Carbohydrate                                                        37.5
                                      Gross energy (KJ/g)                                                 19.5
                     1 Ca Mau fishmeal Vietnam. Defatted soybean meal Maharashtra Solvent extraction LTD India. 3,4,5,6 Blood
                                                    2

                     meal, rice bran, fish oil, cassava meal were imported and supplied by Viet Thang feed mill. 7 Premix khoáng
                     vitamin: Vitamin A. 6,000,000 UI; Vitamin D3 . 200,000 UI; Vitamin E. 50,000 mg; Vitamin K3 . 6000 mg Vitamin
                     B1 . 11,000 mg; Vitamin B2 . 7000 mg; B6: Vitamin B6: 8000 mg Vitamin B12 . 20 mg; Vitamin C Stay. 5000 mg;
                     Inositol. 5000 mg; Folic acid. 3000 mg; Biotin. 500 mg; Pantothenic Acid. 35,000 mg; Niacin. 60,000 mg; Iron (Fe2+ ).
                     50,000 g; Copper (Cu2+ ). 34,000 mg; Zinc (Zn2+ ). 125,000 mg; Manganese (Mn2+ ). 12,000 mg; Iodine (I− ). 500 mg;
                     Cobalt (Co2+ ). 250 mg; Se. 200 mg. 8 Attractant (shrimp solution extract) was made in Minh Phu comp., Vietnam.
                     9 Binder (guar gum) was imported from Pakistan and supplied by Hoa chat Can Tho comp., Vietnam.

                           Feed formulation and proximate analysis of the basal experimental diet are shown
                     in Table 1. This diet meets the optimum nutrient requirement for bighead catfish [4,5].
                     Experimental diets were prepared and processed according to Hien et al. [4,5]. In brief, the
                     ingredients were ground in a hammer mill to pass through a mesh screen size of 0.8 mm.
                     All ingredients were then mixed thoroughly by a mixer. Thereafter, extruded feed (2.0 mm)
                     was dried in an oven at 45–50 ◦ C for about 8–10 h and then stored at −20 ◦ C until used.
                     The chemical composition of diets was analyzed following the methods of AOAC [20].
                           Fish were held in a recirculating experimental tank system at a stocking density of
                     60 fish/200 L tank (approximately 13.8 kg/m3 ). A total of 28 round composite tanks
                     (250 L/tank) were used. In total, there were seven recycling systems, each consisting of four
                     experimental tanks and filter tanks of 350 L. Biofilter tanks contained 87.5 litters of biofilter
                     media (RKPlast Bioelement, Brorup, Denmark, surface area 750 m2 /m3 ) and a settlement
                     tank (solid tank) of 120 L. All experimental recirculating systems were prepared at least
                     21 days prior to use, during which time water flow rates remained constant at 0.8–1 L/min.
                     The experiment lasted for 6 weeks.
                           The second experiment, this experiment was designed to assess the effect of xantho-
                     phyll pigment on growth and color in bighead catfish. Results from Experiment 1 showed
                     that dietary xanthophyll gave the best improvement in color after 4 weeks. This experiment
                     was carried out to examine the appropriate supplemental doses of xanthophyll pigment
                     for growth and color performance to meet consumer tastes. Fish were fed with five diets
                     consisting of 0.0 mg (Basal diet), 25, 50, 75, and 100 mg Xa/kg of feed, hereafter called
                     control, 25 mg Xa, 50 mg Xa, 75 mg Xa, and 100 mg Xa. The basal diet (Table 1) and
                     experimental design and set-up were also the same as in Experiment 1. All experiments
                     were carried out in accordance with national guidelines on the protection and experimental
                     animal welfare in Vietnam, Law of Animal Health, 2015 (Report number: VM5068).

                     2.3. Experimental Management
                         Experimental fish were fed ad libitum, twice a day at 8:00 a.m. and 16:00 p.m. Water
                     parameters, including water temperature, pH, and dissolved oxygen, were measured twice
Fishes 2022, 7, 37                                                                                              4 of 16

                     daily at 7:00 a.m. and 15:00 p.m. using a multiple parameters meter (YSI 556, USA) and
                     were maintained within a suitable range for normal growth, i.e., temperature (27.4–31.4 ◦ C),
                     pH (7.6–8.3), and DO (4.7–5.2 mg/L). Total ammonium nitrogen (TAN) and nitrite-nitrogen
                     were measured weekly and remained at 0.12–0.18 mg/L; 0.1–0.2 mg/L for the duration of
                     the experiment, respectively.

                     2.4. Growth Performance Parameters
                          Fish weight was measured at the beginning of the experiment and at two-week
                     intervals until the end of the experiment. Growth performance parameters such as weight
                     gain (WG), specific growth rate (SGR), and survival rate (SR) were calculated using the
                     followings equations:
                                                  Weight gain (WG, g) = (Wf ) − (Wi )                     (1)
                                Specific growth rate (SGR, % day−1 ) = {(Ln (Wf ) − Ln (Wi )/T} × 100              (2)
                            Survival rate (SR, %) = (Final number of fish)/(Initial number of fish)× 100           (3)
                     where: Wf and Wi are the final and initial wet weight of bighead catfish; T = time duration
                     of the experiment; Ln = normal logarithm.

                     2.5. Skin and Muscle Pigmentation
                          The colour performance in bighead catfish was assessed by a combination of three dif-
                     ferent methods, a colorimeter, sensory assessment methods, and by examining accumulated
                     carotenoids in the muscle of fish as follows:

                     2.5.1. Colorimeter Method
                           The color change was examined using a CR200 Colorimeter (Minolta Camera Ltd.,
                     Osaka, Japan) [21,22]. Fish were measured at the beginning of the experiment and every
                     two weeks until the end of the experiment. Here, 12 fish per treatment (3 fish per tank)
                     were assessed. All measurements were shown in the colorimetric space L*, a*, b* according
                     to Commission Internationale de l’Éclairage guidance [23]. Each measurement determined
                     and recorded standard L*, a*, b* values. The L*, a*, b* values were measured at various
                     positions on each fish (body skin, abdominal skin, and muscle), as shown in Figure 1. Each
                     measurement was repeated three times for body skin, abdominal skin, and muscle. Finally,
                     average color values L*, a*, b* for experimental fish were calculated and recorded. The L*
                     value represents the lightness from black to white on a scale between 0 and 100, while the
                     a* value represents a shade from red (+) to green (−), and the b* value represents shade
                     from yellow (+) to blue (−) in the color measurement of fish.
                           To evaluate the effect of different treatments on the catfish’s color, the mean (L*, a*,
                     b*) color value of the bighead catfish for each treatment was compared to that of the
                     control group. The comparison metric was the color difference defined by the International
                     Commission on Illumination (CIE) in 1976, which has been extensively applied in various
                     studies related to food color measurement and comparison [24–26]. Accordingly, the mean
                     color difference between a non-control catfish with the mean color c(L*, a*, b*) and a treated
                     catfish with the mean color c(Lt *, at *, bt *) in their L*, a*, b* color space was calculated as
                     seen in Equation (4).
                                                        q
                                               ∗
                                             ∆Eab   =       (L∗ −Lt∗ )2 + (a∗ −at∗ )2 + (b∗ −bt∗ )2                (4)
Fishes 2021, 6, x FOR PEER REVIEW                                                                                                             5 of 17

Fishes 2022, 7, 37
                                                                     ΔE*ab =    ( L -L ) + ( a -a ) + ( b -b )
                                                                                   *   * 2
                                                                                        t
                                                                                                 *   * 2
                                                                                                     t
                                                                                                               *   * 2
                                                                                                                   t
                                                                                                                                              5 of 16
                                                                                                                                                 (4)

                                    Fig  re 1.1.Digital
                                     Figure      Digitalimage
                                                         imagefor
                                                               forsite
                                                                   sitecolor
                                                                        colormeasurement
                                                                             measurement(circle)
                                                                                         (circle)of
                                                                                                  ofbody
                                                                                                     bodyskin
                                                                                                          skin(A),
                                                                                                               (A),abdominal
                                                                                                                    abdominalskin
                                                                                                                              skin(B),
                                                                                                                                   (B),and
                                                                                                                                        and
                                    muscle  (C)   of bighead catfish.
                                     muscle (C) of bighead catfish.

                                     2.5.2.Sensory
                                    2.5.2.  SensoryEvaluation
                                                     EvaluationMethod
                                                                   Method
                                           The appearance
                                          The   appearance of ofbighead
                                                                  bigheadcatfish    color
                                                                              catfish      waswas
                                                                                        color    alsoalso
                                                                                                        assessed    through
                                                                                                               assessed       the sensory
                                                                                                                           through           evalua-
                                                                                                                                      the sensory
                                     tion  method   of Meilgaard    et al.  [27]. The   apparent     color    of  the fish
                                    evaluation method of Meilgaard et al. [27]. The apparent color of the fish was scored  was  scored   on  a scale
                                                                                                                                               on a
                                     from  1 to 9. The  color of the control    was   scored  at  6,  while    the  other  experimental
                                    scale from 1 to 9. The color of the control was scored at 6, while the other experimental              samples
                                     were coded
                                    samples   wereand
                                                    codedscored
                                                            and in  comparison.
                                                                 scored                ScoresScores
                                                                           in comparison.       increased       more more
                                                                                                         increased      than than
                                                                                                                             6 if the
                                                                                                                                   6 ifyellow    was
                                                                                                                                        the yellow
                                     darker
                                    was      thanthan
                                         darker    the control   andand
                                                        the control   decreased
                                                                            decreasedlessless
                                                                                          thanthan
                                                                                                 6 if 6the  yellow
                                                                                                         if the       color
                                                                                                                 yellow      waswas
                                                                                                                          color   lighter  than
                                                                                                                                      lighter     the
                                                                                                                                               than
                                     control.
                                    the        This
                                        control.     evaluation
                                                  This  evaluationmethod
                                                                    methodwas   wascarried
                                                                                      carriedout
                                                                                               outbyby10  10 independent
                                                                                                              independent assessors       who had
                                                                                                                              assessors who      had
                                     normalcolour
                                    normal    colourvisions
                                                       visionsand
                                                                andwere
                                                                     wereable able to
                                                                                    to detect
                                                                                       detect anomalies
                                                                                                anomaliesin      inthe
                                                                                                                    the appearance
                                                                                                                         appearanceof   offish
                                                                                                                                           fish in
                                                                                                                                                 in aa
                                     consistent  manner.
                                    consistent manner.
                                     2.5.3. Carotenoid Analysis
                                    2.5.3. Carotenoid Analysis
                                           At the end of the experiment, the accumulated carotenoid level in the flesh (muscle
                                          At the end of the experiment, the accumulated carotenoid level in the flesh (muscle
                                     tissue and skin) of fish was also analyzed following the method described by previous
                                    tissue and skin) of fish was also analyzed following the method described by previous
                                     studies [28,29]. Samples were randomly taken from three fish per tank. After anesthetizing
                                    studies [28,29]. Samples were randomly taken from three fish per tank. After anesthetizing
                                     with clove oil, each fish was carefully dissected, and muscle was immediately sampled
                                    with clove oil, each fish was carefully dissected, and muscle was immediately sampled
                                     for carotenoid analysis. Briefly, the flesh samples were randomly collected from 12 fish
                                    for carotenoid analysis. Briefly, the flesh samples were randomly collected from               12 fish
                                     per treatment (three fish per tank). The flesh samples were frozen at −20 ◦ C and then
                                    per treatment (three fish per tank). The flesh samples were frozen at −20 °C and then
                                     homogenized in frozen conditions using a grinder. Carotenoids were extracted from
                                    homogenized
                                     representativein5.0frozen     conditions
                                                            g subsamples        using
                                                                             using   3× a grinder.
                                                                                          25 mL ofCarotenoids     were extracted
                                                                                                     acetone. Acetone     extractionfrom
                                                                                                                                      was
                                    representative    5.0 g subsamples    using  3 × 25 mL  of acetone. Acetone  extraction  was
                                     carried out three times until the solvent became colorless. After the addition of the last   carried
                                    out  threeextraction
                                     acetone    times untilandthelasting
                                                                   solventfor
                                                                            became
                                                                               24 h, colorless.
                                                                                      the samplesAfter thecentrifuged
                                                                                                    were   addition of at
                                                                                                                       the4000
                                                                                                                            last RPM
                                                                                                                                  acetone
                                                                                                                                        for
                                    extraction   and   lasting for 24 h, the  samples   were  centrifuged  at 4000 RPM    for 5
                                     5 min. The absorbance of the extracts was recorded at 470 nm using a Hitachi U5100 (Tokyo, min.  The
                                    absorbance     of the extracts was
                                     Japan) spectrophotometer,        andrecorded    at 470 nm
                                                                           the carotenoid       using a Hitachi
                                                                                             concentration       U5100was
                                                                                                             (mg/mL)     (Tokyo,   Japan)
                                                                                                                             determined
                                    spectrophotometer,       and    the  carotenoid    concentration   (mg/mL)    was
                                     by reference to a standard curve. The carotenoid concentration in the muscle sampledetermined      by
                                    reference   to a standard   curve.  The  carotenoid   concentration  in the muscle
                                     (mg/100 g) was calculated based on the dilution and the weight of muscle samples. sample    (mg/100
                                    g) was calculated based on the dilution and the weight of muscle samples.
                                     2.6. Statistical Analysis
                                    2.6. Statistical
                                           All data Analysis
                                                      were calculated as mean values and standardized deviations (Mean ± SD)
                                         AllMicrosoft
                                     using   data were  calculated
                                                      Excel         as mean
                                                            2013. Two        values
                                                                       factorials    and standardized
                                                                                  analyses                deviations
                                                                                             of various pigments      (Mean
                                                                                                                    and times±were
                                                                                                                               SD)
                                    using Microsoft
                                     employed        Excel 2013.
                                                by Two-way       Two factorials
                                                              ANOVA              analyses
                                                                         (IBM SPSS          of various
                                                                                    Statistics          pigments
                                                                                                 21, SPSS          and times
                                                                                                           Inc., Chicago,     were
                                                                                                                          IL, USA).
                                     Mean comparisons
                                    employed   by Two-waybetween
                                                             ANOVAtreatments  were made
                                                                        (IBM SPSS          using
                                                                                    Statistics  21,a SPSS
                                                                                                     one-way
                                                                                                          Inc.,ANOVA.
                                                                                                                Chicago,Differences
                                                                                                                         IL. USA).
                                     between means were evaluated for significant differences by Duncan’s test at p < 0.05.
Fishes 2022, 7, 37                                                                                                                 6 of 16

                     3. Results
                     3.1. Effect of Various Dietary Pigments on Growth and Color Performance of Bighead Catfish
                     3.1.1. Growth Performance, Feed Utilization, and Survival Rate
                          The growth performance, feed utilization, and survival rate of bighead catfish fed
                     with the various dietary pigments are shown in Table 2. The results show that the highest
                     final weight (Wf ) was found in those fish fed the xanthophyll diet. However, statistical
                     analysis by one-way ANOVA showed no significant difference in specific growth rate (SGR)
                     among the dietary pigments treatments (p > 0.05). The average final weight (Wf ) varied
                     from 56.8 to 59.5 g/fish, and the SGR fluctuated from 0.35 to 0.43%/day. High survival
                     rates ranging from 80.8 to 89.2% were recorded for all treatments.

                     Table 2. Growth performance, initial weight (Wi , g/fish), final weight (Wf , g/fish), specific growth
                     rate (SGR, %/day), and survival rate (SR, %) of fish fed dietary pigments for 6 weeks.

                             Treat.                   Wi                     Wf                     SGR                   SR (%)
                            Control              46.3 ± 0.55           57.6 ± 1.22   ab         0.36 ± 0.43            80.8 ± 13.4
                              As                 45.9 ± 1.06           56.8 ± 1.40 b            0.35 ± 0.01            87.9 ± 3.69
                              Ca                 46.6 ± 0.46           59.2 ± 1.43 a            0.39 ± 0.05            85.4 ± 4.38
                              Xa                 45.8 ± 1.63           59.5 ± 2.04 a            0.43 ± 0.05            86.7 ± 3.59
                            As + Ca              46.0 ± 1.79           58.3 ± 1.08 ab           0.39 ± 0.09            87.1 ± 2.84
                            As + Xa              46.2 ± 1.07           58.3 ± 0.86 ab           0.38 ± 0.04            89.2 ± 7.00
                            Ca + Xa              45.9 ± 1.08           58.8 ± 1.77 ab           0.41 ± 0.02            87.9 ± 4.16
                     Values are means of four replicates ± S.D; values with the same letters are not significantly different (p > 0.05) in
                     the same column. Abbreviation: As, Astaxanthin; Ca, Canthaxanthin; Xa, Xanthophyll.

                     3.1.2. Color Performance
                           Statistical analysis by two-way ANOVA showed that there was a significant difference
                     in the L*, a*, and b* values for body skin, abdominal skin, and muscle of bighead catfish
                     in all treatments over the sampling weeks (p < 0.001) (Table 3). Fish fed with xanthophyll
                     supplemented diet showed the most yellow color in body skin, abdominal skin, and muscle
                     compared with other diets (Figures 2 and 3). The highest values for the fish fed the Xa
                     diet were achieved at 4 weeks and remained stable or reduced gradually at week 6. These
                     values were relatively improved and consistent for body skin, abdominal skin, and muscle
                     in all diets after two weeks of the feeding trial. Among the diets, the L* (Lightness) and a*
                     (redness) values in the xanthophyll supplemented diet (Xa diet) were significantly lower
                     than in the other treatments, but not significantly compared to the control treatment, while
                     b* (yellowness) was significantly higher than the control and others treatments (p < 0.05).
                           Lightness values of the body skin, abdominal skin, and muscle of fish are shown in
                     Figure 4. Statistical analysis by one-way ANOVA showed that there were no significant
                     differences in the L* values of body skin, abdominal skin, and muscle for the control
                     treatment during the feeding trial (p > 0.05). The body skin lightness of fish fed with
                     carotenoid supplemented diets showed a slight increase with increasing feeding duration,
                     while the abdominal skin and muscle lightness showed a slight decrease.
Table 3. L*, a*, b* for body skin, abdominal, and muscle of bighead catfish during the trial.
                                                      Body Skin                                                 Abdominal Skin                                                         M scle
Time (Week)        Treat.
                                       L*                  a*                   b*                   L*                   a*                    b*                    L*                    a*                   b*
 Fishes 2022, 7, 37                                                                                                                                                                                                     7 of 16
                  Control        10.8 ± 1.62 a 1.89 ± 0.68 a 2.45 ± 1.07 a 45.4 ± 0.38 ab 17.9 ± 0.72 b 15.6 ± 0.65 a 40.1 ± 1.57 cd 1.44 ± 0.33 a 8.39 ± 0.84 a
                     As          13.6 ± 1.36 b 8.16 ± 1.45 c 6.18 ± 1.32 bc 50.8 ± 0.99 bc 21.6 ± 0.87 e 16.4 ± 1.06 ab 41.5 ± 1.11 de 1.57 ± 0.48 a 15.1 ± 0.50 b
                     Ca          18.6 ± 0.86 d 10.7 ± 0.57 de 4.99 ± 0.62 b 59.0 ± 0.19 de 20.3 ± 1.04 cd e 17.3 ± 1.10 ab 37.6 ± 1.82 b 1.40 ± 0.27 a 16.3 ± 0.93 ab
                     Xa          13.5 ± 1.06 bTable  4.26 ±3.1.18
                                                                L*,ba*,9.52     ± 0.94
                                                                           b* for     body e   40.9
                                                                                                skin,± 0.89    a 21.2 ± 1.02 de 18.3 ± 0.51 ab 37.9 ± 1.49 bc 1.46 ± 0.34 a
                                                                                                          abdominal,          and muscle of bighead catfish during the trial.                              16.9 ± 0.53 b
       2
                  As + Ca        20.2 ± 0.54 12.3 ± 0.87 6.78 ± 0.87 54.5 ± 0.53 19.7 ± 0.51
                                                  d                   e                   cd                  cd                   bcd  15.83 ± 0.41 43.2 ± 0.55 1.69 ± 0.30 16.2 ± 0.55 ab
                                                                                                                                                             a                    e                     a

                  As + Xa        16.3 ± 1.35 c 9.13 ±Body    0.82    cd 8.24 ± 1.09 de 59.8 ± 0.43 de 18.7
                                                                  Skin                                                   ± 0.67 bc
                                                                                                                      Abdominal     Skin 16.9 ± 0.62 ab 33.9 ± 0.82 a                1.60 ±Muscle
                                                                                                                                                                                                0.19 a 15.8 ± 0.39 ab
    Time (Week)       Treat.
                  Ca + Xa        16.1 ± 1.18L*    c 9.47 ± 0.44 a* cd 7.03 ± 0.27c   b*     d 62.9 ± 8.04 L* e     16.2 ± 1.49 a* a      16.4 ± 1.99 b* ab 43.7 ± 1.13    L*      e  1.63 ± 0.47a*      a  15.7 ± 0.73b*      b

                Mean    ± SD
                     Control     15.610.8
                                       ± 1.18
                                           ± 1.62Aa 8.0 ±    0.44
                                                          1.89
                                                                    A a 6.50 ± 0.27 Aa 53.3 ± 8.04 Aab 19.4 ± 1.49 Ab 16.7 ± 1.99 A
                                                               ± 0.68          2.45 ± 1.07         45.4 ± 0.38          17.9 ± 0.72           15.6 ± 0.65 a     39.7
                                                                                                                                                                   40.1±±1.13
                                                                                                                                                                           1.57 cd    1.51.44
                                                                                                                                                                                           ± 0.47
                                                                                                                                                                                               ± 0.33Aa 14.98.39 ± 0.73
                                                                                                                                                                                                                     ± 0.84 Aa
                       As                  ± 1.36 ab           ± 1.45ac            ± 1.32 abc            ± 0.99abc            ± 0.87ae                     ab              1.11 de                     a
                                                                                                                                                                                               ± 0.48 ab               0.50 ba
                  Control        10.913.6
                                       ± 1.71        2.128.16
                                                           ± 0.86         2.706.18
                                                                                ± 0.67         46.150.8
                                                                                                     ± 1.83        16.121.6
                                                                                                                          ± 0.90               ±±
                                                                                                                                         15.616.4     1.06 ab
                                                                                                                                                   1.19              ± ±1.52
                                                                                                                                                               39.941.5          ab 1.621.57± 0.76
                                                                                                                                                                                          1.40 ± 0.27 a
                                                                                                                                                                                                                 ± ±1.03
                                                                                                                                                                                                           10.415.1
                       Ca            18.6 ± 0.86 d       10.7 ± 0.57 de        4.99 ± 0.62 b       59.0 ± 0.19 de     20.3 ± 1.04 cd e       17.3 ± 1.10 ab         37.6 ± 1.82 b                             16.3 ± 0.93 ab
         2           AsXa        25.913.5
                                       ± 1.04
                                           ± 1.06 b 16.24.26
                                                  c        ± 1.13
                                                               ± 1.18 b 6.639.52
                                                                      d         ± 1.19
                                                                                    ± 0.94ce 51.3 40.9
                                                                                                     ± 1.29
                                                                                                         ± 0.89ba 30.121.2± 0.83
                                                                                                                             ± 1.02 de 14.6
                                                                                                                                    d           ± ±0.81
                                                                                                                                             18.3     0.51 ab 40.337.9
                                                                                                                                                            a        ± ±1.181.49 bc 1.69 1.46
                                                                                                                                                                                 ab        ± 0.45
                                                                                                                                                                                               ± 0.34aba c 17.2  ± ±1.49
                                                                                                                                                                                                               16.9    0.53 b
                                                                                                                                                                                                                              c
                     As + Ca               ± 0.54bcd      12.3 ± 0.87ce       6.78 ± 0.87 bcd      54.5 ± 0.53 ccd     19.7 ± 0.51 bcd       15.83 ± 0.41 ca        43.2 ± 0.55 eb                     a
                                                                                                                                                                                          1.69 ± 0.30 bc      16.2 ± 0.55 ab
                     Ca          23.820.2
                                       ±  1.01     c 9.27  ±  1.10        5.10  ±  0.90        54.7  ±  1.62       25.7   ±  1.03   c    17.3   ±   1.36       41.8   ±   1.65    a 1.79    ±  0.47    a   18.5  ±    1.18    c
                     As + Xa          16.3 ± 1.35        9.13 ± 0.82 cd       8.24 ± 1.09 de       59.8 ± 0.43 de       18.7 ± 0.67 bc       16.9 ± 0.62 ab         33.9 ± 0.82           1.60 ± 0.19         15.8 ± 0.39 ab
                     Xa
                     Ca + Xa     22.216.1
                                       ± 1.37
                                           ± 1.18 bc 5.159.47
                                                           ± 0.86
                                                               ± 0.44
                                                                      bcd 10.87.03
                                                                                ± 0.87
                                                                                   ± 0.27c
                                                                                           e d 52.6 62.9
                                                                                                     ± 1.38
                                                                                                         ± 8.04b e 22.316.2
                                                                                                                          ± 1.65
                                                                                                                              ± 1.49ba   20.416.4± ±0.89d
                                                                                                                                                      1.99 ab  40.243.7
                                                                                                                                                                     ± 1.07
                                                                                                                                                                          ± 1.13 ab
                                                                                                                                                                                  e 1.421.63± 0.31
                                                                                                                                                                                               ± 0.47 ab
                                                                                                                                                                                                       a   24.215.7± ±1.38
                                                                                                                                                                                                                       0.73  be
       4            Mean ± SD              ± 1.18 cA             0.44 A             ± 0.27cA             ± 8.04cA            ± 1.49 eA                      A              ± 1.13b               0.47 A        14.9 ± 0.73 A
                  As + Ca        25.315.6
                                       ± 1.46              ± ±0.88
                                                     9.99 8.0         c   6.746.50
                                                                                ± 1.02         55.253.3
                                                                                                     ± 1.48        32.019.4
                                                                                                                          ± 1.53        15.716.7    ± 1.99abc
                                                                                                                                               ± 3.29          41.239.7
                                                                                                                                                                      ± 1.81        1.561.5± ±0.67    ab 14.7    ± 1.52 b
                  AsControl
                      + Xa       24.410.9  ± 1.71 ca 10.22.12
                                       ± 4.87                  ± 0.86ca 8.31 2.70
                                                           ± 5.33                   ± 0.67da 54.246.1
                                                                                ± 1.51                   ± 1.83ca 29.916.1
                                                                                                     ± 1.70                   ± 0.90da 19.7
                                                                                                                          ± 1.59                      1.19 ab
                                                                                                                                                ± ±0.57
                                                                                                                                             15.6           d              1.52 ab
                                                                                                                                                               39.039.9± ±1.59    a  2.21        0.76 ab
                                                                                                                                                                                            ±±0.59
                                                                                                                                                                                         1.62           c        ± ±1.06
                                                                                                                                                                                                           18.510.4     1.03 ad
                       As             25.9 ± 1.04 c       16.2 ± 1.13 d        6.63 ± 1.19 c        51.3 ± 1.29 b       30.1 ± 0.83 d         14.6 ± 0.81 a        40.3 ± 1.18 ab       1.69 ± 0.45 ab c       17.2 ± 1.49 c
                  Ca +CaXa       25.523.8
                                       ± ±5.38
                                             1.01 bc 7.889.27
                                                  c        ± 1.44
                                                               ± 1.10 c 7.83 5.10
                                                                      c         ± 1.53
                                                                                    ± 0.90 b 54.7 54.7
                                                                                          d          ± 1.71
                                                                                                         ± 1.62 c 24.925.7
                                                                                                               c          ± 1.36
                                                                                                                              ± 1.03 c 17.217.3
                                                                                                                                    c          ± 1.79      bc
                                                                                                                                                    ± 1.36 c   41.941.8
                                                                                                                                                                      ± ±3.89
                                                                                                                                                                            1.65 b
                                                                                                                                                                                  b  1.201.79±±0.45
                                                                                                                                                                                                 0.47 bc 18.918.5
                                                                                                                                                                                                        a        ± ±1.361.18 c
                                                                                                                                                                                                                              d

         4
                Mean Xa ± SD     22.622.2  ± 1.37 Bb 8.70 5.15
                                       ± 0.56              ±   ± 0.86Ab 6.90 10.8
                                                              1.52              ±   ± 0.87Ae 52.7 52.6
                                                                                  1.00              ±    ± 1.38Ab 25.922.3
                                                                                                       1.69               ±   ± 1.65Bb 17.220.4
                                                                                                                             0.59              ±    ± 0.89d
                                                                                                                                                    0.97    A   40.6
                                                                                                                                                                   40.2 ±   3.5
                                                                                                                                                                         ± 1.07  ab
                                                                                                                                                                                      1.6  ±
                                                                                                                                                                                         1.42 0.04
                                                                                                                                                                                              ± 0.31 Aab
                                                                                                                                                                                                           17.524.2
                                                                                                                                                                                                                 ±   ±  1.38 eB
                                                                                                                                                                                                                      0.55
                     As + Ca          25.3 ± 1.46 c       9.99 ± 0.88 c        6.74 ± 1.02 c        55.2 ± 1.48 c        32.0 ± 1.53 e      15.7 ± 3.29 abc         41.2 ± 1.81 b        1.56 ± 0.67 ab        14.7 ± 1.52 b
                  Control
                     As + Xa     10.224.4
                                       ± 1.12
                                           ± 4.87 c 1.2710.2
                                                  a        ± 0.33
                                                               ± 5.33 c 2.688.31
                                                                      a         ± 0.69
                                                                                    ± 1.51 d 49.6 54.2
                                                                                           a         ± 1.23
                                                                                                         ± 1.70 c 15.229.9
                                                                                                               a          ± 0.85
                                                                                                                              ± 1.59 d 15.919.7
                                                                                                                                    a          ± 1.29
                                                                                                                                                    ± 0.57 d 41.139.0
                                                                                                                                                           ab         ± ±1.12
                                                                                                                                                                            1.59 a 1.532.21
                                                                                                                                                                                  b         ± 0.59    ab 10.5 ± 0.82 da
                                                                                                                                                                                               ± 0.59 c        18.5 ± 1.06
                                           ± 5.38 cc           ± 1.44ec             ± 1.53cd 53.2 54.7   ± 1.71  c            ± 1.36dc                1.79 bc                     b               0.45 ab              1.36 dc
                     Ca + Xa
                     As          21.425.5
                                       ± 0.92        16.37.88
                                                           ± 0.85         6.117.83
                                                                                ± 1.03              ± 1.89    de 29.724.9 ± 0.99         16.617.2± ±0.84    b 39.541.9    ± 3.89 ab
                                                                                                                                                                     ± 1.59                 ± ±0.86
                                                                                                                                                                                     1.721.20              17.918.9± ±1.77
                    Mean ± SD        22.6 ± 0.56 B       8.70 ± 1.52 A        6.90 ± 1.00 A        52.7 ± 1.69 A        25.9 ± 0.59 B        17.2 ± 0.97 A           40.6 ± 3.5           1.6 ± 0.04 A         17.5 ± 0.55 B
                     Ca          25.4 ± 1.31 a 9.54 ± 0.87 a 4.86 ± 0.79 a 52.9 ± 1.33 a 25.4 ± 1.51 a 17.8 ± 1.42 40.6 ± 1.27 1.74 ± 0.60 18.8 ± 1.40 ac
                                                  e                   d                    b                  cd                    c                       b                     b                     b
                     Control          10.2 ± 1.12         1.27 ± 0.33          2.68 ± 0.69          49.6 ± 1.23         15.2 ± 0.85          15.9 ± 1.29 ab         41.1 ± 1.12 b        1.53 ± 0.59 ab        10.5 ± 0.82
                     XaAs        18.621.4
                                       ± 1.73
                                           ± 0.92 c 4.4316.3
                                                  b        ± 1.04
                                                               ± 0.85 e 10.106.11
                                                                      b          ± 1.21
                                                                                    ± 1.03 c 51.553.2
                                                                                            e       ± 1.60
                                                                                                        ± 1.89 de 23.129.7
                                                                                                               bc         ± 0.99
                                                                                                                              ± 0.99 d 20.916.6
                                                                                                                                    b           ± ±1.78     c
                                                                                                                                                       0.84 b  38.839.5± ±1.46
                                                                                                                                                                           1.59 ab 1.231.72
                                                                                                                                                                                  a         ± 0.77    ab 23.1 ± 1.03 cd
                                                                                                                                                                                               ± 0.86 b        17.9 ± 1.77
       6                                           e                    d                   b                   cd                   c                      b                     b                    b                1.40 cb
                  As +CaCa       20.525.4
                                       ± 1.38
                                           ± 1.31 c 9.759.54
                                                           ± 0.77
                                                               ± 0.87d 6.744.86 ± 1.02
                                                                                    ± 0.79c 54.752.9
                                                                                             e
                                                                                                     ± 1.38
                                                                                                        ± 1.33 e   30.725.4
                                                                                                                          ± 1.75
                                                                                                                              ± 1.51d    13.617.8
                                                                                                                                                ± ±1.581.42 a
                                                                                                                                                            c
                                                                                                                                                               40.840.6
                                                                                                                                                                      ± ±1.54
                                                                                                                                                                            1.27
                                                                                                                                                                                  a
                                                                                                                                                                                     1.741.74
                                                                                                                                                                                            ± ±0.63
                                                                                                                                                                                                  0.60 b 15.418.8± ±1.74
         6             Xa             18.6 ± 1.73  b      4.43 ± 1.04   b     10.10 ±  1.21        51.5 ± 1.60  bc      23.1 ± 0.99  b        20.9  ±  1.78         38.8  ± 1.46         1.23 ± 0.77  ab       23.1 ± 1.03 d
                  AsAs+ +Xa
                          Ca     21.6 20.5
                                       ± 1.22
                                           ± 1.38 c 9.19 9.75
                                                 cd       ± 1.14
                                                               ± 0.77 d 8.76 6.74
                                                                     cd         ± 1.09
                                                                                    ± 1.02 c 51.1 54.7
                                                                                          d          ± 1.51
                                                                                                         ± 1.38 e 29.330.7
                                                                                                               b          ± 1.72
                                                                                                                              ± 1.75 d 20.613.6
                                                                                                                                    d           ± ±0.921.58 a 39.940.8
                                                                                                                                                            c        ± 1.97      ab
                                                                                                                                                                          ± 1.54 b   0.911.74± ±0.87
                                                                                                                                                                                                  0.63 b
                                                                                                                                                                                                        a  18.815.4± ±1.76
                                                                                                                                                                                                                       1.74 b
                                                                                                                                                                                                                              c

                                             1.22 cd           ± 1.14 ccd 8.378.76  ± 1.09dd 54.751.1    ± 1.51eb 26.429.3    ± 1.72cd 16.120.6             c              1.97 ab                     a                1.76 cc
                  CaAs+ +Xa
                          Xa     22.721.6
                                       ± ±1.46    d 8.519.19
                                                           ± 0.41               ±  1.29              ±  1.87              ±  1.82              ±   6.61
                                                                                                                                                    ± 0.92ab   41.0   ±
                                                                                                                                                                   39.9  ±1.39    b 1.000.91± 0.85
                                                                                                                                                                                               ± 0.87 ab   17.3  ±
                                                                                                                                                                                                               18.8  ±1.97
                     Ca + Xa         22.7 ± 1.46 d        8.51 ± 0.41 c       8.37 ± 1.29 d         54.7 ± 1.87 e        26.4 ± 1.82 c       16.1 ± 6.61 ab         41.0 ± 1.39 b        1.00 ± 0.85 ab        17.3 ± 1.97 c
                MeanMean ±SD
                        ±   SD   20.120.1
                                       ± 1.91
                                           ± 1.91 B 8.408.40
                                                  B        ± 0.32
                                                               ± 0.32 A 6.806.80
                                                                      A         ± 1.29
                                                                                    ± 1.29 A 52.5 52.5
                                                                                          A         ± 2.08
                                                                                                         ± 2.08 A 25.725.7
                                                                                                               A          ± 0.83
                                                                                                                              ± 0.83 B 17.417.4
                                                                                                                                    B          ±±   3.44
                                                                                                                                                      3.44 A
                                                                                                                                                            A   40.240.2
                                                                                                                                                                       ±±  1.93
                                                                                                                                                                              1.93   1.401.40
                                                                                                                                                                                            ± ±0.66
                                                                                                                                                                                                 0.66 A 17.4
                                                                                                                                                                                                       A         ± ±0.47
                                                                                                                                                                                                               17.4    0.47 B
                                                                                                                                                                                                                              B

                                               Values are mean ± standard deviation (SD) of triplicates (na,b,c,d,e,A,B
                                                                                                                    = 3); a,b,c,d,e,A,B are statistical symbols.  a,b
                                                 Values are mean ± standard deviation (SD) of triplicates (n = 3);             are statistical symbols. a,b Mean values
                                               Mean   values  with   difference  superscripts   in the same  column    within       sampling    time  (week)  are
                                                 with difference superscripts in the same column within sampling time (week) are significantly different (p < 0.05);
                                                 A,B Mean values
                                               significantly  different
                                                                   with difference   A,B Mean values with difference superscripts in the same column
                                                                         (p < 0.05);superscripts in the same column are significantly different (p < 0.05) in color
                                                 performance   of animal between   sampling time performance
                                               are significantly different (p < 0.05) in color    (week) by two-way   ANOVA.
                                                                                                                 of animal           Abbreviation:
                                                                                                                                between     samplingAs, time
                                                                                                                                                        Astaxanthin;
                                                                                                                                                             (week) Ca,
                                                 Canthaxanthin;   Xa, Xanthophyll.
                                               by two-way ANOVA. Abbreviation: As, Astaxanthin; Ca, Canthaxanthin; Xa, Xanthophyll.

                                                 Figure
                                               Fig          Colorperformance
                                                    re 2.2.Color  performanceofofbighead
                                                                                  bigheadcatfish
                                                                                          catfishfed
                                                                                                  fedvarious
                                                                                                      variousdietary
                                                                                                              dietarypigments
                                                                                                                     pigments at
                                                                                                                               at different
                                                                                                                                  different times
                                                                                                                                            times of
                                                                                                                                                  of 2,
                                                                                                                                                     2, 4,
                                               4,and
                                                  and66weeks.
                                                        weeks.Astaxanthin
                                                                 Astaxanthin(As),
                                                                             (As),canthaxanthin
                                                                                   canthaxanthin(Ca),
                                                                                                   (Ca),and
                                                                                                         andxanthophyll
                                                                                                             xanthophyll(Xa).
                                                                                                                         (Xa).
Fishes 2022, 7, 37                                                                                                                                                                                                 8 of 16
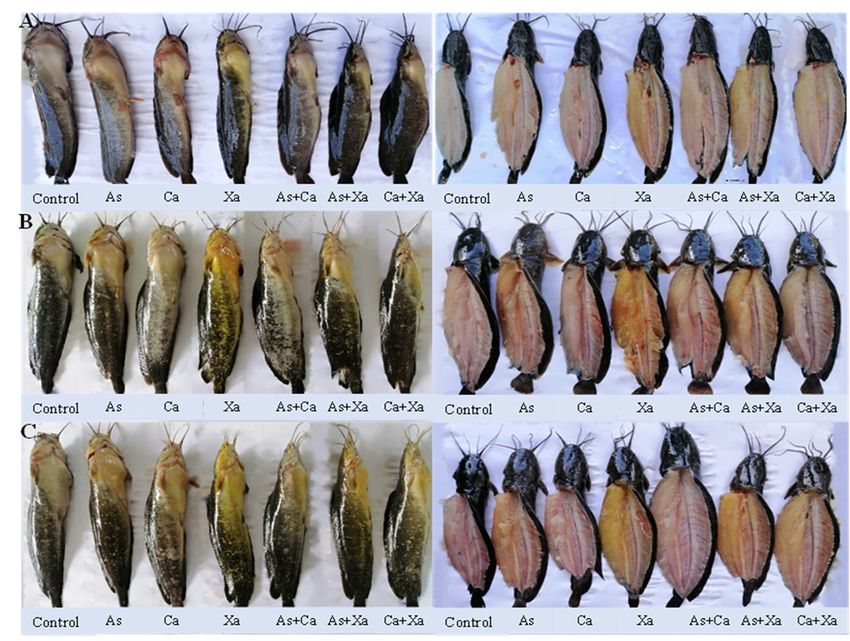
       Fishes 2021, 6, x FOR PEER REVIEW                                                                                                                                                                 8 of 17

                                           Fig re 3. Digital image of body skin and muscle of bighead catfish fed dietary carotenoid pigments
                                            Figure 3. Digital image of body skin and muscle of bighead catfish fed dietary
        Fishes 2021, 6, x FOR PEER REVIEWfor 2 weeks (A), 4 weeks (B), and 6 weeks (C).                             9 of 17
                                                                                                                            carotenoid pigments
                                            for 2 weeks (A), 4 weeks (B), and 6 weeks (C).

                                                          A
                                                                               35                 Initial              Week 2                       Week 4            Week 6
                                               Body skin lightness (L*)

                                                                               30
                                                                                                          d                    c                              c                                d
                                                                                                                           c                                                   c
                                                                               25                             c                             d                                   bc                  c
                                                                                                                                                          b       b
                                                                                                                       b                        c
                                                                               20                                                                                         ab               b
                                                                               15                     b                                b
                                                                                                                   a                                 a                a
                                                                                    a a a a       a                                a                                                   a
                                                                               10
                                                                               5
                                                                               0
                                                                                    Control           AS               CA              XA            AS+CA AS+XA CA+XA
                                                      B                        80
                                                                               70
                                               Abdominal lightness skin (L*)

                                                                                                                       c                                                   c                   b
                                                                               60                     ab b                 b ab             c bc          bbb                  b                   a a
                                                                                    b         b   a ab             a               b                  a               a            a   a
                                                                               50       a a
                                                                                                                                        a
                                                                               40
                                                                               30
                                                                               20
                                                                               10
                                                                                0
                                                                                    Control           AS               CA              XA            AS+CA AS+XA CA+XA

                                                   C                           50
                                                                                                                                                          b                                a
                                                                               45                                          bb                                                                  a a
                                                                                     a a a a      a a a a          b               ab       b ab      a
                                                                                                                                                              ab ab ab
                                                                                                                                                                       ab ab a
                                                                                                                                        a
                                            Muscle lightness (L*)

                                                                               40                                      a
                                                                                                                                                                           a
                                                                               35
                                                                               30
                                                                               25
                                                                               20
                                                                               15
                                                                               10
                                                                                5
                                                                                0
                                                                                    Control           AS             CA      XA     AS+CA AS+XA CA+XA
                                                                                                                  Experimental carotenoid diet

                                           Fig  re 4. Lightness
                                            Figure              for body
                                                      4. Lightness      forskin (A), skin
                                                                             body    abdominal
                                                                                           (A), skin (B), and muscle
                                                                                                 abdominal            (C) ofand
                                                                                                               skin (B),     bighead   catfish(C)
                                                                                                                                   muscle      fedof bighead catfish fed
                                           dietary pigments for 2, 4, and 6 weeks. Astaxanthin (As), ccanthaxanthin (Ca), and xanthophyll (Xa).
                                            dietary
                                           (a,         pigments
                                               b, c) Average  valuesforof 2, 4, anddiets
                                                                          different   6 weeks.     Astaxanthin
                                                                                          at the same              (As),
                                                                                                       sampling time   withccanthaxanthin
                                                                                                                             different letters are(Ca), and xanthophyll
                                           significantly
                                            (Xa). (a, b,different  (p < 0.05).
                                                          c) Average      valuesEachofbar is the mean
                                                                                       different       value
                                                                                                   diets     of three
                                                                                                          at the  same replicates,
                                                                                                                          sampling threetime
                                                                                                                                          fish per
                                                                                                                                               with different letters are
                                           replicate.
                                            significantly different (p < 0.05). Each bar is the mean value of three replicates, three fish per replicate.
                                                Redness values of the abdominal skin of all treatments tended to increase during the
                                           experiment, while this phenomenon did not appear on the body or in muscles tissue
                                           (Figure 5). Both Ca and Ca combination groups showed lower a* values on the abdominal
                                           skin than those of As and Xa groups at the end of the experiment. As to the redness of the
                                           body and abdominal skin, fish fed with carotenoid supplemented diets were redder than
Fishes 2022, 7, 37                                                                                                                                                               9 of 16

                                       Redness values of the abdominal skin of all treatments tended to increase during
                                  the experiment, while this phenomenon did not appear on the body or in muscles tissue
                                  (Figure 5). Both Ca and Ca combination groups showed lower a* values on the abdominal
Fishes 2021, 6, x FOR PEER REVIEW
                                  skin than those of As and Xa groups at the end of the experiment. As to the redness of the
                                                                                                                   10 of 17
                                  body and abdominal skin, fish fed with carotenoid supplemented diets were redder than
                                  those of the control group.

                                       A                       20                        Initial             Week 2                Week 4              Week 6
                                                                                             c   c
                                 Body skin redess (a*)

                                                               15
                                                                                                                                        c
                                                                                                         b
                                                                                                                                            bb
                                                               10                                            bb                                        bb b           b
                                                                                         b                                                                                bb

                                                                                                     a                     a        a                             a
                                                                                     a                             a   a       a                   a
                                                                5    b
                                                                         aaa

                                                                0
                                                                     Control             AS              CA            XA          AS+CA AS+XA CA+XA
                                            B                  40
                                                               35                                                                           bb
                                  Abdominal rednes skin (a*)

                                                                                             bb                                                         bb
                                                               30                                            bb                                                               c
                                                                                                                                                                          c
                                                               25                                                         b
                                                                                     aa              aa                bb           aa
                                                                                                                   a                               aa             b
                                                               20        a
                                                                     a        aa                                                                                      a
                                                               15
                                                               10
                                                                5
                                                                0
                                                                     Control             AS              CA            XA          AS+CA AS+XA CA+XA
                                 C                             4.0
                                                               3.5
                                Muscle redness (a*)

                                                               3.0
                                                               2.5
                                                                                                     a                                                    b
                                                               2.0       a                                   a a                    a   a
                                                                                          a                            aa                        a ab
                                                                             a
                                                                               a a   a aa                a                                  a
                                                                                                                                                     ab                   a
                                                                                                                   a                                              a
                                                               1.5                                                             a                                           aa
                                                               1.0                                                                                            a

                                                               0.5
                                                               0.0
                                                                     Control             AS              CA            XA           AS+CA AS+XA CA+XA
                                                                                                 Experimental carotenoid diet
                              Fig  re 5.5.Redness
                                Figure     Rednessfor
                                                    for body skin
                                                               skin (A),
                                                                     (A),abdominal
                                                                          abdominalskin
                                                                                      skin (B),
                                                                                         (B), andand muscle
                                                                                                  muscle      (C)bighead
                                                                                                          (C) of   of bighead    catfish
                                                                                                                           catfish        fed
                                                                                                                                   fed dietary
                              dietary  pigments   for 2, 4, and 6 weeks.  Astaxanthin  (As),  canthaxanthin  (Ca),  and  xanthophyll
                                pigments for 2, 4, and 6 weeks. Astaxanthin (As), canthaxanthin (Ca), and xanthophyll (Xa). (a, b, c)   (Xa).
                              (a,Average
                                  b, c) Average
                                          values ofvalues   of different
                                                      different           diets
                                                                diets at the    at the
                                                                             same      same sampling
                                                                                    sampling   time with time  withletters
                                                                                                         different    different  letters are
                                                                                                                            are significantly
                              significantly different (p < 0.05). Each bar is the mean value of three replicates, three fish per
                                different (p < 0.05). Each bar is the mean value of three replicates, three fish per replicate.
                              replicate.
                                     The yellowness (b*) values of fish fed with carotenoid pigments supplemented diets
                                   The yellowness
                                tended               (b*) values
                                        to increase over          of fish fedinwith
                                                          the experiment         bodycarotenoid    pigments
                                                                                         skin, abdominal      supplemented
                                                                                                           skin,              diets
                                                                                                                 and muscle tissues
                              tended  to6).
                                (Figure  increase  over thebody
                                             The highest     experiment     in body skin,
                                                                  skin yellowness            abdominal
                                                                                        of the  Xa groupskin,
                                                                                                           was and  muscle tissues
                                                                                                                significantly higher
                              (Figure 6). The
                                than those  of highest  body
                                               the control    skin (p
                                                           group   yellowness
                                                                      < 0.05) at of2, the Xa group
                                                                                      4, and 6 weekswas  significantly
                                                                                                      (Figure          higher than
                                                                                                               6A). However,   the b*
                              those  of the control  group   (p < 0.05)  at  2, 4, and    6 weeks  (Figure  6A).  However,
                                values of the abdominal skin of fish fed with the control treatment showed no significant    the b*
                              values of the abdominal skin of fish fed with the control treatment showed no significant
                              difference (p > 0.05) to those of As, Ca, and/or the combined groups (Figure 6B). In contrast
                              to As and As combination groups, Xa and Ca + Xa groups exhibited significantly higher
                              b* values in muscle tissue. Fish fed with the Xa group reached the highest b* values in
Fishes 2022, 7, 37                                                                                                                                                                               10 of 16

                                  difference (p > 0.05) to those of As, Ca, and/or the combined groups (Figure 6B). In contrast
                                  to As and As combination groups, Xa and Ca + Xa groups exhibited significantly higher
Fishes 2021, 6, x FOR PEER REVIEW                                                                                       11 of 17
                                  b* values in muscle tissue. Fish fed with the Xa group reached the highest b* values        in
                                  muscles at 4 weeks, significantly (p < 0.05) higher compared to other groups (Figure 6C).

                                    A                            14
                                 Body skin yellowness (b*)
                                                                 12
                                                                                 Initial             Week 2                     Week 4                       Week 6
                                                                                                                           b
                                                                                                                       b        b
                                                                 10                                                                                                  b
                                                                                                                                                             bb                          b
                                                                                                                                                                                     b
                                                                  8                                                                     bbb                                      b
                                                                                             b
                                                                                         b       b
                                                                  6                                  a a a a
                                                                                                                   a                a
                                                                  4            a a   a                                                                                       a
                                                                          a                                                                              a
                                                                  2   a

                                                                  0
                                                                      Control            AS           CA               XA           AS+CA AS+XA CA+XA
                                  B                              25
                                Abdominal skin yellowness (b*)

                                                                                                                                c
                                                                                                                         bc                                              c
                                                                                                                                                                     c
                                                                 20                  b                   a a a         ab            b
                                                                                                                                                                             a aa
                                                                      a                                            a
                                                                           a a
                                                                               a         b       b   a                                   ab ab           ab                                  a
                                                                                             a                                               a
                                                                 15

                                                                 10

                                                                 5

                                                                 0
                                                                      Control            AS              CA            XA           AS+CA AS+XA CA+XA
                                         C                       30
                                                                                                                            c
                                  Muscle yellowness (b*)

                                                                 25                                                             c
                                                                                                                                                                         c               c bc
                                                                 20                                          c c                                                     c
                                                                                             bb          b              b                            b
                                                                                                                                            b                    b                   b
                                                                                         b                                                      ab
                                                                 15                                                                     a                                        a
                                                                                     a               a             a                                         a
                                                                      ab       bb
                                                                 10        a

                                                                  5

                                                                  0
                                                                      Control            AS              CA            XA           AS+CA AS+XA CA+XA
                                                                                                     Experimental carotenoid diet

                               Fig  re 6.
                               Figure   6. Yellowness
                                           Yellowness (b*)
                                                       (b*) value
                                                            value for
                                                                   for body
                                                                       body skin
                                                                              skin (A),
                                                                                   (A), abdominal
                                                                                        abdominal skin
                                                                                                   skin (B),
                                                                                                        (B), and
                                                                                                             and muscle
                                                                                                                  muscle (C)
                                                                                                                         (C) of
                                                                                                                             of bighead
                                                                                                                                 bighead
                               catfish
                               catfish fed
                                        fed dietary
                                             dietary pigments
                                                     pigments for    2, 4,
                                                                for 2,  4, and
                                                                           and 66 weeks.
                                                                                   weeks. Astaxanthin
                                                                                            Astaxanthin (As),
                                                                                                         (As), canthaxanthin
                                                                                                               canthaxanthin (Ca),
                                                                                                                               (Ca), and
                                                                                                                                     and
                               xanthophyll (Xa). (a, b, c) Average values of different diets at the same sampling time with different
                               xanthophyll (Xa). (a, b, c) Average values of different diets at the same sampling time with different
                               letters are significantly different (p < 0.05). Each bar is the mean value of three replicates, three fish
                               letters are significantly different (p < 0.05). Each bar is the mean value of three replicates, three fish
                               per replicate.
                               per replicate.
                                     The sensory evaluation and accumulated carotenoids in the muscle of fish fed with
                                     The sensory evaluation and accumulated carotenoids in the muscle of fish fed with the
                               the  various  pigments
                               various pigments     dietsdiets are presented
                                                           are presented        in Table
                                                                          in Table        4. Sensory
                                                                                    4. Sensory          evaluation
                                                                                                  evaluation   showedshowed   thatbody
                                                                                                                        that the    the
                               body   skinmuscle
                               skin and    and muscle
                                                  color ofcolor of the bighead
                                                            the bighead           catfish
                                                                         catfish fed       fed was
                                                                                      Xa diet  Xa diet
                                                                                                     the was
                                                                                                          mostthe  most appreciated,
                                                                                                               appreciated,  followed
                               followed   by  the combination     of As + Xa   pigments.    Statistical  analysis
                               by the combination of As + Xa pigments. Statistical analysis showed that there     showed    that was
                                                                                                                                  therea
                               was   a significant  (p <  0.05)  color change    of fish  fed  the  Xa   diet compared
                               significant (p < 0.05) color change of fish fed the Xa diet compared with other pigments    with   other
                               pigments    diets. Similarly,
                               diets. Similarly,  accumulated accumulated
                                                                  carotenoidcarotenoid
                                                                               levels in thelevels in the
                                                                                              muscle       muscle
                                                                                                        (16.89      (16.89
                                                                                                                mg/100   g) mg/100   g)
                                                                                                                            of fish fed
                               of fish fed the  Xa diet were   significantly  (p < 0.05) higher   compared
                               the Xa diet were significantly (p < 0.05) higher compared to other treatments.  to other treatments.
Fishes 2022, 7, 37                                                                                                                                                           11 of 16

                                            Table 4. Sensory evaluation and accumulated carotenoids in the muscle of fish fed various pigments
                                            diets after 6 weeks.

                                                                                               Sensory Evaluation                                      Accumulated
                                                      Treatment
                                                                                      Body Skin                         Muscle                     Carotenoid (mg/100 g)
                                                                                                   e               6.00 ± 0.00 e
                                                       Control                        6.00 ± 0.00                                                         1.47 ± 0.27 h
                                                         As                           7.13 ± 0.42 d                7.33 ± 0.59 d                           4.75 ± 0.13 e
                                                         Ca                           7.11 ± 0.32 d                7.16 ± 0.35 d                          5.98 ± 0.23 d
                                                         Xa                           8.94 ± 0.24 a                8.89 ± 0.14 a                          16.89 ± 0.60 a
                                                       As + Ca                        7.28 ± 0.46 d                7.22 ± 0.43 d                           8.70 ± 0.48 c
                                                       As + Xa                        8.39 ± 0.61 b                8.39 ± 0.61 b                          12.67 ± 0.11 b
                                                       Ca + Xa                        7.72 ± 0.67 c                7.78 ± 0.73 c                           3.91 ± 0.41 f
                                            Values are means of three replicate groups’ ± S.D; within a column, values with the same letters are not significantly
                                            different (p > 0.05). Abbreviation: As, Astaxanthin; Ca, Canthaxanthin; Xa, Xanthophyll.

                                            3.2. Effect of Dietary Xanthophyll on Growth and Color Performance of Bighead Catfish
                                            3.2.1. Growth Performance and Survival
                                                  The growth performance and survival rates of bighead catfish fed different rates of Xa
                                            diet is summarized in Table 5. Statistical analysis showed that there was no difference in
                                            the SGR or SR of fish fed various Xa levels (p > 0.05). However, feed utilization of the Xa
                                            diet at 75 mg/kg of feed was more efficient than others.

                                            Table 5. Growth performance, initial weight (Wi ), final weight (Wf ), specific growth rate (SGR),
                                            survival rate (SR), feed conversion ratio (FCR) of bighead catfish fed various xanthophyll diets for
                                            4 weeks.

                                                 Treatment               Wi (g/fish)           Wf (g/con)        SGR (%/day)                     SR (%)                FCR
                                                    Control              39.5 ± 0.44          49.9 ± 1.76          0.46 ± 0.08              92.2 ± 1.92             1.38 ± 0.22
                                                    25 mgXa              39.1 ± 0.63          51.8 ± 1.96          0.40 ± 0.12              93.3 ± 5.77             1.38 ± 0.18
                                                    50 mgXa              39.3 ± 1.21          50.3 ± 1.43          0.43 ± 0.05              94.4 ± 1.93             1.34 ± 0.36
                                                    75 mgXa              39.6 ± 0.65          50.8 ± 1.36          0.48 ± 0.09              92.2 ± 1.92             1.05 ± 0.45
                                                   100 mgXa              39.0 ± 0.45          50.8 ± 1.81          0.49 ± 0.16              92.2 ± 3.85             1.11 ± 0.75
                                            Values are means of three replicate ± S.D; within a column, values are not significantly different (p > 0.05).
                                            Abbreviation: As, Astaxanthin; Ca, Canthaxanthin; Xa, Xanthophyll.

                                            3.2.2. Color Performance
                                                 The color performance of bighead catfish fed various supplementation levels of Xa
                                            are shown in Table 6 and Figure 7. The L* value of the body was statistically significant
                                            (p < 0.05) compared to the control treatment after 4 weeks. In contrast, the a* value of
                                            the pigment supplemented treatments was reduced. Furthermore, the b* values for fish
                                            fed the diets supplemented with 75 mg (b*: 10.6) and 100 mg (b*: 11.3) xanthophyll were
                                            significantly higher compared with (p < 0.05) other treatments.

                                            Table 6. L*, a*, b* for body skin, abdominal skin, and muscle of bighead catfish fed dietary Xa for
                                            4 weeks.

                                       Body Skin                                             Abdominal Skin                                            Muscle
    Treatment
                          L*               a*                 b*                 L*                a*              b*                 L*                  a*                b*

     Control         50.0 ± 1.56 d    −0.1 ± 0.52 a      2.0 ± 0.58 d       73.1 ± 1.21 a     −1.6 ± 0.37 a   4.4 ± 1.60 d       41.4 ± 1.29 a       1.3 ± 0.36 a      12.9 ± 1.03 d
    25 mgXa          52.8 ± 1.67 bc   −0.6 ± 0.18 a       5.3 ± 1.05 c      70.8 ± 1.55 b     −3.0 ± 0.62 b   11.4 ± 1.02 c      42.3 ± 1.61 a       1.2 ± 1.10 a      17.1 ± 1.42 c
    50 mgXa          51.3 ± 1.34 cd   −1.9 ± 0.76 b      8.0 ± 0.85 b       72.6 ± 1.57 a     −3.2 ± 0.73 b   12.9 ± 1.90 b      41.7 ± 1.45 a       1.1 ± 0.48 a      19.7 ± 1.68 b
    75 mgXa           55.2 ± 1.51 a   −3.0 ± 0.79 c      10.6 ± 0.93 a      70.7 ± 1.75 b     −3.7 ± 0.62 b   22.7 ± 1.56 a      42.7 ± 1.70 a       1.3 ± 0.69 a      20.9 ± 0.64 b
    100 mgXa         53.4 ± 1.95 b    −3.2 ± 1.01 c      11.3 ± 1.89 a      69.9 ± 0.58 b     −3.4 ± 1.95 b   21.4 ± 1.64 a      41.3 ± 1.44 a       1.1 ± 0.34 a      23.1 ± 1.70 a

                                            Values are means of three replicate ± S.D; within a column, values with the same letters are not significantly
                                            different (p > 0.05). Abbreviation: As, Astaxanthin; Ca, Canthaxanthin; Xa, Xanthophyll.
Fishes 2021, 6, x FOR PEER REVIEW                                                                                                            13 of 17

                                    Values are means of three replicate ± S.D; within a column, values with the same letters are not
 Fishes 2022, 7, 37                                                                                                                12 of 16
                                    significantly different (p > 0.05). Abbreviation: As, Astaxanthin; Ca, Canthaxanthin; Xa,
                                    Xanthophyll.

                                                                                                                                                  .
                                      Figure 7. Various colour performance of bighead catfish fed various xanthophyll diets for 4 weeks.
                                    Fig re 7. Various colour performance of bighead catfish fed various xanthophyll diets for 4 weeks.
                                           Sensory evaluation and accumulated carotenoids in the muscle tissue of fish fed
                                         Sensory
                                      various      evaluation
                                               levels           and accumulated
                                                       of xanthophyll     in the dietcarotenoids
                                                                                        are presentedin the   muscle
                                                                                                         in Table    tissue
                                                                                                                   7 and     of fish
                                                                                                                          Figure   8. fed
                                                                                                                                       The
                                    various  levels of xanthophyll   in  the diet are  presented  in Table  7 and Figure 8. The
                                      highest score was also observed for the body skin and muscle color of those fish fed diets highest
                                    score  was also with
                                      supplemented     observed
                                                            75 mgfor   the body skin
                                                                   xanthophyll,           and by
                                                                                    followed   muscle
                                                                                                 the 100color
                                                                                                          mg/kgof those  fish Carotenoid
                                                                                                                  treatment.   fed diets
                                    supplemented     with 75 mg   xanthophyll,    followed   by the  100 mg/kg  treatment.  Carotenoid
                                      accumulation in the muscle of bighead catfish fed a diet containing 75 mg/kg of feed was
                                    accumulation
                                      significantly in the muscle
                                                    higher         of bighead
                                                            (p < 0.05)  than othercatfish fed a diet containing 75 mg/kg of feed was
                                                                                     treatments.
                                    significantly higher (p < 0.05) than other treatments.
                                     Table 7. Sensory evaluation and accumulated carotenoid in muscle of fish fed of bighead catfish fed
                                    Table 7. Sensory
                                     Xa diets         evaluation and accumulated carotenoid in muscle of fish fed of bighead catfish fed
                                               for 4 weeks.
                                    Xa diets for 4 weeks.
                                                                              Sensory Evaluation                              Accumulated
                                           Treatment                       Sensory Eval ation                    Acc m lated         Carotenoid
                                           Treatment                 Body Skin                     Muscle                Carotenoid (mg/100 g)
                                                                     Body Skin                  M scle                     (mg/100 g)
                                                                                 d                    ± 0.00 e                           d d
                                             Control
                                             Control                 6.52±±0.51
                                                                   6.52      0.51 d             6.00
                                                                                             6.00  ± 0.00  e              1.301.30  ± 0.29
                                                                                                                                 ± 0.29
                                                                                 d                           d                       ± 0.42  c
                                            25 mg
                                            25 mgXaXa                6.48±±0.51
                                                                   6.48      0.51c d            6.52
                                                                                             6.52     ± 0.51
                                                                                                   ± 0.51  d
                                                                                                             c
                                                                                                                           2.682.68
                                                                                                                                 ± 0.42  c
                                                                                                                                             b
                                            50 mg Xa                6.96 ± 0.76 c               7.11 ± 0.64                    6.82 ± 0.47
                                            50 mg Xa                 6.96 ± 0.76             7.11 ± 0.64 c a              6.82 ± 0.47 b a
                                            75 mg Xa               8.52 ± 0.51 a                8.56 ± 0.51                   16.93 ± 0.69
                                            75 mg
                                           100     Xa
                                                mg Xa                8.52±±0.55
                                                                   8.00      0.51b a         8.56  ± 0.51
                                                                                                8.04
                                                                                                           a
                                                                                                      ± 0.65 b            16.93   ± 0.69
                                                                                                                              16.63
                                                                                                                                          a
                                                                                                                                     ± 0.51 a
                                     Values100  mg Xaof three replicate
                                                                     8.00  ± 0.55            8.04  ± 0.65
                                                                                                      values with the same16.63
                                                                                                                           letters±are
                                                                                                                                    0.51
                                                                                   b                       b                              a
                                            are means                   groups’ ± S.D.; within a row,                                  not significantly
                                      different
                                    Values   are(pmeans
                                                  > 0.05).of
                                                           Abbreviation: As, astaxanthin;
                                                             three replicate              Ca, canthaxanthin;
                                                                             groups’ ± S.D.;   within a row,Xa, xanthophyll.
                                                                                                             values  with the same letters are
                                    not significantly different (p > 0.05). Abbreviation: As, astaxanthin; Ca, canthaxanthin; Xa,
                                    xanthophyll.
Fishes  2021,7,6,37
 Fishes2022,      x FOR PEER REVIEW                                                                                                            13
                                                                                                                                               14of
                                                                                                                                                  of16
                                                                                                                                                    17

                                      Fig re8.
                                      Figure 8. Digital
                                                Digital image
                                                         image of
                                                               of body
                                                                  body skin
                                                                        skin(A)
                                                                             (A)and
                                                                                andmuscle
                                                                                    muscle(B)
                                                                                           (B)of
                                                                                              ofbighead
                                                                                                 bigheadcatfish
                                                                                                         catfishfed
                                                                                                                 fedXa
                                                                                                                    Xadiets
                                                                                                                       dietsfor
                                                                                                                             for44weeks.
                                                                                                                                  weeks.

                                      4.
                                       4. Discussion
                                          Disc ssion
                                            Besides
                                             Besides color
                                                       color enhancement,
                                                              enhancement, carotenoids
                                                                                  carotenoids have
                                                                                                 have also
                                                                                                       also been
                                                                                                             been found
                                                                                                                    found to  to have
                                                                                                                                 have various
                                                                                                                                        various other
                                                                                                                                                  other
                                      beneficial   functions    in aquatic    species,  including    the improvement
                                       beneficial functions in aquatic species, including the improvement of broodstock       of broodstock    perfor-
                                      mance    [30,31], improved
                                       performance                   disease resistance
                                                         [30,31], improved          disease[32,33], and improved
                                                                                               resistance    [32,33],growth
                                                                                                                          and performance
                                                                                                                                 improved growth[34,35].
                                      In
                                       performance [34,35]. In the present study, the growth performance and survival ratenot
                                          the present   study,  the  growth     performance     and  survival   rate  of  bighead    catfish were    of
                                      significantly
                                       bighead catfish affected
                                                             werebynotthe dietary    supplementation
                                                                            significantly    affected byofthe carotenoid
                                                                                                                   dietary pigments.        Similarly,
                                                                                                                               supplementation       of
                                      previous
                                       carotenoid studies  have also
                                                     pigments.          found that
                                                                   Similarly,        supplementing
                                                                                  previous              carotenoids
                                                                                              studies have              into diet
                                                                                                               also found       thatdid not affect the
                                                                                                                                      supplementing
                                      growth and survival of Atlantic salmon [36,37], rainbow trout [33], gilthead seabream [38],
                                       carotenoids into diet did not affect the growth and survival of Atlantic salmon [36,37],
                                      and flame-red dwarf gourami Colisa lalia [20]. The same study was also conducted on
                                       rainbow trout [33], gilthead seabream [38], and flame-red dwarf gourami Colisa lalia [20].
                                      yellow cichlid Labidochromis caeruleus. The growth performance and survival of fish was
                                       The same study was also conducted on yellow cichlid Labidochromis caeruleus. The growth
                                      not affected by the xanthophyll diet, and adding xanthophyll to feed may improve the feed
                                       performance and survival of fish was not affected by the xanthophyll diet, and adding
                                      coefficient [39]. Moreover, the results of the present study show that the efficiency of feed
                                       xanthophyll to feed may improve the feed coefficient [39]. Moreover, the results of the
                                      utilization in fish fed dietary pigments was improved.
                                       present study show that the efficiency of feed utilization in fish fed dietary pigments was
                                            The color performance of fish fed dietary carotenoid supplements varies depending on
                                       improved.
                                      the types and feeding period of the dietary pigmentation [7]. In the present study, statistical
                                             The color performance of fish fed dietary carotenoid supplements varies depending
                                      analysis by two-way ANOVA showed a clear significant difference in color performance of
                                       on the types and feeding period of the dietary pigmentation [7]. In the present study,
                                      bighead catfish feeding various types and feeding periods of dietary pigmentation (Table 3).
                                       statistical
                                      Among         analysis
                                                diets, bighead bycatfish
                                                                   two-way       ANOVA
                                                                            displayed        showed
                                                                                       a golden        a clear
                                                                                                  yellow         significant
                                                                                                           appearance       afterdifference
                                                                                                                                  4 weeks of in   color
                                                                                                                                              feeding
                                       performance
                                      with              of bighead
                                             a xanthophyll     diet and catfish   feeding
                                                                            differed        various compared
                                                                                      significantly   types and to   feeding
                                                                                                                         fish fedperiods    of dietary
                                                                                                                                    diets containing
                                      other carotenoid pigments. The color lasted for 6 weeks (Figures 2 and 3). Anotheryellow
                                       pigmentation       (Table   3).   Among      diets,   bighead    catfish    displayed       a  golden     study
                                       appearance
                                      showed          after 4 astaxanthin
                                                 that adding   weeks of feedingpigment with   a xanthophyll
                                                                                          to sea bream feed took diet8and
                                                                                                                        weeks differed   significantly
                                                                                                                                 [38], whilst  adding
                                       compared to
                                      astaxanthin       fish fedtodiets
                                                     pigment               containing
                                                                    flounder    feed or other
                                                                                         adding carotenoid
                                                                                                  carotenoids pigments.
                                                                                                                 to hybridThe      color
                                                                                                                               catfish    lasted
                                                                                                                                       feed       for 6
                                                                                                                                             required
                                       weeks    (Figures   2 and   3).  Another    study   showed    that  adding    astaxanthin
                                      12 weeks [40]. The difference may be due to feed intake and its utilization by fish in the      pigment    to sea
                                       bream feed
                                      present    studytook   8 weeks
                                                         compared      to [38],  whilst
                                                                           previous      addingInastaxanthin
                                                                                      studies.      agreement withpigment       to flounder
                                                                                                                           the previous        feedthe
                                                                                                                                           study,    or
                                       adding    carotenoids    to hybrid     catfish feed   required   12  weeks    [40].
                                      ability to metabolize, absorb, and accumulate the pigmentation in the skin and muscle  The  difference   may   be
                                       due tovaries
                                      tissue    feed intake
                                                      accordingandtoitsthe
                                                                         utilization   by fish in the present study compared to previous
                                                                             species [7].
                                       studies. In agreement with the previous study, the ability to metabolize, absorb, and
Fishes 2022, 7, 37                                                                                             14 of 16

                           A high a* value in the presence of astaxanthin was found in the present study. Bighead
                     catfish is a species characterized by its yellow color, and by adding astaxanthin in this
                     experiment, it lost its natural color because of increased redness. Similar results were
                     found for yellow croakers when combining xanthophyll and astaxanthin [12]. When
                     astaxanthin was added, the red color appeared, and the xanthophyll supplement appeared
                     more yellow. The b* value was yellow; therefore, it had a high value in the treatments with
                     Xa supplementation. Therefore, for improving the appearance and marketability of catfish,
                     a supplement of xanthophyll is suggested because it gives the skin and muscles a yellow
                     color compared to the addition of other carotenoids.
                           The degree of pigmentation in the muscle tissue of aquatic animals when adding
                     pigmentation to feed depends on the species [7,12]. In the present study, the number of
                     carotenoids accumulated in muscle varied with the type of carotenoid supplied (Table 4).
                     The carotenoid content was lowest in the control group, while higher muscle and carotenoid
                     accumulation were found in treatments supplemented with xanthophyll diet. Similar
                     results were also found in other fish species [8,34,35,41], and additional synthetic pigments
                     and/or natural carotenoids sources also enhanced carotenoid levels in muscle of European
                     seabass [17] and Spinefoot rabbitfish [18]. Other studies reported that fish were better able
                     to accumulate yellow pigments (lutein and zeaxanthin) than red pigments (canthaxanthin
                     and astaxanthin) [14,42,43]. The addition of astaxanthin pigment (120 mg/kg feed) to
                     the pompano after 30 days showed the clearest color and highest accumulation in fish
                     muscle tissue.
                           In addition, the sensory evaluation also provided clear support for the yellowness
                     of bighead catfish fed the xanthophyll diet (Tables 4 and 7). In other treatments, where
                     astaxanthin or canthaxanthin (orange) alone were added to the diet, fish had a dark coloring,
                     but the yellow color was not clearly shown. The combination of the two pigments As +
                     Xa also gave a golden yellow color with good sensory scores but not as high as Xa alone.
                     Similarly, a combination of astaxanthin and xanthophyll at the ratio of 1:1 also showed an
                     improvement in large golden-yellow croakers [44].
                           The amount of pigment added to the feed affects the color and level of carotenoid
                     accumulation of fish. At 25 and 50 mg Xa/kg of feed, the color of the fish did not meet
                     requirements, as seen by the low sensory score and accumulated carotenoids in the flesh.
                     The 75 mg Xa/kg application showed the best results in bighead catfish. A similar conclu-
                     sion on the use and rate of Xa (75 mg) to achieve the best color was reached for the golden
                     croaker [12].

                     5. Conclusions
                          This study examined appropriate carotenoid pigments, enhancing the color perfor-
                     mance of bighead catfish. Dietary xanthophyll showed the best result for color performance
                     after 4 weeks. Adding xanthophyll pigment at a level of 75 mg/kg of feed over a feeding
                     period of 4 weeks duration is recommended for the achievement of golden-yellow skin
                     and muscle tissue of bighead catfish C. macrocephalus, matching market demands and
                     consumer’s appreciation.

                     Author Contributions: Conceptualization, T.T.T.H. and P.M.D.; methodology investigation, T.T.T.H.
                     and P.M.D.; conducting experiment and data collection, T.V.L., T.L.C.T. and T.M.P.; data analysis,
                     writing and editing, T.T.T.H., P.M.D., H.T.N. and P.T.L. All authors have read and agreed to the
                     published version of the manuscript.
                     Funding: This study was funded by the Can Tho University Improvement Project VN14-P6, sup-
                     ported by a Japanese ODA loan.
                     Institutional Review Board Statement: The animal study protocol was carried out in accordance
                     with national guidelines on the protection and experimental animal welfare in Vietnam, Law of
                     Animal Health, 2015 (Report number: VM5068) and Institutional scientific committee of CAN THO
                     UNIVERSITY (Decision No.: 23/QÐ-PMU.VN14-P6).
You can also read