2019 ANNUAL UPDATE BERKSHIRE COUNTY CEDS 2017-2022 - Berkshire Regional ...
←
→
Page content transcription
If your browser does not render page correctly, please read the page content below
Berkshire Regional Planning Commission

2019 ANNUAL UPDATE
BERKSHIRE COUNTY CEDS 2017-2022

        Submitted to the U.S. Economic Development Administration on December 2, 2019.
Table of Contents
Introduction…………………………………………………………………………………………………………………………………………. 3
Section 1. Performance Measures…………………………………………………………………………………………………….….. 4
Section 2. Existing Regional Conditions & Trends Report…………………………………………………………………….… 5
Section 3. Goals & Objectives Report…………………………………………………………………………………………………… 17
Section 4. Priority Projects Report……………………………………………………………………………………………………….. 22
Appendices
Appendix “A” - 24 Month Local Area Unemployment Statistics
Appendix “B”- Most Recently Available Data on Per Capita Income from ACS
Appendix “C” - Economic Distress Criteria Map
Appendix “D” - 2019 Annual Priority Project Updates
Appendix “E” – Regional Investment Database
Appendix “F” - 2019 CEDS Committee and Berkshire Regional Planning Commission Rosters
Berkshire Regional Planning Commission Staff
Thomas Matuszko, Executive Director
Laura Brennan, Senior Planner – Community & Economic Development
Mark Maloy, GIS/Data Coordinator
Alexander Valentini, Economic Development Intern
Other Participating Organizations
This Comprehensive Economic Development Strategy for Berkshire County could not have been
accomplished without the willing and active participation of communities, individuals, and
organizations, as well as the representatives at the United States Economic Development
Administration, throughout the process.
Funding was provided for this planning effort by the Massachusetts Department of Housing and
Community Development through the District Local Technical Assistance Program, and the Berkshire
Regional Planning Commission.
2
2019 ANNUAL UPDATE BERKSHIRE COUNTY CEDS 2017-2022Introduction
The Berkshire Regional Planning Commission (BRPC) is the designated regional planning agency for the
thirty (30) towns and two (2) cities in Berkshire County, Massachusetts. In 2017, BRPC staff under the
direction and guidance of an advisory committee (CEDS Committee) developed a comprehensive
economic development strategy for the Berkshire Region (2017-2022 Berkshire CEDS).
The 2017-2022 Berkshire CEDS analyzes regional demographics, infrastructure, economic sectors, and
economic development efforts. It also discusses Strengths, Weaknesses, Opportunities and Threats for
the region (SWOT analysis), and identifies economic development goals and objectives, priority projects
deemed vital to the region, and performance measures by which to gauge implementation of the 2017-
2022 CEDS. In short, it serves as a guide for establishing, implementing and tracking regional economic
goals, objectives and priorities.
Economic Development Administration (EDA) regulations (13 CFR 303.6 (C)) require Planning
Organizations to submit an updated CEDS performance report on an annual basis. The CEDS Committee
is pleased to submit its 2019 Annual Performance Report (Report) to the EDA.
This report discusses existing regional conditions and trends, provides updates on the region’s progress
towards reaching its goals and objectives and provides information relevant to the performance
measures set forth in the 2017-2022 Berkshire CEDS. The report also includes updates for the economic
development projects listed on the Priority Project List. Significant progress has been made toward a
number of 2017-2022 CEDS Goals, as evidenced by the Representative Activities listed herein. Of
particular note is the newly constructed Regional Investment Database, described in Appendix E, which
will allow economic development partners throughout the region to regularly access reliable
information related to their specific areas of interest or concern.
The 2019 Annual Performance Report was endorsed by the Berkshire CEDS Committee on October 17,
2019 and by the Berkshire Regional Planning Commission on November 21, 2019.
3
2019 ANNUAL UPDATE BERKSHIRE COUNTY CEDS 2017-2022Section 1. Performance Measures
The 2017-2022 Berkshire CEDS includes performance measures to enable the CEDS Committee to track
progress in the region and to assess the effectiveness of 2017-2022 Berkshire CEDS. Throughout this
document, the performance measures identified in the CEDS are applied to track progress made in the
region over the last year.
The performance measures are:
1. Change in total employment for the region
See Section 2, Labor Force & Unemployment
2. Change in median household income and median family income for the region
See Section 2, Median Household Income
3. Change in number of young adults in the labor force
See Section 2, Age Structure of the Labor Force
4. Change in per capita income
See Section 2, Per Capita Income, as well as Appendix B
5. Identify investments in the region, including amount, public or private and industry sector
See Appendix E, Regional Investment Database
6. Identify investments in the region’s transportation network
See Section 3, Goal #3 Representative Activities
7. Identify investments in municipal infrastructure that support economic development
See Appendix E, Regional Investment Database
8. Number of active business incubators, co-working spaces, and maker spaces in the region
See Section 3, Goal #2 Representative Activities
9. Number of households with access to fiber optic cable
See Section 3, Goal #3 Representative Activities
10. Identify instances of regional collaboration on economic development activities
See Section 3, Goal #4 Representative Activities
11. Number of workforce trainings held in identified industry or occupational clusters
See Section 3, Goal #1 and Goal #2 Representative Activities
12. Brief assessment of the region’s economic resilience
See Section 2, Regional Economic Resilience
4
2019 ANNUAL UPDATE BERKSHIRE COUNTY CEDS 2017-2022Section 2. Existing Regional Conditions & Trends
This section includes updated information on median household income, employment statistics,
economic sector information, and a summary of the areas in Berkshire County that meet EDA’s distress
criteria.
Economic Characteristics
Labor Force & Unemployment
The labor force in Berkshire County increased from 65,413 to 66,109 persons between 2017 and 2018,
representing an absolute gain of 697 persons and a relative gain of 1.06% over 2017 levels. Regardless of
recent gains, the County’s labor force still remains 3,313 persons, or 4.77%, below 2000 levels of 69,423
persons, and 7,238 persons, or 9.88%, below peak 2006 levels of 73,358 persons. See Figure 1. This
decline may be attributed to the County’s aging and declining population as well as adverse economic
conditions during and following the Great Recession.
Figure 1. Berkshire County Labor Force
Berkshire County Labor Force 2000 - 2018
76,000
74,000
Persons in Labor Force
72,000
70,000
68,000
66,000
64,000
62,000
60,000
Year
Source: U.S. Bureau of Labor Statistics
Between 2017 and 2018, the average unemployment rate for Berkshire County decreased from 4.4% to
4.03%. This represents an absolute decrease of 0.37 percentage points and a relative decrease of 8.3%
from 2017 levels. Unemployment still remains 1.14 percentage points, or 39.48% higher than 2000
levels of 2.89%, but it has been steadily decreasing over the past 8 years and now sits 4.67 percentage
points, or 53.64% lower than peak 2010 levels of 8.7%. See Figure 2. Although Berkshire County has
benefitted from the greater national economic trend in recent years, it should be noted that reductions
5
2019 ANNUAL UPDATE BERKSHIRE COUNTY CEDS 2017-2022in the unemployment rate alone may overstate the health of the regional economy, as such reductions
are partially a function of the decreasing labor force mentioned above.
Figure 2. Annual Unemployment Rate in Berkshire County
Berkshire County Unemployment Rate 2000 - 2018
10.00%
Mena Annual Unemployment Rate
9.00%
8.00%
7.00%
6.00%
5.00%
4.00%
3.00%
2.00%
1.00%
0.00%
Year
Source: U.S. Bureau of Labor Statistics
Median Household Income
The median household income for Berkshire County in 2017 was $55,190. This represents a $2,937, or
5.62%, increase over 2016 levels of $52,253. Median household income in Berkshire County continues to
lag behind both corresponding national and statewide measures, with the median American household
earning $57,652 and the median Massachusetts household earning $74,167 in 2017, 4.47% and 34.3%
higher, respectively. See Figure 3. Median household income is lower for Berkshire County than most
neighboring counties, as well. All or most counties in northwestern Connecticut, Massachusetts’ Pioneer
Valley, and New York’s Capital District are have higher median household incomes. However, Berkshire
County does have a higher median household income than neighboring Bennington and Windham
counties in Vermont. See Figure 4.
Between 2010 and 2017, the average annual growth rate of median household income in Berkshire
County was 1.74%. This was higher than the national rate of 1.51% and lower than the statewide rate of
2.01%. In this respect, Berkshire County also fared better than almost every neighboring county, with
only Greene and Rensselaer counties in New York having higher growth rates over the same period. See
Figure 5.
6
2019 ANNUAL UPDATE BERKSHIRE COUNTY CEDS 2017-2022Figure 3. Median Household Income in United States, Massachusetts, and Berkshire County, 2010 - 2017
Median Household Income 2010 - 2017
$80,000
$75,000
Median Household Income
$70,000
$65,000
$60,000
$55,000
$50,000
$45,000
$40,000
Year
Berkshire County Massachusetts United States
Source: U.S. Census Bureau, American Community Survey, 5-Year Estimates (2013- 2017)
Figure 4. Median Household Income in United States, Massachusetts, Berkshire County, and Neighboring
Counties, 2017
Median Household Income 2017
Litchfield County, CT
Massachusetts
Hartford County, CT
Hampshire County, MA
Rensselaer County, NY
Albany County, NY
Region
Columbia County, NY
United States
Franklin County, MA
Berkshire County
Greene County, NY
Bennington County, VT
Hampden County, MA
Windham County, VT
$- $10,000 $20,000 $30,000 $40,000 $50,000 $60,000 $70,000 $80,000
Median Household Income
Source: U.S. Census Bureau, American Community Survey, 5-Year Estimates (2013- 2017)
7
2019 ANNUAL UPDATE BERKSHIRE COUNTY CEDS 2017-2022Figure 5. United States, Massachusetts, Berkshire County, Neighboring Counties – Median Household Income
Average Annual Growth Rate 2010 - 2017
Median Household Income Annual Growth 2010 - 2017
Rensselaer County, NY
Greene County, NY
Massachusetts
Berkshire County
Hartford County, CT
Albany County, NY
Region
United States
Bennington County, VT
Franklin County, MA
Columbia County, NY
Litchfield County, CT
Hampden County, MA
Hampshire County, MA
Windham County, VT
0.00% 0.50% 1.00% 1.50% 2.00% 2.50%
Average Annual Growth Rate
Source: U.S. Census Bureau, American Community Survey, 5-Year Estimates (2013- 2017)
Per Capita Income
The per capita income for Berkshire County in 2017 was $33,245. This represents a $1,828, or 5.82%,
increase over 2016 levels of $31,417. Per capita income in Berkshire County is $2,068, or 6.63%, higher
than that of the United States, but $6,668, or 16.7%, lower than that of Massachusetts as a whole. See
Figure 6. The per capita income for Berkshire County is higher than that of slightly more than half of the
surrounding counties, with northwestern Connecticut being the only region where all constituent
counties have a higher per capita income than Berkshire County. See Figure 7.
Between 2010 and 2017, the average annual growth rate of per capita income in Berkshire County was
2.33%. This was higher than the national rate of 1.9% and approximately equal to the statewide rate of
2.34%. Per capita income growth in Berkshire County also outpaced almost every neighboring county,
with only Franklin County in Massachusetts and Rensselaer County in New York having higher growth
rates over the same period. See Figure 8.
8
2019 ANNUAL UPDATE BERKSHIRE COUNTY CEDS 2017-2022Figure 6. Per Capita Income 2010 – 2017 in United States, Massachusetts, and Berkshire County
Per Capita Income 2010 - 2017
$41,000
$39,000
$37,000
Per Capita Income
$35,000
$33,000
$31,000
$29,000
$27,000
$25,000
Year
Berkshire County Massachusetts United States
Source: U.S. Census Bureau, American Community Survey, 5-Year Estimates (2013- 2017)
Figure 7. Per Capita Income in United States, Massachusetts, Berkshire County, Neighboring Counties, 2017
Per Capita Income 2017
Litchfield County, CT
Massachusetts
Hartford County, CT
Albany County, NY
Columbia County, NY
Berkshire County
Region
Rensselaer County, NY
Franklin County, MA
Hampshire County, MA
Bennington County, VT
United States
Windham County, VT
Hampden County, MA
Greene County, NY
$- $5,000 $10,000 $15,000 $20,000 $25,000 $30,000 $35,000 $40,000 $45,000
Per Capita Income
Source: U.S. Census Bureau, American Community Survey, 5-Year Estimates (2013- 2017)
9
2019 ANNUAL UPDATE BERKSHIRE COUNTY CEDS 2017-2022Figure 5. United States, Massachusetts, Berkshire County, Neighboring Counties – Per Capita Income Average
Annual Growth Rate 2010 - 2017
Per Capita Income Annual Growth 2010 - 2017
Rensselaer County, NY
Franklin County, MA
Massachusetts
Berkshire County
Greene County, NY
Albany County, NY
Region
Hartford County, CT
United States
Hampden County, MA
Hampshire County, MA
Litchfield County, CT
Bennington County, VT
Windham County, VT
Columbia County, NY
0.00% 0.50% 1.00% 1.50% 2.00% 2.50% 3.00%
Average Annual Growth Rate
Source: U.S. Census Bureau, American Community Survey, 5-Year Estimates (2013- 2017)
Labor Force Age Distribution
The labor force in Berkshire County continues to trend older than that of Massachusetts and the United
States as a whole. In 2017, 15% of the labor force was between the ages of 16 and 24, 33.4% between
25 and 44, 42.8% between 45 and 64, and 8.7% over 65. This compares with corresponding measures of
14.2%, 40.7%, 39.1%, and 6.0% for Massachusetts and 14.3%, 43.0%, 37.5%, and 5.1% for the United
States. Additionally, the Berkshire County workforce has grown older in recent years, with the 25 – 44
and 45 – 64 age cohorts becoming relatively smaller and the over 65 age cohort becoming relatively
larger between 2009 and 2017. It is worth noting, however, that Berkshire County’s 16 – 24 age cohort
became relatively larger between 2009 and 2017, while this age cohort became relatively smaller for
both Massachusetts and the United States as a whole over the same period. See Table 1.
Table 1. United States, Massachusetts, Berkshire County – Labor Force Age Cohorts 2009 - 2017
Berkshire County 2009 2013 2017
16 – 24 14.4% 12.2% 15.0%
25 – 44 35.8% 34.8% 33.4%
45 – 64 44.1% 45.1% 42.8%
Over 65 5.7% 6.9% 8.7%
10
2019 ANNUAL UPDATE BERKSHIRE COUNTY CEDS 2017-2022Massachusetts 2009 2013 2017
16 – 24 14.3% 13.8% 14.2%
25 – 44 43.4% 41.2% 40.7%
45 – 64 38.2% 39.9% 39.1%
Over 65 4.1% 5.1% 6.0%
United States 2009 2013 2017
16 – 24 15.4% 14.5% 14.3%
25 – 44 44.7% 43.1% 43.0%
45 – 64 36.3% 38.0% 37.6%
Over 65 3.7% 4.4% 5.1%
Source: U.S. Census Bureau, American Community Survey, 5-Year Estimates
Key Industry Sectors by Employment and Average Weekly Wages
The Berkshire County industries with the highest average monthly employment for 2018 were
Healthcare and Social Assistance, Retail Trade, Educational Services, and Accommodation and Food
Services. Together, these four industries employed 35,027 people and accounted for more than half of
61,244 people employed across all industries in the region. However, these four industries all had
average weekly wages below the median average weekly wages for all industries of $990 and Retail
Trade and Accommodation and Food Services had some of the lowest average weekly wages in the
County, far below the average weekly wage for all industries of $906. See Table 2. By comparison, the
four industries with the highest average weekly wages in 2018 were Utilities, Finance and Insurance,
Professional and Technical Services, and Manufacturing, with average weekly wages ranging from
$1,854 to $1,502, respectively. Together these industries employed 9,050 people. See Table 3.
Table 2. Top Industries by Average Monthly Employment in Berkshire County in 2018
Top Industries Average Average Rank in
Monthly Weekly Average
(Average Monthly Employment)
Employment Wage Weekly Wage
NAICS 62 Healthcare and Social Assistance 12,909 $954 12/20
NAICS 44-45 Retail Trade 7,614 $583 17/20
NAICS 61 Educational Services 7,422 $988 11/20
NAICS 72 Accommodation and Food Services 7,082 $430 20/20
Source: U.S. Bureau of Labor Statistics, Quarterly Census of Employment and Wages
11
2019 ANNUAL UPDATE BERKSHIRE COUNTY CEDS 2017-2022Table 3. Top Industries by Average Weekly Wages in Berkshire County in 2018
Top Industries (Average Weekly Wages) Average Monthly Average Weekly
Employment Wage
NAICS 22 Utilities 285 $1,854
NAICS 52 Finance and Insurance 1,815 $1,600
NAICS 54 Professional and Technical Services 2,993 $1,532
NAICS 31-33 Manufacturing 4,017 $1,502
Source: U.S. Bureau of Labor Statistics, Quarterly Census of Employment and Wages
Average Annual Pay by Industry
Berkshire County workers on average earn significantly less per year relative to workers in other areas.
For every single industry sector, the average annual pay per employee is less in Berkshire County than it
is in Massachusetts as a whole. This relationship mostly holds when Berkshire County is compared to the
United States as a whole, with the only exceptions being Manufacturing, Educational Services, and
Accommodations and Food Services. See Table 4. Thus, the region not only has a high level of
employment in industry sectors that pay a lower average weekly wage compared with other sectors,
but. Thus, not only is regional employment concentrated in those sectors with comparatively lower
weekly earnings, but Berkshire County employees command lower wages on average than those in
other parts of the state and nation. Taken together, these factors contribute to Berkshire County’s
relatively lower median household income.
Table 4. Average Annual Pay by NAICS Sector: Berkshire County, Massachusetts, and United States in 2018
NAICS Sector Average Annual Pay Average Annual Pay Average Annual
Berkshire County Massachusetts Pay U.S
NAICS 11 Agriculture, $29,791 $60,350 $35,841
forestry, fishing and
hunting
NAICS 21 Mining, $55,513 $69,089 $104,257
quarrying, and oil and
gas extraction
NAICS 22 Utilities $106,571 $131,189 $109,957
NAICS 23 Construction $55,872 $78,802 $62,727
NAICS 31-33 $78,097 $88,576 $68,525
Manufacturing
12
2019 ANNUAL UPDATE BERKSHIRE COUNTY CEDS 2017-2022NAICS 42 Wholesale $56,289 $98,763 $77,870
trade
NAICS 44-45 Retail trade $30,320 $34,910 $32,362
NAICS 48-49 $35,284 $50,931 $53,197
Transportation and
warehousing
NAICS 51 Information $58,405 $123,118 $113,781
NAICS 52 Finance and $83,173 $162,705 $109,231
insurance
NAICS 53 Real estate and $45,052 $79,570 $59,129
rental and leasing
NAICS 54 Professional $79,669 $134,979 $97,113
and technical services
NAICS 55 Management $57,914 $135,094 $122,843
of companies and
enterprises
NAICS 56 Administrative $35,715 $49,105 $40,985
and waste services
NAICS 61 Educational $56,647 $69,160 $51,250
services
NAICS 62 Health care and $49,585 $55,948 $50,326
social assistance
NAICS 71 Arts, $27,596 $40,848 $38,887
entertainment, and
recreation
NAICS 72 $22,339 $25,115 $21,559
Accommodation and
food services
NAICS 81 Other services, $30,731 $38,569 $38,464
except public
administration
Source: U.S. Bureau of Labor Statistics, Quarterly Census of Employment and Wages
13
2019 ANNUAL UPDATE BERKSHIRE COUNTY CEDS 2017-2022Industrial Concentration
Industrial concentration may be indicated using a location quotient, which computes how much more or
less concentrated a particular industry is in one region compared to the nation when measured by the
number of establishments, employment, or total wages. An LQ greater than 1.0 bears review and can
reveal unique aspects of a regional economy. When compared to the United States as a whole,
Berkshire County demonstrates high levels of concentration of establishment, employment, and wages
in Health Care and Social Assistance, Arts, Entertainment, and Recreation, Educational Services, and
Accommodation and Food Services. The outsize role these industries play in Berkshire County’s
economy may in part be attributed to the region’s reputation as a tourist destination and its aging
population. Conversely, Berkshire County displays low levels of concentration in Agriculture, Forestry,
Fishing, and Hunting, Mining, Quarrying, and Oil and Gas Extraction, Wholesale Trade, Management of
Companies and Enterprises, and Real Estate and Rental and Leasing.
Table 5. Berkshire County vs. US NAICS Sector Location Quotients (2018)
NAICS Sector Establishment LQ Employment LQ Wages LQ
NAICS 11 Agriculture, forestry, fishing and 0.51 0.40 0.40
hunting
NAICS 21 Mining, quarrying, and oil and gas 0.42 0.24 0.15
extraction
NAICS 22 Utilities 1.26 1.00 1.19
NAICS 23 Construction 1.23 0.94 1.02
NAICS 31-33 Manufacturing 0.84 0.74 1.04
NAICS 42 Wholesale trade 0.35 0.42 0.37
NAICS 44-45 Retail trade 1.12 1.13 1.29
NAICS 48-49 Transportation and 0.53 0.39 0.32
warehousing
NAICS 51 Information 0.91 0.63 0.39
NAICS 52 Finance and insurance 0.62 0.71 0.66
NAICS 53 Real estate and rental and leasing 0.59 0.61 0.57
NAICS 54 Professional and technical 0.60 0.74 0.74
services
NAICS 55 Management of companies and 0.46 0.27 0.16
enterprises
NAICS 56 Administrative and waste services 0.87 0.66 0.71
14
2019 ANNUAL UPDATE BERKSHIRE COUNTY CEDS 2017-2022NAICS 61 Educational services 1.11 2.41 3.26
NAICS 62 Health care and social assistance 1.70 1.51 1.83
NAICS 71 Arts, entertainment, and 1.52 2.16 1.88
recreation
NAICS 72 Accommodation and food 1.28 1.20 1.52
services
NAICS 81 Other services, except public 0.88 1.16 1.13
administration
Source: U.S. Bureau of Labor Statistics, Quarterly Census of Employment and Wages
Regional Economic Resilience
Berkshire County continues to experience transition to an economy with a more diverse mix of small- to
medium-sized firms and fewer large employers dominating the employment landscape. This diversity is
encouraged by economic development practitioners in the region, with a focus on “home-grown” firms
putting down roots in the county and connecting with a local workforce. In addition to finding and
retaining qualified employees, energy costs, transportation, and broadband access remain priorities for
employers. Both the Workforce Blueprint and Berkshire Blueprint 2.0 will guide regional practitioners in
their next steps toward improved resilience, with Berkshire Benchmarks serving as a valuable
measurement tool.
15
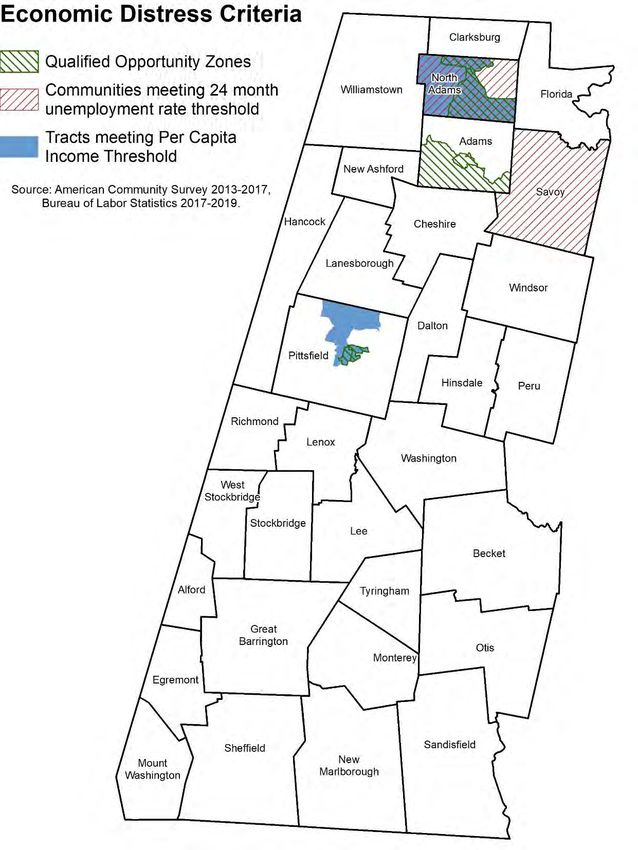
2019 ANNUAL UPDATE BERKSHIRE COUNTY CEDS 2017-2022Areas Meeting EDA Economic Distress Criteria
Unemployment – 13 CFR 301.3(a)(i)
As of the most recently available data, two (2) municipalities in Berkshire County (North Adams and
Savoy) have a 24-month average unemployment rate at least one (1) percentage point greater than the
national average of 3.9%. The City of North Adams became ineligible under this criterion since the 2018
CEDS Update was submitted. Please see Appendix “A” for more information.
Per Capita Income – 13 CFR 301.3(a)(ii)
As of the most recently available data, seven (7) census tracts in Berkshire County have a per capita
income that is eighty (80) percent or less of the national average. Five (5) of these tracts are located in
the City of Pittsfield and two (2) in the City of North Adams. Census tract 9213.00 in the City of North
Adams has become ineligible under this criterion since the 2018 CEDS Update was submitted. Please see
Appendix “B” for additional information.
Economic Distress Criteria Map
Please see Appendix “C” for a map of the eligible areas.
16
2019 ANNUAL UPDATE BERKSHIRE COUNTY CEDS 2017-2022Section 3. Goals & Objectives Performance Report
The 2017-2022 Berkshire CEDS sets forth six goals and objectives for the region. This section highlights
the activities undertaken over the last 12 months to help the region meet these goals and objectives.
GOAL # 1: TALENT & WORKFORCE - To stabilize and strengthen the region’s workforce in order to meet
the evolving needs of employers in the region.
Representative Activities:
✓ 1Berkshire continues to host “the jobs thing”, the first Berkshire County exclusive jobs portal
which only hosts positions that are permanent, full-time and pay $40,000+ a year. Since its
launch in July 2018 it has seen over 75,000 site visits, more than 36,000 unique users, and over
2,000,000 digital impressions.
✓ The MassHire Berkshire Workforce Board (BWB) issues an annual Berkshire Workforce Blueprint
which identifies the region’s critical (largest number of people employed) and emerging (signs of
growth) industries.
✓ During FY2019, BWB facilitated a manufacturing training program for 55 un/under employed
residents with a 72% placement rate with 14 employers with funding from the MA Executive
Office of Housing and Economic Development.
✓ BWB leveraged $2,689,000 which impacted 3,443 people and 533 companies during FY19. An
additional $480,000 was generated to help connect K-12 youth with career readiness and career
exploration activities.
✓ The Berkshire Business Interns program, developed by Lever, Inc. in partnership with the
Berkshire United Way and the BWB, placed 45 interns during the summer of 2019 at 18 leading
Berkshire organizations, in full-time, 10-week, paid internship positions.
✓ 1Berkshire acted as the MassHire Berkshire Workforce Board's contracted facilitator of the
Workforce Skills Cabinet. This facilitation included bringing together assets, opportunities and
initiatives, as well as creating strategic benchmarks for further development within the regional
workforce landscape."
✓ The Nonprofit Center of the Berkshires (NPC) is working with United Personnel to facilitate
placement of marketing, administrative, and development personnel with nonprofits. The NPC
also hosts a listserve of nonprofit job openings and connects agencies with similar open part-
time positions to consider sharing personnel.
17
2019 ANNUAL UPDATE BERKSHIRE COUNTY CEDS 2017-2022GOAL # 2: ENTREPRENEURSHIP & INNOVATION - To create a diverse and robust business and
entrepreneurial environment that encourages innovation and drives economic growth and opportunity.
Representative Activities:
✓ Thanks to the support of the Mass Life Science Center, the City of Pittsfield, the Pittsfield
Economic Development Authority, and private industry partners, the Berkshire Innovation
Center (BIC) is poised to open its brand new 22,000 SF facility in January 2020. The BIC will offer
world-class R&D facilities and equipment, interactive training and conferencing facilities, and
shared access to advanced technology for local small and medium sized manufacturing
companies. The BIC will bring together industry, higher education, and vocational training, and
provide hi-tech classrooms, labs, and equipment. It will also serve as home to a handful of
member tenants, including young companies seeking to grow.
✓ The Schumacher Center for New Economics facilitates an Entry to Entrepreneurship program, an
entry-level business planning course taught by members of the Berkshire business community
that is focused on fostering community entrepreneurship.
✓ 1Berkshire and MCLA co-presented a Business Boot Camp for entrepreneurs in the idea stage of
a new business.
✓ 1Berkshire conducted a Get Mentored series, pairing entrepreneurs with mentors suitable for a
variety of business launch stages.
✓ 1Berkshire held 12 entrepreneurial meetups and 2 Entrepreneurial PR Exchanges in FY19. These
events promoted networking across the entrepreneurial ecosystem as well as promoted stories
and exciting narratives about the entrepreneurial vein of the Berkshires to external audiences.
✓ Lever, Inc. conducted entrepreneur challenges in the arts, manufacturing, and health
technology. In this competitive format, four entrepreneurs compete for $25,000 in seed funding
and extensive mentoring from Lever staff and affiliates.
✓ Multiple regional stakeholders helped to bring EforAll Berkshire County to the region. This
three-year initial program includes commitments of $1,000,000 to help support entrepreneurs
in bringing their businesses to life in the region through a targeted mentorship model.
✓ The Massachusetts Small Business Development Center Network office in Berkshire County
served 298 unique small business clients, helped 34 startup businesses open their doors, and
assisted in the creation of 60 new jobs through capital infusion of $2,695,464 into the hands of
local small business owners.
✓ Berkshire Enterprises conducted monthly business breakfasts with themes suitable for new and
developing business owners, a series now in its 19th year.
18
2019 ANNUAL UPDATE BERKSHIRE COUNTY CEDS 2017-2022GOAL # 3: INFRASTRUCTURE, SITE READINESS & TRANSPORTATION - To invest in infrastructure and site
improvements that support or facilitate economic growth in appropriate areas.
Representative Activities:
✓ The Berkshire Brownfields Program continues to operate an Environmental Protection Agency
funded brownfields assessment program and revolving loan fund to facilitate the assessment
and cleanup of contaminated sites.
✓ 1Berkshire has launched the beta version of their Site Selector tool. This interface allows for
realtors and property managers to post commercial properties and development opportunities
for free on a site targeted towards those seeking investment opportunities.
✓ The Berkshire Flyer Pilot, a weekend passenger rail service connecting New York City and the
Berkshires, will run between Memorial Day and Columbus Day in 2020. Funding has been
secured in the FY 2020 legislative appropriation to support the pilot, deemed economically
viable and beneficial by the Berkshire Flyer initiative studies.
✓ MassDOT performed a $3 million resurfacing of 4 miles of Route 7 from Plunkett Street in Lenox
to Route 102 in Stockbridge.
✓ MassDOT invested $2.2 million for traffic signal and intersection improvements at Route 2 and
Phelps Avenue in North Adams.
✓ MassDOT invested $3.6 million for bridge replacement on Route 7A (Ashley Falls Road) over
Housatonic River in Sheffield.
✓ The 2017 5-year ACS indicates that 78.2% of homes are considered to have broadband access,
an increase of over 8% since the 2016 5-year estimates.
GOAL # 4: COLLABORATION - To increase regional and inter-regional collaboration to better leverage
economic development opportunities.
Representative Activities:
✓ The Berkshire Regional Planning Commission continues to operate a data clearinghouse and
indicators website (Berkshire Benchmarks) focused on improving the quality, volume and access
to information and statistics for the Berkshire region.
✓ 1Berkshire continued to host the Economic Development Practitioners Group meetings in an
effort to create collaborative and cooperative opportunities for programs and initiatives around
economic development in the region. This group meets quarterly and includes a cross section of
economic development stakeholders both regionally and at the state level.
✓ The Berkshire Compact is a continuing regional collaboration. The Compact is a group of regional
civic, education and business leaders who seek to ensure the well-being of each individual and
19
2019 ANNUAL UPDATE BERKSHIRE COUNTY CEDS 2017-2022the strength of our economy and community by raising the educational access, aspirations and
attainment, as life-long learners, of Berkshire County residents.
✓ A partnership between MassHire Berkshire Workforce Board and Berkshire United Way with
support from the state and the federal Workforce Innovation and Opportunity Act allowed a
Berkshire Recruiter to assist 120 job seekers, with 70% finding employment. BWB also convened
with 105 businesses and established bi-monthly human resource networking meetings which
assists 46 companies with their recruitment and retention needs.
✓ The Impact Council of Berkshire County Leadership serves as a countywide collaborative
representative of major employers, key organizations, sectors, and initiatives from throughout
the region. It serves as a resource, facilitator, connector, convener and guide to advance
opportunities and align efforts pertaining to economic development, quality education,
workforce development and promotion of the Berkshires as a great place to live, work and play.
✓ The Berkshire Municipal Managers Association (BMMA), which includes every town
administrator in Berkshire County and is currently led by Great Barrington Town Manager Mark
Pruhenski, meets monthly to share best practices and explore shared services.
GOAL # 5: INDUSTRY & OCCUPATIONAL CLUSTERS - To support and expand the region’s industry and
occupational clusters.
Representative Activities:
✓ 1Berkshire publicly launched the Berkshire Blueprint 2.0 in February of 2019. This updated
strategic imperative for economic growth is a guiding, action-oriented document focused on the
five top industry clusters, and the cross-cutting issues of importance that face the regional
economy. This effort updates and expands upon the original Berkshire Blueprint, issued in 2008
and brings a new level of facilitation, tracking, and reporting to the regional economic
development activities going forward into the implementation phase.
✓ A database of regional investments is being maintained by Berkshire Regional Planning
Commission. This database catalogs priority projects identified in the Berkshire County CEDS,
along with similar and emerging projects that may be incorporated into future CEDS. The
database now contains over 260 entries. (See Appendix E for more information).
✓ Age Friendly Berkshires worked with regional employers, employment agencies and other
state/local partners (such as AARP Massachusetts and Elder Services of Berkshire County) to
host the 2nd Annual “age 50+” JOB FAIR for Berkshire residents, connecting mature job seekers
with more than 40 employers.
✓ The Berkshire Skills Team selected Healthcare/Social Assistance, Advanced Manufacturing, and
Hospitality/Management as priority industry sectors. Priorities for FY19 included establishing
career ladder opportunities in manufacturing, piloting a fast-track hospitality program, creating
20
2019 ANNUAL UPDATE BERKSHIRE COUNTY CEDS 2017-2022career trees, establishing K-12 career readiness programming, and conducting education and
training asset mapping for the region.
✓ Lever, Inc.’s Intrapreneur Challenge employs a competitive format to incentivize innovation
among existing Berkshire businesses, including companies in manufacturing and health
technology.
GOAL # 6: ECONOMIC RESILIENCY - To support the resiliency of individual businesses and the regional
economy during future economic disruptions.
Representative Activities:
✓ The Massachusetts Small Business Development Center Network serves as a mandated response
agent along with the Small Business Administration (SBA) to support small business needs and
help provide express access to loan funds released by the US Treasury in any state declared or
nationally declared disaster.
✓ Lever, Inc. provides mentorship and access to expert advisors on topics such as market
diversification and capitalization strategies.
✓ The Nonprofit Center of the Berkshires offered multiple workshops to nonprofit organizations to
increase fundraising capacity, hosted a Giving Tuesday strategy roundtable, and published its
annual Giving Back guide to encourage donations to and volunteering with regional nonprofits.
NPC also facilitated connection with statewide services by hosting MA Nonprofit Network, MA
Service Alliance, MassDevelopment, and Philanthropy MA.
✓ Investment in developing the Outdoor Recreation economy of the Berkshires continues on a
number of fronts, including at Greylock Glen in Adams, Springside Park in Pittsfield, the Mohawk
Trail Woodlands Partnership, the “High Road” initiative of Berkshire Natural Resources Council,
and throughout the region via funding to properly map and promote mountain biking trails.
✓ Qualified Opportunity Zones in Berkshire County including zones in Adams, North Adams, and
Pittsfield, participated in an Opportunity Zone Symposium organized by Berkshire Regional
Planning Commission and 1Berkshire.
✓ A rebuilt Taconic High School in Pittsfield accepted its first students and features vocational
education programs tied to the needs of manufacturers in the region, as well as training for
trades in which there are shortages of workers within Berkshire County and outside the region.
21
2019 ANNUAL UPDATE BERKSHIRE COUNTY CEDS 2017-2022Section 4. Priority Projects & Status Report
One of the EDA requirements for a CEDS is, “A section identifying and prioritizing vital projects,
programs and activities that address the region’s greatest needs or that will best enhance the region’s
competitiveness, including sources of funding for past and potential future investments (13 CFR §303.7).
The Berkshire County Project Priority list was prepared to meet that requirement. It is an inventory of
regional economic development proposals submitted for consideration by citizens, communities, and
organizations located throughout the region, including proposals submitted by CEDS Strategy
Committee members. These proposals represent economic development initiatives, programs, and
projects, that if implemented would help diversify, stabilize, and strengthen the region’s economy.
This section contains the 2019 Priority Project List for the Berkshire region. Updates for each Priority
Project are provided in the appendix. Recognizing there are a number of ways specific projects could be
viewed regarding regional significance, the prioritized projects were first grouped on a region wide basis
and then, in the case of Physical Development, by subregion.
Projects Representing the Greatest Needs Regionally
• Broadband for All
• Berkshire Regional Planning Commission Brownfields Program
• Connecting Activities High School Internship Program
• Berkshire Compact for Education & Berkshire County STEM Pipeline Network
• Berkshire Innovation Center at William Stanley Business Park
• Berkshire Blueprint 2.0 Implementation*
Projects that Enhance the Region: Programs, Initiatives, Studies, Education,
Other
• Adaptive Reuse of Mills
• Adaptive reuse of “Great Estate” properties
• Creative Economy Initiatives
• Berkshire Hills Internship Program
• Growing the Future Food Economy of the Berkshires*
Projects that Enhance the Region: Physical Development
North Sub-Region
• Greylock Glen (Adams)
• Greylock Works (North Adams)
• Memorial School Redevelopment (Adams)
• Spinning Mill Redevelopment (Adams)*
• Blackinton Infrastructure (North Adams)*
Central Sub-Region
• Berkshire Mall Reuse (Lanesborough)
22
2019 ANNUAL UPDATE BERKSHIRE COUNTY CEDS 2017-2022• Crane Stationery Mill Redevelopment (Dalton)
• Columbus Ave/Summer St. Garage (Pittsfield)*
• North Mountain Park (Dalton)*
• Police Station (Pittsfield)*
• YMCA Renovation (Pittsfield)*
• Tyler Street Streetscape (Pittsfield)*
• Springside House Restoration (Pittsfield)*
• Broadband Fiber-Optic Network Construction (Washington)*
• Wright Building Renovation (Pittsfield)*
• White Terrace Renovation (Pittsfield)*
• 765 Tyler St. (Pittsfield)*
South Sub-Region
• Element by Westin (Lenox)
• Elm Court – Front Yard/Travaasa (Stockbridge/Lenox)
• Redevelopment of Great Barrington Fairgrounds (Great Barrington)
• Housatonic School Redevelopment (Housatonic Village (Great Barrington))
• Miraval-Lenox Expansion at Cranwell (Lenox)
• Monument Mills Area Reuse (Housatonic Village (Great Barrington))
• Niagara Mill (Lee)
• New England Log Homes (Great Barrington)
• River School Redevelopment (Great Barrington)
• Spring Lawn (Lenox)
• Columbia Mill Redevelopment (Lee)*
• Eagle Mill Redevelopment (Lee)*
• Greylock Mill Redevelopment (Lee)*
*indicates a project added to the Priority list in 2019
Annual Priority Project Updates – 2019
Please see Appendix “D” for the annual updates to the Priority Projects.
As noted in the 2017-2022 Berkshire County CEDS, this list is part of an ongoing process of identifying
and tracking regionally significant economic development proposals. In maintaining this list, the CEDS
Committee stresses that annual review and update is an important way to continue identifying, refining,
and improving the prioritization of projects in Berkshire County.
23
2019 ANNUAL UPDATE BERKSHIRE COUNTY CEDS 2017-2022Appendix “A”
24 Month Local Area Unemployment Statistics
Economic Distress Criteria—Primary Elements
Region U.S. Threshold Calculation
24-Month Average
3.9% 3.9% 0
Unemployment Rate
Economic Distress Criteria—Geographic Components
24-Month Average
Municipality Threshold Calculation
Unemployment Rate
Adams 4.6% 0.7
Alford 2.0% -1.9
Becket 4.1% 0.2
Cheshire 4.3% 0.4
Clarksburg 4.2% 0.3
Dalton 3.3% -0.6
Egremont 1.8% -2.1
Florida 3.3% -0.6
Great Barrington 3.3% -0.6
Hancock 2.7% -1.2
Hinsdale 4.4% 0.5
Lanesborough 3.5% -0.4
Lee 3.5 -0.4
Lenox 4.0% 0.1
Monterey 3.0% -0.9
Mount Washington 2.6% -1.3
New Ashford 4.3% 0.4
New Marlborough 3.1% -0.8
North Adams 4.9% 1
Otis 4.0% 0.1
24
2019 ANNUAL UPDATE BERKSHIRE COUNTY CEDS 2017-2022Peru 3.1% -0.8
Pittsfield 4.2% 0.3
Richmond 2.6% -1.3
Sandisfield 3.0% -0.9
Savoy 5.0% 1.1
Sheffield 2.9% -1
Stockbridge 3.2% -0.7
Tyringham 2.7% -1.2
Washington 3.9% 0
West Stockbridge 3.2% -0.7
Williamstown 2.9% -1
Windsor 2.6% -1.3
25
2019 ANNUAL UPDATE BERKSHIRE COUNTY CEDS 2017-2022Appendix “B”
Most Recently Available Data on Per Capita Income from the American Community Survey
5-Year Estimates
Economic Distress Criteria—Primary Elements
Region U.S. Threshold Calculation
2017 Per Capita Money Income
$33,245 $31,177 106.63%
5-Year ACS
Economic Distress Criteria—Geographic Components
PCMI 2017 Threshold
Census Tract Geographic Area
ACS Calculation
Tract 9001.00 Berkshire, MA $17,849 57.3% Pittsfield
Tract 9002.00 Berkshire, MA $19,815 63.6% Pittsfield
Tract 9003.00 Berkshire, MA $26,382 84.6% Pittsfield
Tract 9004.00 Berkshire, MA $23,860 76.5% Pittsfield
Tract 9005.00 Berkshire, MA $44,468 142.6% Pittsfield
Tract 9006.00 Berkshire, MA $16,207 52.0% Pittsfield
Tract 9007.00 Berkshire, MA $32,748 105.0% Pittsfield
Tract 9008.00 Berkshire, MA $44,083 141.4% Pittsfield
Tract 9009.00 Berkshire, MA $32,933 105.6% Pittsfield
Tract 9011.00 Berkshire, MA $32,477 104.2% Pittsfield
Tract 9111.00 Berkshire, MA $34,884 111.9% Lanesborough
Tract 9121.00 Berkshire, MA $34,892 111.9% Dalton
Tract 9131.00 Berkshire, MA $49,332 158.2% Lenox
Tract 9141.00 Berkshire, MA $31,304 100.4% Lee
Tract 9201.01 Berkshire, MA $32,835 105.3% Williamstown
Tract 9201.02 Berkshire, MA $33,699 108.1% Williamstown
Tract 9213.00 Berkshire, MA $25,475 81.7% North Adams
Tract 9214.00 Berkshire, MA $22,971 73.7% North Adams
Tract 9215.00 Berkshire, MA $23,955 76.8% North Adams
26
2019 ANNUAL UPDATE BERKSHIRE COUNTY CEDS 2017-2022Tract 9221.00 Berkshire, MA $25,873 83.0% Adams
Tract 9222.00 Berkshire, MA $30,410 97.5% Adams
Tract 9223.00 Berkshire, MA $29,608 95.0% Adams
Tract 9231.00 Berkshire, MA $33,984 109.0% Cheshire
Tract 9241.00 Berkshire, MA $45,241 145.1% Stockbridge
Tract 9251.00 Berkshire, MA $33,220 106.6% Great Barrington
Tract 9261.00 Berkshire, MA $43,264 138.8% Sheffield
Tract 9311.00 Berkshire, MA $29,281 93.9% Clarksburg
Tract 9313.00 Berkshire, MA $28,147 90.3% Florida/Savoy
Tract 9314.00 Berkshire, MA $40,520 130.0% Peru/Windsor
Tract 9322.00 Berkshire, MA $39,393 126.4% Becket/Washington
Tract 9323.00 Berkshire, MA $35,888 115.1% Hinsdale
Tract 9332.00 Berkshire, MA $51,705 165.8% Monterey/Tyringham
Tract 9333.00 Berkshire, MA $45,736 146.7% New Marlborough
Tract 9334.00 Berkshire, MA $38,846 124.6% Otis/Sandisfield
Tract 9342.00 Berkshire, MA $43,811 140.5% West Stockbridge
Tract 9343.00 Berkshire, MA $52,618 168.8% Alford/Egremont/Mt. Washington
Tract 9351.00 Berkshire, MA $53,720 172.3% Hancock/New Ashford/Richmond
Tract 9352.00 Berkshire, MA $31,790 102.0% Pittsfield
Tract 9353.00 Berkshire, MA $23,850 76.5% North Adams
Source: U.S. Census Bureau, American Community Survey, 5-Year Estimates (2013- 2017)
27
2019 ANNUAL UPDATE BERKSHIRE COUNTY CEDS 2017-2022Appendix “C”
Economic Distress Criteria Map
28
2019 ANNUAL UPDATE BERKSHIRE COUNTY CEDS 2017-2022Appendix “D”
2019 Annual Priority Project Updates
2019 CEDS Priority Project List
Note: a “Special Designator” line has been added to each entry indicating if the project is tied to our
regional priorities and/or is located in a Low Income Community or an Opportunity Zone.
Special Designator Legend:
Great Estate – Adaptive Reuse of “Great Estates” Project
Mill – Adaptive Reuse of Mills Project
Brownfield – BRPC Brownfields Program Project
Broadband – Broadband for All Project
LIC – Low Income Community
OZ – Project located in a Federally-designated Opportunity Zone
Projects Representing the Greatest Needs Regionally
Project Name: Broadband for All
Status: included in 2017-2022 CEDS
Location: County-wide
Special Designators: LIC, OZ (dependent upon municipality)
Project Summary: Berkshire County has long lagged behind the more urban areas of the state in terms
of broadband internet access as the large size and low population density of the County makes the
installation of high-speed internet infrastructure especially costly. The digital divide was partially
addressed between 2011 and 2014 when the Massachusetts Broadband Institute constructed the
MassBroadband 123 fiber-optic network providing many municipalities in central and western
Massachusetts with broadband, but more than half of Berkshire County municipalities, especially those
on the mountainous and less densely populated periphery of the County, remained without access.
Since then, a new round of state funding combined with local initiatives either has provided or is soon to
provide all Berkshire County municipalities with broadband access. Many have opted to construct their
own municipally owned fiber-optic networks, which deliver speeds far above those provided by cable
broadband, while others are installing wireless broadband networks where geography makes a wired
network prohibitively expensive.
Funding Source(s): Public Investment, Massachusetts Broadband Institute and Municipal funds.
Projected Job Creation: none
Related Linkages: supports Goal 3 of 2017-2022 CEDS: Invest in Infrastructure.
Timeframe: Some municipalities still completing make-ready stage. 2020 County-wide completion at
earliest.
Changes since 2018 CEDS Update:
Source: updated information provided by BRPC
Project Name: Berkshire Regional Planning Commission Brownfields Program
Status: included in 2017-2022 CEDS
29
2019 ANNUAL UPDATE BERKSHIRE COUNTY CEDS 2017-2022Location: County-wide
Special Designators: Brownfields; LIC, OZ (dependent upon site location)
Project Summary: Two-part assessment program and revolving loan fund (RLF) used to provide
municipalities and developers with the resources to assess and cleanup brownfields sites. Through its
assessment program, BRPC hires a licensed site professional to investigate potential contamination on
sites. The RLF program provides loans (and sub-grants) to municipalities and other entities to help pay
for the removal of contamination. The purpose of this program is to promote the reuse and
redevelopment of contaminated, vacant, or underutilized properties.
Funding Source(s): Public investment, U.S. Environmental Protection Agency
Projected Job Creation: Indeterminate - job creation varies by site/project.
Related Linkages: Several of the most significant current and past property investments in Berkshire
County have received funding through the Brownfields program. This includes other CEDS priority
projects such as Greylock Works, Eagle Mill, and New England Log Homes.
Timeframe: Program is ongoing.
Changes since 2018 CEDS Update: 7 active sites currently receiving assessment work through the
brownfields program (1 more than 2018); 3 active sites in north and south county are currently
conducting remediation utilizing RLF funds (1 less than 2018); 6 communities have received Brownfields
Assessment Grants and cleanup Grants from EPA as a direct result of BRPC’s Brownfields Program:
- 15 active sites currently receiving assessment work via community assessment grants (4 more
than 2018);
- 1 active site undergoing remediation through community cleanup grant (no change since 2018).
Source: updated information provided by BRPC
Project Name: Connecting Activities High School Internship Program
Status: included in 2017-2022 CEDS
Location: County-wide
Special Designators: none
Project Summary: Operated by the MassHire Berkshire Workforce Board (formerly BCREB), this program
provides a mechanism to develop career pathways and implement readiness workshops for individuals
entering the workforce. It places students in internships and training programs to improve workforce
competitiveness and post-secondary education readiness. The program annually connects around 500
high school students with internships, 1,500 students with career exploration activities, and 15
educators with teacher externships. Approximately 30% of student interns are paid, contributing to
regional income.
Funding Source(s): Public Investment, Massachusetts Dept. of Elementary and Secondary Education.
Projected Job Creation: Approximately 400 high school internships annually.
Related Linkages: This initiative supports education and workforce development.
Timeframe: Program is ongoing.
Changes since 2018 CEDS Update:
385 high school internships and/or work-based learning experiences during FY2019, of which 168 were
STEM internships (63 fewer and 105 more than 2018, respectively);
2,234 college/career readiness programing activities within 12 school districts and working with 149
employers during FY2019 (177 fewer activities and 161 fewer employers than FY2018, no change in
number of school districts).
Source: updated information provided by MassHire Berkshires
30
2019 ANNUAL UPDATE BERKSHIRE COUNTY CEDS 2017-2022Project Name: Berkshire Compact for Education & Berkshire County STEM Pipeline
Status: included in 2017-2022 CEDS
Location: County-wide
Special Designators: none
Project Summary: This initiative works to improve access to post-secondary education and raise the
aspirations of all Berkshire County residents to pursue 16 or more years of education and/or training in a
technical field, and strives to build connections between the needs of the workplace and the local
education system by providing students with knowledge of college and career readiness. The Berkshire
Blueprint 2.0 is now used as the framework for the program’s design.
Funding Source(s): Berkshire United Way, Guardian Life, Adams Community Bank, MCLA Foundation,
and the MA Dept. of Higher Education.
Projected Job Creation: none
Related Linkages: These initiatives and programs seek to ready the workforce for Berkshire County in
the areas of Science, Technology, Engineering, and Math. They also seek to create interest in these fields
at a young age.
Timeframe: This program is fully operational and ongoing annually
Changes since 2018 CEDS Update: In the past year, 1,000 grade 6 students representing county middle
schools visited one of the county’s 4 colleges; 250 grade 3 students from school districts in the Northern
Berkshire area visited MCLA; 850 grade 8 students from 7 schools participated in a Career Experience
Day coordinated by MCLA; the MCLA MBA program has graduated over 100 students since its inception
in 2010; the Dual Enrollment program continues to provide access for students from the county’s four
most disadvantaged schools with access to college level courses. A Summer Academy program for high
school students was established for students to earn college credit and learn more about the College
Search Process. A series of public access television programs were created focusing on college access
and aspiration topics.
Source: updated information provided by MCLA
Project Name: Berkshire Innovation Center at William Stanley Business Park
Status: included in 2017-2022 CEDS
Location: City of Pittsfield
Special Designators: LIC
Project Summary: Construction of the Berkshire Innovation Center (BIC), which will be a combined R&D
laboratory, training center, and collaboration/conference center. The 23,000-square-foot BIC will
provide member companies and community partners access to facilities and equipment such as a wet
lab, clean rooms, PC and server room, incubator space, and training classrooms.
Funding Source(s): Public investment
Projected Job Creation: 25
Related Linkages: Addresses goals 1, 2, 4, 5, and 6 in the 2017-2022 CEDS.
Timeframe: Estimated completion Fall 2019 completion.
Changes since 2018 CEDS Update: Partnerships are in place with MCLA, Williams College, UMass Lowell,
UMass Institute for Applied Life Sciences, RPI, Taconic High School, McCann Technical School,
Monument Mountain Regional High School, and the Massachusetts Green High Performance Computing
Center, as well as numerous small and medium size existing legacy businesses in the region.
31
2019 ANNUAL UPDATE BERKSHIRE COUNTY CEDS 2017-2022Source: updated information provided by BIC
Project Name: Berkshire Blueprint 2.0 Implementation
Status: NEW
Location: region-wide
Special Designators: Blueprint 2.0 implementation is likely to include projects and initiatives that
incorporate all of the special designators listed above.
Project Summary: The Berkshire Blueprint 2.0 is the product of nearly 2 years of intensive research,
interviews, and planning. This work, coordinated by 1Berkshire, aimed to develop and launch a strategic
imperative with the goal of sustained economic development across the region. Launching in February
2019, the Berkshire Blueprint 2.0 will utilize a cluster-based model to functionally address the needs,
and help to track and benchmark intentional work, in 5 central industrial clusters. These clusters, each
facilitated by a partner Hub, include: Advanced Manufacturing and Engineering, Creative Economy, Food
and Agriculture, Healthcare, and Hospitality and Tourism. Along with a set of cross-cutting themes that
impact everyone across the region, the Berkshire Blueprint 2.0 Advisory Board, Cluster Hub Leadership,
and the team at 1Berkshire will continue to provide resources, implementation support, and
benchmarking to activate the goals and objectives of the Blueprint over time. By design, this
implementation model will allow for additional clusters, refreshed cross-cutting themes, and an agile
approach to provide sustained and high impact economic development for the entirety of Berkshire
County.
Funding Source(s): public/private partnerships, 1Berkshire Foundation
Projected Job Creation: 2
Related Linkages: Addresses goals 1, 2, 4, 5 and 6 in the 2017-2022 CEDS.
Timeframe: ongoing
Changes since 2018 CEDS Update: n/a
Source: updated information provided by 1Berkshire
Projects that Enhance the Region
Project Name: Adaptive Reuse of Mills
Status: included in 2017-2022 CEDS
Location: County-wide
Special Designators: Mill, Brownfields, LIC, OZ (all dependent on-site location)
Project Summary: Former industrial sites such as mills and factories are some of the largest developable
lots in Berkshire County by land and building area, with some containing upwards of 200,000 square
feet. Given the general lack of large plots suitable for development throughout the County, the
redevelopment and reuse of these sites is crucial for the regional economy. The large size and often
open floorplan of these buildings make them appropriate for many uses including housing, small office
and retail space, manufacturing, restaurants and hotels, and large, service-based enterprises, as well as
multi-use facilities that combine these applications. Additionally, these sites are among the most iconic
and historic architectural features of Berkshire County municipalities and their redevelopment helps
avoid blight and reinvigorate the surrounding the community. Some past, current, and planned future
adaptive reuses include the redevelopment of Sprague Electric by Mass MoCA in North Adams, the
Cariddi Mill by Greylock Works in North Adams, the Norad Mill in North Adams by Moresi and
32
2019 ANNUAL UPDATE BERKSHIRE COUNTY CEDS 2017-2022You can also read