Using Twitter Data to Monitor Immigration Sentiment * - OSF
←
→
Page content transcription
If your browser does not render page correctly, please read the page content below
Using Twitter Data to Monitor Immigration Sentiment *
    Francisco Rowe †1 , Michael Mahony1 , Eduardo Graells-Garrido2 , Marzia Rango3 ,
                                  and Niklas Sievers3
1
  Geographic Data Science Lab, Department of Geography and Planning, University
                     of Liverpool, Liverpool, United Kingdom
              2
                Barcelona Supercomputing Center, Barcelona, Spain
3
  Global Migration Data Analyses Centre (GMDAC), International Organization for
                Migration (IOM), United Nations, Berlin, Germany

                                                 Abstract
             Immigration is a key ingredient for social cohesion and economic development.
        Yet, it is often portrayed as a major threat to national identity, values, economic sta-
        bility and security, particularly during challenging times, like the current COVID-19
        pandemic. These misrepresentations often result in acts of intolerance, discrimination,
        racism, xenophobia and violent extremism. Understanding how misperceptions towards
        immigration are formed and shaped is key to address combat mis-representations of
        immigrants. Typically attitudes towards immigration are studied based on qualitative
        and nationally representative surveys but they offer low population coverage, coarse
        geographical resolution and slow data collection. Digital trace data, particularly so-
        cial media, offer dynamic and open space to better understand experiences and public
        opinion about immigration. While some bias exists, social media data are produced at
        unprecedented temporal frequency, geographical granularity and is accessible in real
        time. This paper aims to illustrate how immigration sentiment can be measured and
        monitored using Twitter data and natural language processing. We discuss the complex-
        ities of collecting and analysing Twitter data, and show how they can be employed to
        monitor changes in anti-migration sentiment over time. We also discuss key practical
        considerations for the future use of Twitter data in terms of search data strategies, sta-
        tistical representation, data access allowance, constructing sentiment scores and ethical
        concerns.

   *
     Citation: Rowe, F., Mahoney, M., Graells,-Garrido E., Rango, M., Sievers, N. 2021. Using Twitter Data to
Monitor Immigration Sentiment. Practitioners’ Guidebook. International Organization for Migration. United
Nations. Berlin, Germany.
   †
     Corresponding author: F.Rowe-Gonzalez@liverpool.ac.uk

                                                     1
1. Making A Case for Twitter Data
Sentiment towards migrants is a key ingredient to migrant integration and social cohesion.
Immigration has consistently been identified as one of the most divisive social issues globally
(European Commision, 2019). Immigration sentiment shapes migration policy formulation
and political outcomes. Anti-immigration sentiment has spurred attention towards more
restrictive migration policies, and has been linked to an increasing prominence of right-wing
affiliation, particularly in Western European countries and the United States (Bail et al., 2018;
Greven, 2016; Dennison and Geddes, 2019). Immigration sentiment also influences the capac-
ity of migrants to successfully participate in receiving communities. Acts of discrimination,
intolerance and xenophobia can impair immigrants’ ability to secure employment, hous-
ing and achieve a sense of belonging in local communities, contributing to more polarised
societies (Blinder and Richards, 2020; Cheong et al., 2007; Penninx et al., 2008).
Anti-immigration sentiment has gained salience during the last decade. A wave of key
politically motivated events have significantly contributed towards this trend. Examples
include the Brexit referendum in the United Kingdom and Donald Trump’s presidential
campaign in the United States. Currently the world faces an unprecedented challenge to tackle
and understand the spread and impacts of COVID-19, which has reportedly coincided with
an increase in anti-immigration sentiment (Nature, 2020). Acts and displays of intolerance,
discrimination, racism, xenophobia and violent extremism have emerged linking individuals
of Asian descendent and appearance to COVID-19 (Nature, 2020).
Understanding public opinion towards immigrants is key to preventing the spread of
misinformation that fuels misperception, negative attitudes and discrimination against immi-
grants. Anti-immigration sentiment is often rooted in misperceptions (European Commision,
2019), and experimental evidence has revealed that providing information to address these
misconceptions can shift attitudes towards a more supportive view of immigration (Grig-
orieff et al., 2020). The availability and accuracy of data on public opinion of migration are
thus critical for tackling misperceptions and understanding the extent of local openness to
immigration and ethnic diversity (Dennison and Dražanová, 2018).
Traditionally, data on public attitudes towards immigration are collected through qualita-
tive sources, namely ethnographies, interviews and surveys. Yet, qualitative methods rely on
small samples and normally suffer from sample bias (Atieno, 2009). Similarly, while surveys
can provide a reliable national representation, they are expensive, infrequent, offer low popu-
lation coverage, lack statistically validity at fine geographical scales and become available with
a lag of one or two years after they have been collected (Atieno, 2009). Additionally, survey
data do not normally provide insights into why people hold certain views on migration, and
respondents may interpret the same survey question differently (Goyder, 1986).
New forms of data provide an opportunity to overcome these deficiencies. Social media,
particularly microblogging, offers a dynamic and open space which provides a unique window
to better understand public opinion about immigration. Microblogging is a new form of
communication in which users can short posts to express live opinions on mobile phones,
2computers and tablets. In January 2021, 54 percent (4.2 billion) of the world’s population
were estimated to be active social media users (Sehl, 2020). Social media data are produced
at an unprecedented temporal frequency, geographical granularity and are accessible in
real time (McCormick et al., 2017). Coupled with cheap computing and machine learning
algorithms, these data enable real-time processing of information to measure and monitor
anti-immigration sentiment at frequent temporal intervals over extended timeframes and
across the globe (Bartlett and Norrie, 2015; Freire-Vidal and Graells-Garrido, 2019).
This paper aims to illustrate how immigration sentiment can be measured and monitored
using Twitter data and natural language processing. Drawing on Twitter data, we exam-
ine immigration sentiment in the United Kingdom during January 15th to February 15th,
2020, comprising the start of the unfolding COVID19 pandemic. The first reported case of
COVID19 in the United Kingdom dates back to January 31st, 2020 (Wikipedia, 2020a), a day
after the first reported media case of a COVID-19-related incident of racism and xenophobia
against a Chinese student on January 30th, 2020 (Wikipedia, 2020b).
The potential limitations of Twitter to capture immigration sentiment should be acknowl-
edged. This source may only enable to capture the opinions of a selected segment of the
population whose size and attributes vary by country, according to access to digital technology,
offering a partial representation of immigration sentiment. Yet, Twitter represents a novel,
promising source of data that could complement traditional sources or offer valuable data
insights where appropriate data are not readily available. Thus Twitter data can contribute to
developing a more timely and comprehensive understanding of public perceptions towards
immigration.
2. Complementing Survey Research with Twitter Data
Globally, surveys are the primary source of public opinion on migration. A number of surveys
provide historical data on attitudes towards immigration, including the Gallup World Poll,
the Pew Global Attitudes Survey, the International Social Survey Programme, the World
Values Survey, the Iposos Global Trends, the European Social Survey, and the Eurobarometer.
They vary widely in temporal frequency, the number of countries covered, and the number of
questions collecting data on migration opinion (IOM, 2020). A Gallup World Poll to collect
data on attitudes towards immigration was conducted between 2012 and 2014 and covered a
total of 160 countries; however, it only contained six questions on migration-related public
opinion, and data are not publicly accessible (IOM, 2020). The World Values Survey has run
annually since 1981 but typically contains only two questions on migration-related public
opinion, while the European Social Survey contains 36 of such questions, but these were only
used in two waves in 2002 and 2014 (IOM, 2020).
A common question to capture broad attitudes towards immigration is whether or not
people think immigration levels should be increased, decreased or stay at present levels. While
wide variability across countries exist, world regional averages based on Gallup World Poll
data collected in 2012-2014 revealed people’s preference for either maintaining or increasing
3current immigration levels, with Europe being an exception (IOM, 2015). In Europe, residents
appeared to have the least positive attitudes towards immigration globally, with 52% percent
of the surveyed population indicating a need to reduce current immigration levels (IOM,
2015). Yet, a sharp divergence emerged between Northern and Southern Europe (IOM,
2015). Southern Europeans tended to display more negative attitudes towards immigration
preferring lower national immigration levels, while northern Europeans showed more positive
attitudes, favouring maintenance or an increase in current immigration levels (IOM, 2015;
Dennison and Geddes, 2019). In Northern Europe, the United Kingdom stood out as an
exception with a larger percentage of the population in favour of lower immigration levels
(IOM, 2015).
Nonetheless, anti-immigration sentiment in Europe seems to be softening. Longitudinal
data on feelings towards immigrants from Eurobarometer surveys conducted in 2014-2018
reveal a decreasing trend in anti-immigration sentiment across most European countries
(Dennison and Geddes, 2019). Though, stronger negative feelings exist towards immigrants
from non-EU nations than EU member states (Dennison and Geddes, 2019). In the United
Kingdom, a paradoxical softening in anti-immigration sentiment has taken place since the
Brexit Referendum (Schwartz et al., 2020). According to Ipsos MORI data, the share of
population agreeing that there are too many migrants has reduced from 64 percent in 2013 to
45 percent in 2017 (Blinder and Richards, 2020). Additionally, there is now a predominantly
positive perception over the impact that immigration has had on Britain (Ipsos, 2019).
While existing survey data on public opinion about immigration provide a valuable
understanding of long-term changes in attitudes towards immigration and cross-national
differences, challenges remain. Survey data are typically spatially coarse, costly and infrequent.
Existing data can be limited through slow data releases and statistical representation, especially
at small geographical units. Real-time, frequent, exhaustive and internationally spanning
information is crucial to monitor changing attitudes towards immigrants during dynamic
and fast evolving events, such as pandemics. Twitter data offers a novel source to complement
traditional data systems to cover their gaps and feed into near real-time monitoring of
immigration sentiment.
The potential of Twitter data is reflected in three key areas: (i) high geographical granu-
larity, (ii) real time temporal frequency, and (iii) global coverage. Traditional survey data are
typically available at national or administrative levels. Twitter data are individually geolocated
and can thus be aggregated at convenient geographic units of analysis best representing the
social process of concern. Twitter data also offer a high degree of temporal frequency in real
time. Twitter data are timestamped recording information across the temporal continuum,
comprising years, months, days, minutes and seconds. Such rich temporal granularity in real
time enables the tracking online discussions (Wang et al., 2012), diseases (Paul and Dredze,
2012) and natural disasters (Bruns and Liang, 2012) as well as the management of emergency
responses (Terpstra et al., 2012). Moreover, Twitter provides a worldwide repository to anal-
yse the global patterns of human mobility (Hawelka et al., 2014), misinformation (Vosoughi
et al., 2018) and emotion (Larsen et al., 2015). These promises are however impacted by key
4caveats. Only a fraction of tweets contain spatial information. Less than three percent of
tweets are geolocated (Twitter, 2021b). The global representation of Twitter data is affected
by the demographic profile of Twitter users (Leetaru et al., 2013), and censorship of Twitter
in China which the world’s most populous country. Nevertheless, Twitter data represent a
novel and valuable resource to complement traditional survey data.
3. Describing the Data and Methods Ingredients
3.1. Collecting and Engineering Twitter Data
A first key task is to collect data from Twitter. Two key elements form the data collection
strategy: (i) method of data collection; and, (ii) a clearly defined set of search terms. A first
critical step that should be considered to define an effective data collection strategy is the
method of data collection. Twitter data are collected through an application programming
interface (API). As described in Section 5, Twitter provides two different APIs, each offering
different capabilities in terms of data allowance and access. The selection of an API will thus
determine the type of data that can be accessed. The second important step is to define a clear
set of search term, to guide the content of the tweets to be retrieved. Carefully considering
the various terms that may be used to discuss a given topic is key to develop a comprehensive
search and data collection strategy.
We draw on a random sample of 1.76 million tweets from the United Kingdom covering
the start of the COVID19 pandemic, between January 15th to February 15th, 2020. This
sample comprises a sample of 22k original tweets and 1.73m retweets, reflecting the prevalence
of retweets about this topic. Data were collected via an application programming interface
(API) (Campan et al., 2019). We used Twitter’s Premium API to access historical data with a
monthly cap of 1.25 million tweets. It enables 500 tweets per request at a rate of 60 request
per minute; access to tweets, retweets, URLs, hashtags and profile geographic information;
and, a total number of 2.5k requests per month.
The data were collected based on a random sampling strategy. To maximise our monthly
API data allowance, a sampling strategy was developed to collect a sample of 1.5k tweets on
daily basis from December 1st 2019 to June 31st 2020. We generated a dataset for a larger
project to monitor immigration sentiment during the course of the COVID-19 pandemic
across five countries, including the United Kingdom (Rowe et al., 2021). We collected data
at the peak hour of daily tweet activity using a geographic bounding box. We assessed the
statistical representation of the resulting dataset, comparing sentiment scores based on four
lexicons against scores obtained from a dataset containing all daily tweets for seven full days.
The resulting sentiment scores from both datasets were consistent identifying similar daily
patterns of immigration sentiment.
To collect tweets focusing on migration, we were guided by the principles of the Campbell
policies and guidelines standards for the conduct of systematic reviews (Campbell Collabora-
tion, 2020). A key component of conducting a systematic review is planning a search strategy
5to capture relevant content. In consultation with migration experts at the International
Organization for Migration (IOM), a set of key search terms were developed, including words,
Twitter accounts and hashtags. Table 1 lists the selection of words and hashtags included in
our search terms. Twitter accounts are not displayed for privacy and confidentiality purposes.
Table 1. Search terms used for tweet data collection.
3.2. Using Sentiment Analysis
To capture immigration sentiment, we used sentiment analysis, also known as opinion mining
or emotion artificial intelligence. This refers to the use of natural language processing (NLP)
to systematically identify, measure and analyse emotional states and subjective information. It
computationally enables the polarity of text to be identified; that is, whether the underpinning
semantics of an opinion is positive, negative or neutral. Furthermore, it allows deriving
quantitative scores to identify the attitude or position on the distribution of negative or
positive terms in given a piece of text.
We specifically employed VADER (Valence Aware Dictionary and sEntiment Reasoner)
(Hutto and Gilbert, 2014). VADER is a lexicon and rule-based sentiment analysis tool which
is tailored to the analysis of sentiments expressed in social media. VADER has been shown to
perform better than eleven typical state-of-practice sentiment algorithms at identifying the
polarity expressed in tweets (Hutto and Gilbert, 2014). It overcomes limitations of existing
approaches by more appropriately handling informal text, including the use of negations,
contractions, slang, emoticons, emojis, initialisms, acronyms, punctuation and word-shape
(e.g. capitalisation) as a signal of sentiment polarity and intensity. Most commonly, lexicon-
based approaches only capture differences in sentiment polarity (i.e. positive or negative)
but do not identify differences in sentiment intensity (strongly positive versus moderately
positive) or contradictions (e.g.“Immigration is good but the current visa system is horrible”).
They have also been designed to capture sentiment in well-structured sentences, meaning
generally their lexicons do not include slang, emoticons, emojis, acronyms and capitalised
word differentiation. We note that accurate identification and scoring of sarcastic statements
remain a key challenge in natural language processing, but these statements tend to represent
a small fraction of daily tweets.
VADER provides a normalised, weighted composite score which captures the polarity and
intensity of individual tweets. The score ranges from -1 to +1, representing the most extreme
6negative to most extreme positive sentiment respectively. Intuitively, to derive the score,
VADER assigns a score to each word in a tweet, ranging from -4 (extremely negative) through
0 (neutral) to +4 (extremely positive) based on positive and negative text features identified
in the text. These scores are then aggregated and normalised to range between -1 and +1.
We used the daily average of the composite score to track the daily evolution of immigration
sentiment on Twitter. We then identified positive sentiment tweets (i.e. composite score >
0.05) and negative sentiment tweets (i.e. composite score < -0.05).
4. Gaining Valuable Insights from Twitter Data
4.1. Understanding the Distribution of Sentiment
Figure 1 displays the overall distribution of tweet sentiment scores between January 15th
to February 15th, 2020. As expected, it shows a high frequency of neutral polarity tweets
but also reveals a high prevalence of negative and positive polarity scores around -0.5/-1 or
0.5/1, indicating the existence of a very polarised discussion on issues relating to immigration.
Adding together all negative sentiment scores results in a total of 880k, which exceeds the
number of positive sentiment tweets (723k), while neutral sentiment tweets account for a small
fraction (155k). These results reflect the fact that Britain has become an increasingly divided
society on controversial issues, and immigration has featured as a key divisive topic (Blinder
and Richards, 2020), particularly prominent during the lead-up to the Brexit referendum
(Kaur-Ballagan et al., 2017). These divisions have become increasingly aligned with partisan
identities in recent years (Schwartz et al., 2020) and attributed to echo chambers – patterns
of information sharing that reinforce pre-existing beliefs by restricting exposure to opposing
political views (Bail et al., 2018). Social media is often believed to comprise a main channel
leading to selective exposure to information and political polarisation (Conover et al., 2011;
Hong and Kim, 2016).
4.2. Examining Temporal Variations
Figure a 2 shows the daily average tweet sentiment score displaying a cyclical pattern of
positive and negative sentiment, and Fig.2b reveals the sentiment intensity composition of
tweets. A first key observation from these results is that negative feelings towards immigration
do not seem to have intensified during the start of the COVID19 pandemic in the United
Kingdom. This is contrary to expectations of increased intensification of negative sentiments
towards immigration, particularly against people of Asian descent and appearance. Links
between COVID19 and China are believed to have sparked acts and displays of xenophobia
and racism against Asian people around the world (Nature, 2020). Asian international students
were reportedly subjected to racist attacks in early stages of the outbreak (Nature, 2020).
7Figure 1. Density (left) and cumulative (right) distribution of sentiment scores.
4.3. Unpacking Daily Discussions
Figure a 2 suggests that key Brexit events have driven periods of intensification in negative
sentiment. Notable periods of negative sentiment include January 15-16th 2020 (initial days
in our analysis), January 22nd-23rd, and February 3rd-8th 2020. January 15-16th coincide
with concerns raised by the European parliament on January 15th about EU citizens risking
discrimination after Brexit in seeking housing and employment (Rankin, 2020). January
22nd-23rd concur with the government’s unveiling of its post-Brexit immigration plans
(The Guardian, 2020). February 3rd-8th comprise the first working week after the United
Kingdom exited the European Union on Friday, January 31st, Trump’s impeachment acquittal
on February 5th and the indictment of multiple murder charges against an immigrant in the
United States on February 7th (Smith, D, 2020; Li, D, 2020). Figure b 2 reveals that overall
negative sentiment during these three sets of dates were driven by a rise in the percentage
of tweets with strongly negative sentiment, with relatively less tweets expressing strongly
positive sentiment. This situation contrasts with days during which relatively high percentages
of negative sentiment tweets do not seem to result in an overall day negative sentiment score,
as these tweets are counteracted by an equally large share of strongly positive sentiment
tweets, such as February 13th.
To better understand periods of rising negative sentiment, we analyse the frequency
of words during the three sets of dates identified above. We distinguished between words
associated with expressions of negative and positive feelings captured in tweets, to identify
8Figure 2. Daily evolution of tweet sentiment: (a) Average overall sentiment score. Smoothed
conditional means obtained are reported obtained via locally weighted scatterplot smoothing (loess)
using a span of 0.3. Grey background dots represent daily individual tweet sentiment scores. (b)
Percentage of sentiment scores classified into strongly negative (< -0.5), negative (-0.5 - -0.05),
neutral (-0.05 - 0,05), positive (0.05 - 0.5) and strongly positive (>0.5).
9general themes of discussion. A main advantage of Twitter data is its temporal frequency,
which enables understanding of changes in public opinion on a daily basis and the ways
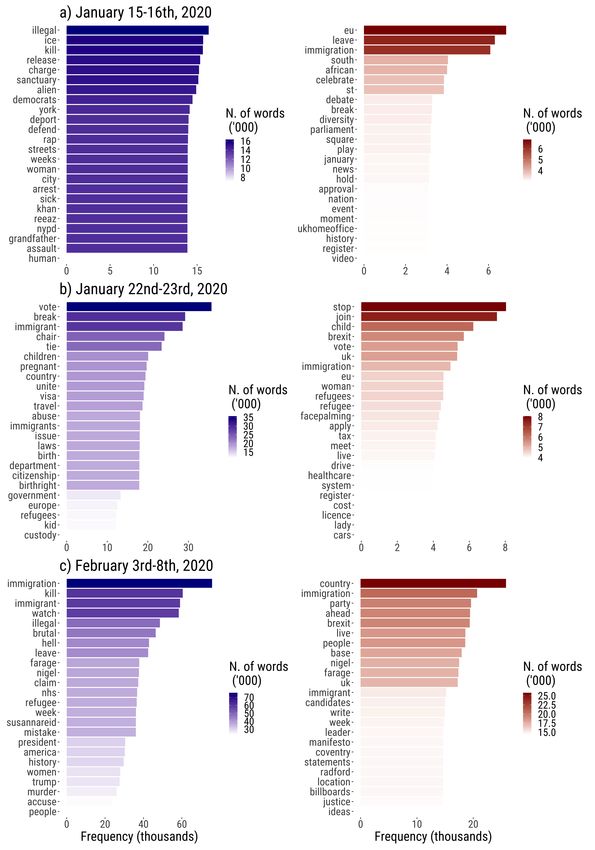
they are shaped by key events. Figure 3 displays the top 25 most frequently used words in
tweets associated with negative (red) and positive (blue) sentiment during January 15-16th,
22nd-23rd, and February 3rd-8th, 2020. Words relating COVID19 are not apparent. Crime,
the implications of Brexit and immigration policy on EU migration, refugee settlement and
human trafficking emerge as key themes from the analysis of words frequency.
Words, such as “alien”, “deport”, “kill” and “arrest” related to a criminal event represent
the prevailing negative sentiment on January 15-16th. They relate to a viral tweet shared
by more than 13.9k user involving a notorious case of assault and murder by an apparently
undocumented immigrant in the City of New York in the United States. The consequences of
Brexit for EU citizens and Britons are a prevalent topic across the three set of dates. Negative
feelings are addressed to the hard realisation of the challenges imposed by Brexit. Tweets
express the anger and frustration of EU citizens and Britons as they are expected to apply for
residency to remain in their respective host countries, where they pay taxes and own a house.
Tweets relating to Brexit also embody positive sentiment as captured in the word clouds,
celebrating the exit of the United Kingdom from the EU and how this enables the controlling
of immigration. Stringent policy on human smuggling and refugee issues are also prevalent
themes, and seem to be key triggers of both positive and negative sentiment. On January
22nd-23rd, tweets revolve around the rejection of amendments to child refugee policy by
the United Kingdom’s Government. On February 3rd-8th, they relate to temperamental
comments from people coming to the realisation of false claims made by the Leave campaign
about £350M a week becoming available for the NHS post-Brexit; Trump’s impeachment
acquittal and murder indictment of an immigrant in the United States.
5. Key Consideration for Practitioners
Understanding public attitudes towards immigration is essential in the implementation of
the Global Compact for Safe, Orderly and Regular Migration, specifically its Objective 17
– Eliminate all forms of discrimination and promote evidence-based public discourse to
shape perceptions of migration. In early stages of the COVID19 outbreak, concerns about a
rising number of racist and xenophobic incidents against individuals of Asian descendent and
appearance were reported. Lack of appropriate data have however prevented detailed analysis
of immigration sentiment since the start of the pandemic. This paper illustrates how Twitter
data can be employed to analyse immigration sentiment during the start of the COVID19
pandemic. We analysed a sample of 1.76 million tweets from the United Kingdom between
January 15th and February 15th, 2020.
While Twitter data can be a powerful resource to measure and monitor changes in public
opinion towards migrants, practitioners should carefully address key considerations:
10Figure 3. Frequent words to express negative (red) or positive (blue) sentiment. (a) January
15-16th, 2020. (b) January 22nd-23rd, 2020. (c) February 3rd-8th, 2020. The word count indicates
the number of tweet appearances. Sentiment scores < -0.05 are classified as negative. Sentiment
11
scores > 0.05 are classified as positive.• Search strategy. Collecting Twitter data on immigration is challenging. A clearly defined
search strategy is required. A wide variety of terms are used to describe issues related
to migration on Twitter. Discussions may revolve around migration as a process or
migrants themselves, and different expressions may be used. Conventional expressions,
such as “immigrants” and “migration” are often used to describe these discussions, but
less conventional expressions, like “shangainese” are also widely employed. A carefully
curated collection of search terms is needed to comprehensively cover discussion
relating to migration on social media. (Rowe et al., 2021) provide a curated list of terms
to collect social media data on migration, comprising words, hashtags and accounts in
four different languages.
• Statistical representation. Ensuring representation of the populations under study is key
to enable statistical inference. Yet, we know particular groups of the population are
over-represented in Twitter data and significant variability may exist across geographic
areas within and between countries (Leetaru et al., 2013). Additionally, as indicated in
Section 2, the spatial representation of Twitter data is limited as less than three percent
of tweets are geolocated (Twitter, 2021b). Addressing these biases is an active area of
research. Specific-case weighting schemes have been developed to ensure statistical
and spatial representation of social media data (Grow et al., 2021).
• Data allowance. While Twitter represents a global repository of virtual social interac-
tions, constraints to data accessibility exist. Twitter allows data collection via APIs.
Twitter has traditionally offered two APIs: Streaming API and Search API (Campan
et al., 2019). The Streaming API enables data collection in real time, while the Search
API is used to retrieved historical data. The Search API includes three tiers: Streaming,
Premium and Enterprise. The Standard Streaming is free and allows collecting a ran-
dom sample of recently published public tweets in the past 7 days, with coverage varying
between 1% and 40% of all tweets over time (Morstatter et al., 2013). The Premium
and Enterprise options are paid, expensive and have a monthly tweet and per-request
cap. A carefully evaluation of these data accessibility constraints is thus required to
develop an effective data collection strategy. On January 26th 2021, Twitter introduced
the Academic Research API which is expected to greatly facilitate access to data. The
Academic API is free; provides access to the full history of public conversation; and,
has a higher monthly tweet volume cap of 10 million (Twitter, 2021a).
• Building sentiment scores. Significant progress has been made on sentiment analysis,
but key challenges remain. As described in Section 3.2, VADER has contributed to
overcoming many challenges by the use of negations, contractions, slang, emoticons,
emojis, initialisms, acronyms, punctuation, word-shape and returning sentiment score
that captures the intensity of sentiment. It is not a binary score capturing positive or
negative sentiment. Yet, challenges remain. A key challenge relates to the meaning of
sentiment scores. Negative (positive) sentiment scores do not necessarily represent a
12negative (positive) comment against (in favour of) migration. A comment linked to a
negative sentiment score may contain negative expressions about visas or migration
processes but a positive opinion about migrants or migration impacts. Our results,
for instance, link migration discussions revolving around Brexit to both positive and
negative sentiment scores. A second key challenge is that most sentiment analysis
algorithms are trained on English text. Though some algorithms offer non-English
dictionaries, translation is often required. Manual translation is expensive and auto-
mated translation is not 100% accurate. However, lexicon-based sentiment analysis
algorithms like VADER perform well on automated translated text as they are trained
and assign sentiment scores on individual words (Hutto and Gilbert, 2014). Algorithms
trained on structured text, such as Stanford NLP work less accurately according to our
experimentation. A third key challenge is handling sarcasm in tweets. Lexicon-based
algorithms have difficulties in recognising sarcastic comments. As indicated above,
current algorithms are trained on individual words. Greater context may be needed
to improve the efficacy of algorithms in identifying sarcasm. This may be possible by
linking tweet replies and quotes to original tweets, but this cannot occur for original
tweets. Though, according to our experience, sarcasm normally accounts for a small
percentage of tweets and relates to image-based memes, not text.
• Ethics. Twitter data offer new opportunities but also represent key ethical challenges.
Twitter data can be described as identifiable. Regulatory frameworks and ethical
guidance are thus required to access, manage and analyse data responsibly. Traditional
institutional boards may not be suitable given the high level of technical knowledge
required to understand the potential for intrusion and individual harm of new forms
of data, and appropriate ways of data anonymisation. A principles-based approach has
been proposed for the use of digital data in the Social Sciences (Salganik, 2019); that is,
the design and application of project-specific rules in more general context of ethical
principles. A principles-based approach should help researchers make appropriate
decisions for cases where rules have not yet been written, and guide the way in which
research is communicated.
References
Atieno, O. P. (2009). An Analysis of the Strengths and Limitation of Qualitative and Quantita-
tive Research Paradigms. Problems of Education in the 21st Century, 13(1):13–18.
Bail, C. A., Argyle, L. P., Brown, T. W., Bumpus, J. P., Chen, H., Fallin Hunzaker, M. B., Lee, J.,
Mann, M., Merhout, F., and Volfovsky, A. (2018). Exposure to opposing views on social
media can increase political polarization. Proceedings of the National Academy of Sciences of
the United States of America, 115(37):9216–9221.
Bartlett, J. and Norrie, R. (2015). Immigration on Twitter: understanding public attitudes
online. Technical report.
13Blinder, D. S. and Richards, D. L. (2020). UK Public Opinion toward Immigration: Overall
Attitudes and Level of Concern. Technical report, The Migration Observatory, Oxford,
UK.
Bruns, A. and Liang, Y. E. (2012). Tools and methods for capturing twitter data during natural
disasters. First Monday.
Campan, A., Atnafu, T., Truta, T. M., and Nolan, J. (2019). Is Data Collection through Twitter
Streaming API Useful for Academic Research? In Proceedings - 2018 IEEE International Con-
ference on Big Data, Big Data 2018, pages 3638–3643. Institute of Electrical and Electronics
Engineers Inc.
Campbell Collaboration (2020). The Campbell Collaboration. Available at http://www.
campbellcollaboration.org/.
Cheong, P. H., Edwards, R., Goulbourne, H., and Solomos, J. (2007). Immigration, social
cohesion and social capital: A critical review. Critical social policy, 27(1):24–49.
Conover, M., Ratkiewicz, J., Francisco, M., Goncalves, B., Flammini, A., and Menczer, F.
(2011). Political Polarization on Twitter.
Dennison, J. and Dražanová, L. (2018). Public attitudes on migration: rethinking how people
perceive migration. Technical report.
Dennison, J. and Geddes, A. (2019). A Rising Tide? The Salience of Immigration and the
Rise of Anti-Immigration Political Parties in Western Europe. The Political Quarterly,
90(1):107–116.
European Commision (2019). 10 Trends Shaping Migration.
Freire-Vidal, Y. and Graells-Garrido, E. (2019). Characterization of local attitudes toward
immigration using social media. In The Web Conference 2019 - Companion of the World Wide
Web Conference, WWW 2019, pages 783–790. Association for Computing Machinery, Inc.
Goyder, J. (1986). Surveys on Surveys: Limitations and Potentialities. Public Opinion Quarterly,
50(1):27.
Greven, T. (2016). The rise of right-wing populism in europe and the united states. A
Comparative Perspective. Friedrich Ebert Foundation, Washington DC Office, pages 1–8.
Grigorieff, A., Roth, C., and Ubfal, D. (2020). Does Information Change Attitudes Toward
Immigrants? Demography, 57(3):1117–1143.
Grow, A., Perrotta, D., Del Fava, E., Cimentada, J., Rampazzo, F., Gil-Clavel, S., Zagheni, E.,
Flores, R. D., Ventura, I., Weber, I., et al. (2021). How reliable is facebook’s advertising data
for use in social science research? insights from a cross-national online survey. Technical
report, Max Planck Institute for Demographic Research, Rostock, Germany.
Hawelka, B., Sitko, I., Beinat, E., Sobolevsky, S., Kazakopoulos, P., and Ratti, C. (2014). Geo-
located twitter as proxy for global mobility patterns. Cartography and Geographic Information
Science, 41(3):260–271.
Hong, S. and Kim, S. H. (2016). Political polarization on twitter: Implications for the use of
social media in digital governments. Government Information Quarterly, 33(4):777–782.
14Hutto, C. and Gilbert, E. (2014). VADER: A Parsimonious Rule-Based Model for Sentiment
Analysis of Social Media Text. Eighth International Conference on Weblogs and Social Media
(ICWSM-14), 81:82.
IOM (2015). How the World Views Migration. International Organization
for Migration. Available at https://publications.iom.int/books/
how-world-views-migration.
IOM (2020). Surveys measuring public opinion on migration. International Organization
for Migration. Available at https://migrationdataportal.org/infographic/
surveys-measuring-public-opinion-migration.
Ipsos (2019). Attitudes towards immigration. Survey conducted on behalf of IMiX. Avail-
able at https://www.ipsos.com/sites/default/files/ct/news/documents/
2019-03/public-attitudes-towards-immigration-survey-for-imix.pdf.
[online; accessed 09-December-2020].
Kaur-Ballagan, K., Gottfried, G., and Aslaksen, A. P. (2017). Shifting Ground: Attitudes
towards immigration and Brexit.
Larsen, M. E., Boonstra, T. W., Batterham, P. J., O’Dea, B., Paris, C., and Christensen, H. (2015).
We feel: mapping emotion on twitter. IEEE journal of biomedical and health informatics,
19(4):1246–1252.
Leetaru, K., Wang, S., Cao, G., Padmanabhan, A., and Shook, E. (2013). Mapping the global
twitter heartbeat: The geography of twitter. First Monday.
Li, D (2020). Texas man charged with killing 12 women, police look at 750 other deaths for
possible links. NBCNews. Available at https://nbcnews.to/2IQwNHW.
McCormick, T. H., Lee, H., Cesare, N., Shojaie, A., and Spiro, E. S. (2017). Using Twitter
for Demographic and Social Science Research: Tools for Data Collection and Processing.
Sociological Methods & Research, 46(3):390–421.
Morstatter, F., Pfeffer, J., Liu, H., and Carley, K. M. (2013). Is the sample good enough?
comparing data from twitter’s streaming api with twitter’s firehose. In Seventh international
AAAI conference on weblogs and social media.
Nature (2020). Stop the coronavirus stigma now. Nature, 580(7802):165.
Paul, M. J. and Dredze, M. (2012). A model for mining public health topics from twitter.
Health, 11(16-16):1.
Penninx, R., Spencer, D., Van Hear, N., et al. (2008). Migration and integration in europe: The
state of research. Swindon, UK: Economic and Social Research Council.
Rankin, J. (2020). Migration: EU praises Greece as ’shield’ after Turkey opens border.
Rowe, F., Mahony, M., Graells-Garrido, E., Rango, M., and Sievers, N. (2021). Using twitter
to track immigration sentiment during early stages of the covid-19 pandemic. In review at
Data and Policy.
Salganik, M. J. (2019). Bit by bit: Social research in the digital age. Princeton University Press.
Schwartz, C., Simon, M., Hudson, D., and Van-Heerde-Hudson, J. (2020). A populist paradox?
how brexit softened anti-immigrant attitudes. British Journal of Political Science, pages 1–21.
Sehl, K. (2020). Top Twitter Demographics That Matter to Social Media Marketers.
15Smith, D (2020). Trump impeachment. Trump’s acquittal offers glimpse of America’s implod-
ing empire. The Guardian. Available at https://bit.ly/3nG81cy.
Terpstra, T., Stronkman, R., de Vries, A., and Paradies, G. L. (2012). Towards a realtime twitter
analysis during crises for operational crisis management. In Iscram.
The Guardian (2020). The Observer view on the government’s immigration plans, Observer
editorial. Available at https://bit.ly/3f3Ywkx.
Twitter (2021a). Tools: Enabling the future of academic research with the Twitter API. Avail-
able at https://blog.twitter.com/developer/en_us/topics/tools/2021/
enabling-the-future-of-academic-research-with-the-twitter-api.
[online; accessed 29-June-2021].
Twitter (2021b). Tutorials: Tweet Geospatial Metadata. Available at https://developer.
twitter.com/en/docs/tutorials/tweet-geo-metadata. [online; accessed 29-
June-2021].
Vosoughi, S., Roy, D., and Aral, S. (2018). The spread of true and false news online. Science,
359(6380):1146–1151.
Wang, H., Can, D., Kazemzadeh, A., Bar, F., and Narayanan, S. (2012). A system for real-time
twitter sentiment analysis of 2012 us presidential election cycle. In Proceedings of the ACL
2012 system demonstrations, pages 115–120.
Wikipedia (2020a). COVID-19 pandemic cases. Available at https://en.wikipedia.org/
wiki/COVID-19_pandemic_cases.
Wikipedia (2020b). List of incidents of xenophobia and racism related to the COVID-19
pandemic. Available at https://en.wikipedia.org/wiki/List_of_incidents_
of_xenophobia_and_racism_related_to_the_COVID-19_pandemic.
16You can also read