Generating seamless global daily AMSR2 soil moisture (SGD-SM) long-term products for the years 2013-2019 - ESSD
←
→
Page content transcription
If your browser does not render page correctly, please read the page content below
Earth Syst. Sci. Data, 13, 1385–1401, 2021
https://doi.org/10.5194/essd-13-1385-2021
© Author(s) 2021. This work is distributed under
the Creative Commons Attribution 4.0 License.
Generating seamless global daily AMSR2 soil moisture
(SGD-SM) long-term products for the years 2013–2019
Qiang Zhang1 , Qiangqiang Yuan2,3 , Jie Li2 , Yuan Wang2 , Fujun Sun4 , and Liangpei Zhang1
1 State Key Laboratory of Information Engineering, Survey Mapping and Remote Sensing,
Wuhan University, Wuhan, China
2 School of Geodesy and Geomatics, Wuhan University, Wuhan, China
3 Key Laboratory of Geospace Environment and Geodesy, Ministry of Education,
Wuhan University, Wuhan, China
4 Beijing Electro-mechanical Engineering Institute, Beijing, China
Correspondence: Qiangqiang Yuan (qqyuan@sgg.whu.edu.cn) and Liangpei Zhang (zlp62@whu.edu.cn)
Received: 19 November 2020 – Discussion started: 23 November 2020
Revised: 1 March 2021 – Accepted: 1 March 2021 – Published: 31 March 2021
Abstract. High-quality and long-term soil moisture products are significant for hydrologic monitoring and agri-
cultural management. However, the acquired daily Advanced Microwave Scanning Radiometer 2 (AMSR2) soil
moisture products are incomplete in global land (just about 30 %–80 % coverage ratio), due to the satellite orbit
coverage and the limitations of soil moisture retrieval algorithms. To solve this inevitable problem, we develop a
novel spatio-temporal partial convolutional neural network (CNN) for AMSR2 soil moisture product gap-filling.
Through the proposed framework, we generate the seamless daily global (SGD) AMSR2 long-term soil moisture
products from 2013 to 2019. To further validate the effectiveness of these products, three verification methods
are used as follows: (1) in situ validation, (2) time-series validation, and (3) simulated missing-region validation.
Results show that the seamless global daily soil moisture products have reliable cooperativity with the selected
in situ values. The evaluation indexes of the reconstructed (original) dataset are a correlation coefficient (R)
of 0.685 (0.689), root-mean-squared error (RMSE) of 0.097 (0.093), and mean absolute error (MAE) of 0.079
(0.077). The temporal consistency of the reconstructed daily soil moisture products is ensured with the origi-
nal time-series distribution of valid values. The spatial continuity of the reconstructed regions is in accordance
with the spatial information (R: 0.963–0.974, RMSE: 0.065–0.073, and MAE: 0.044–0.052). This dataset can
be downloaded at https://doi.org/10.5281/zenodo.4417458 (Zhang et al., 2021).
1 Introduction (SMAP), Soil Moisture and Ocean Salinity (SMOS) among
others (McColl et al., 2017; Ma et al., 2019). Nevertheless,
the acquired daily soil moisture products are always incom-
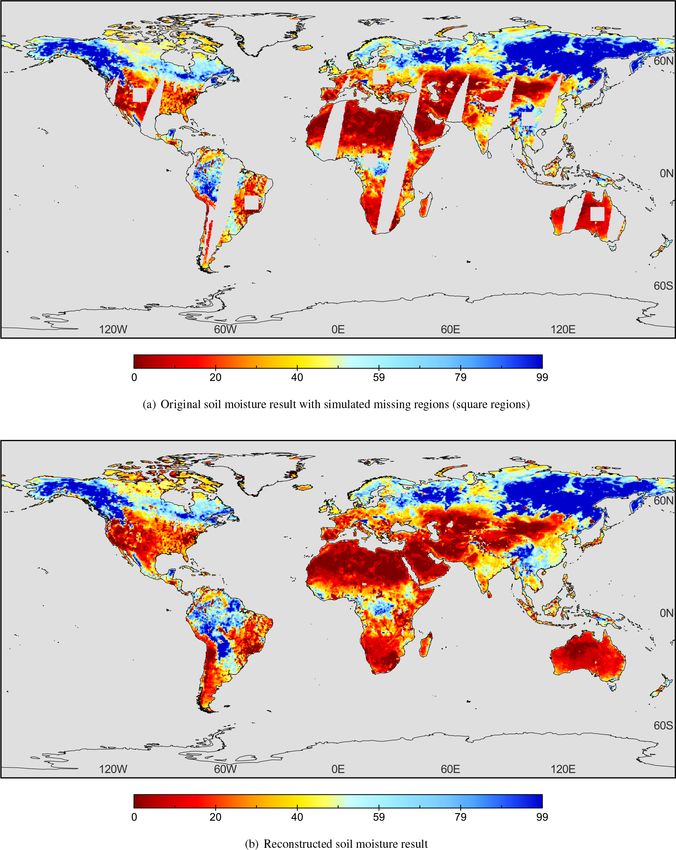
Surface soil moisture is a crucial Earth land characteristic plete in global land (see Fig. 1a, about 30 %–80 % missing
in describing the hydrologic cycle system (Wigneron et al., ratio in AMSR2), because of the satellite orbit coverage and
2003; Lievens et al., 2015). It can be applied for monitoring the limitations of soil moisture retrieval algorithms (Cho et
droughts and floods in agriculture (Samaniego et al., 2018) al., 2017; Long et al., 2019). The invalid land regions re-
and geologic hazards (Long et al., 2014). To obtain the global fer to areas with a gap or missing information. Especially
and high-frequency soil moisture products, many active or in the regions close to the Equator, or in the permafrost re-
passive satellite sensors have been launched, such as the Ad- gion, the degree of missing soil moisture data is more seri-
vanced Microwave Scanning Radiometer for Earth Observ- ous (Zeng et al., 2015; Santi et al., 2018). This phenomenon
ing System (AMSR-E), Advanced Microwave Scanning Ra- greatly disturbs subsequent soil moisture applications, espe-
diometer 2 (AMSR2), and Soil Moisture Active and Passive
Published by Copernicus Publications.
1386                                                                 Q. Zhang et al.: Generating SGD-SM AMSR2 products

cially for the consecutive daily temporal analysis and global     For example, Zhu et al. (2011) proposed the multi-temporal
spatial distribution comparisons (Colliander et al., 2017; Liu    neighbouring-homologous-value padding method for thick
et al., 2019).                                                    cloud removal. Chen et al. (2011) presented an effective
   To reduce this negative effect, most existing works em-        interpolating algorithm for recovering the invalid regions
ployed the strategy of multi-temporal soil moisture data          in Landsat images. Zhang et al. (2018a) built an integra-
selection, multi-temporal soil moisture data averaging, or        tive spatio-temporal spectral network for missing data recon-
multi-temporal soil moisture data synthesis. Detailed de-         struction in multiple tasks.
scriptions and analyses of these three strategies (Al Bitar et       In terms of the soil moisture product gap-filling, sev-
al., 2017) are presented as follows.                              eral methods have also been proposed to address this is-
                                                                  sue. Wang et al. (2012) presented a penalised least-square
 1. Multi-temporal soil moisture data selection. The crite-
                                                                  regression-based approach for global satellite soil moisture
    rion of this strategy denotes selection of the highest cov-
                                                                  gap-filling observation. Fang et al. (2017) introduced a long
    erage regions on a single date from multi-temporal soil
                                                                  short-term-memory network to generate a spatially complete
    moisture products (Wang and Qu, 2009). However, this
                                                                  overlay SMAP in the US. Long et al. (2019) fused multi-
    assumption can only deal with local regions and is not
                                                                  resolution soil moisture products, which can produce daily
    applicable for global regions. The main reason is that
                                                                  fine-resolution data in local regions. Llamas et al. (2020)
    almost all the global daily soil moisture products suf-
                                                                  used geostatistical techniques and a multiple regression strat-
    fer from the defect of missing satellite orbit coverage
                                                                  egy to get spatially complete results of satellite-derived prod-
    and failure of the retrieval algorithm. Multi-temporal
                                                                  ucts. Overall, there are few works for soil moisture recon-
    soil moisture data selection strategy greatly reduces the
                                                                  struction on global and daily scales.
    data utilisation and is not qualified for dense time-series
                                                                     In spatial dimension, the invalid land areas and adjacent
    analysis at daily temporal resolution (Liu et al., 2020;
                                                                  valid land areas show spatial consistency and spatial corre-
    Purdy et al., 2018).
                                                                  lation for daily soil moisture products (Long et al., 2020). In
 2. Multi-temporal soil moisture data averaging. This strat-      temporal dimensions, the daily time-series changing curve of
    egy is commonly used for most soil moisture studies or        the same point natively appears with continuous and smooth
    applications. The incomplete soil moisture products are       peculiarities (Chan et al., 2018). Overall, these methods can
    overall averaged as the monthly, quarterly, and yearly        effectively fill the gaps of soil moisture products. How-
    results to generate the complete products (Jalilvand et       ever, these methods cannot simultaneously take both spatial
    al., 2019). For most applications and spatial analysis,       and temporal information into consideration. In addition, the
    this operation can effectively improve the spatial soil       daily soil moisture products on a global scale have not been
    moisture coverage (Zhao et al., 2020). However, it dis-       exploited up to now.
    tinctly sacrifices the high-frequency temporal resolu-           Therefore, how about simultaneously extracting both spa-
    tion as low-frequency temporal resolution, which also         tial and temporal features for seamless global daily soil mois-
    severely reduces the data utilisation. In addition, it ig-    ture product gap-filling? Recently, deep learning has gradu-
    nores the unique spatial distribution of a single day         ally revealed the potential for remote sensing products pro-
    and loses the dense time-series changing information.         cessing (Chen et al., 2021). In consideration of the powerful
    In other words, the monthly, quarterly, and yearly soil       feature expression ability via deep learning, can we utilise
    moisture data averaging operations damage the initial         spatio-temporal information to generate long-term soil mois-
    information on both spatial and temporal dimensions.          ture products?
                                                                     From these perspectives, a novel spatio-temporal deep
 3. Multi-temporal soil moisture data synthesis. Different
                                                                  learning framework is proposed for global daily AMSR2
    from soil moisture data selection and averaging, this
                                                                  soil moisture products gap-filling. By means of the pro-
    strategy employs the time-series daily soil moisture data
                                                                  posed method, we can effectively break through the above-
    and selects the valid observed value from correspond-
                                                                  mentioned limitations. And finally, this work generates the
    ing time-series pixels. This strategy can produce syn-
                                                                  seamless global daily AMSR2 soil moisture long-term prod-
    thesis results through valid single points, while it ig-
                                                                  ucts from 2013 to 2019. The main innovations are sum-
    nores the local spatial correlation and contains discon-
                                                                  marised below.
    tinuous and inconsistent effects in local regions. In ad-
    dition, it also sacrifices high temporal resolution just as
                                                                   1. We develop a deep 3D partial reconstruction model,
    the multi-temporal data averaging strategy does (Peng
                                                                      which can take both the spatial and temporal informa-
    et al., 2017; Sun et al., 2020).
                                                                      tion into consideration. Aiming at the invalid or coast-
To overcome the above-mentioned limitations, some                     line region boundary, the 3D partial CNN and global–
missing-value reconstruction methods have been developed              local loss function are presented for better extracting
in particular for multi-temporal images, thick cloud re-              the valid region features and ignoring the invalid regions
moval, and deadline gap-filling (Q. Zhang et al., 2020a).             through both soil moisture data and mask information.

Earth Syst. Sci. Data, 13, 1385–1401, 2021                                        https://doi.org/10.5194/essd-13-1385-2021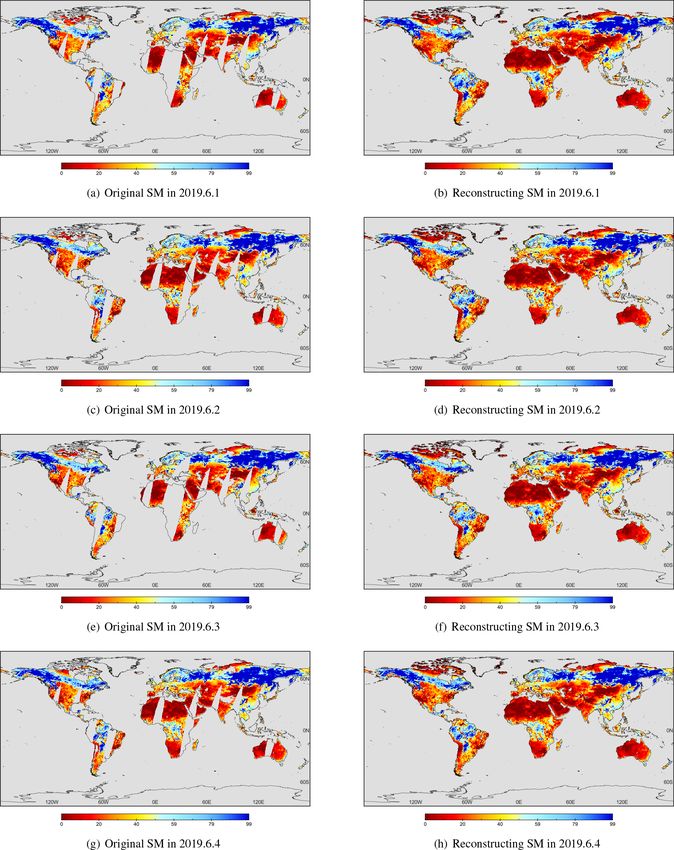
Q. Zhang et al.: Generating SGD-SM AMSR2 products 1387
2. A seamless global daily (SGD) AMSR2 soil mois- et al., 2020), the acquired AMSR2 daily soil moisture prod-
ture long-term (2013–2019) dataset is generated ucts are always incomplete in global land (about 30 %–80 %
through the proposed model. The dataset includes invalid ratio, excluding Antarctica and most of Greenland),
the original and reconstructed soil moisture data. as shown in Fig. 1a. The daily global land coverage ratio of
These SGD products could be directly downloaded at AMSR2 soil moisture data in 2019 is listed in Fig. 2. Dis-
https://doi.org//10.5281/zenodo.4417458 (Zhang et al., tinctly, the global land coverage ratio is low in wintertime
2021). and high in summertime. The mean global land coverage
ratio in 2019 is just about 56.5 % in AMSR2 soil moisture
3. Three verification strategies are employed to evidence daily products. Apparently, these incomplete soil moisture
the precision of our SGD soil moisture dataset as fol- data cannot be directly applied for subsequent spatial and
lows: in situ validation, time-series validation, and sim- time-series analysis, as mentioned in the previous Sect. 1.
ulated missing-region validation. Evaluation indexes
demonstrate that the seamless global daily AMSR2 soil
moisture dataset shows high accuracy, reliability, and 2.2 International Soil Moisture Network in situ data
robustness. The International Soil Moisture Network (ISMN) was es-
tablished from 2009 to now (Dorigo et al., 2011), provid-
The schema of this work is listed below. Section 2 describes
ing the correction and validation schemes for remote sens-
the ASMR2 soil moisture products and in situ soil mois-
ing satellite-based soil moisture retrieval. ISMN includes the
ture network data. Section 3 presents the methodology for
globally distributed in situ soil moisture sites supported by
generating the seamless global daily AMSR2 soil moisture
the earth observation of the European Space Agency (ESA)
products. Section 4 gives the experimental results and re-
and many voluntary contributions of researchers and organi-
lated validation results. The comparisons between the time-
sations from all over the world (Dorigo et al., 2012, 2013).
series averaging method and proposed method are discussed
The ISMN in situ surface soil moisture values could be
in Sect. 5. Finally, Sect. 7 lists the conclusions of this study.
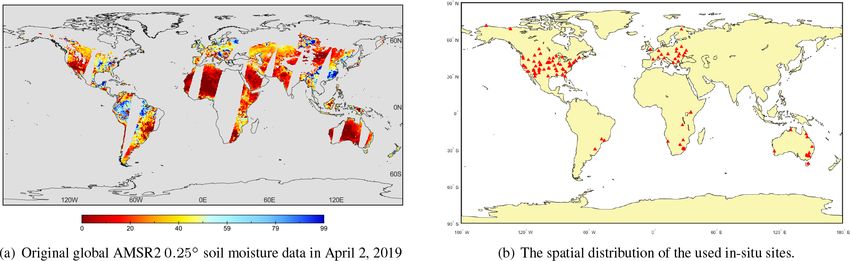
acquired through https://ismn.geo.tuwien.ac.at (last access:
21 July 2020). In our experiments, we selected a portion of
2 Data description in situ soil moisture sites of ISMN as ground truth values
(Zhang et al., 2017), to testify the precision and credibility of
2.1 AMSR2 soil moisture products the reconstructed datasets in Sect. 4.2. The spatial distribu-
In consideration of the global coverage, temporal resolu- tion of the used in situ sites is depicted in Fig. 1b. It should be
tion, and current availability, we select AMSR2 soil mois- noted that the time range is restrained from 1 January 2013
ture products as the focus of this study. This sensor was on to 31 December 2019. Then the daily soil moisture values
board on the Global Change Observation Mission 1-Water are matched with the in situ sites in the same location. Two
(GCOM-W1) satellite, launched in May 2012 (Kim et al., neighbouring in situ hourly values are averaged as the ulti-
2015). The released datasets include three passive microwave mate result of the current date (Dong et al., 2020).
band frequencies: 6.9 GHz (C1 band), 7.3 GHz (C2 band,
new frequency compared with AMSR-E), and 10.7 GHz (X 3 Methodology
band). It can observe the global land two times within a
day (Wu et al., 2016): ascending (day-time) and descend- The flow chart of the presented framework is depicted in
ing (night-time, about 00:00–01:00 of the local time) orbits. Fig. 3. The overall structure could be divided into two stages:
The primary spatial resolution of this dataset denotes 0.25◦ the training procedure and testing procedure. Firstly, we des-
global grids. And the AMSR2 soil moisture retrieval algo- ignate the processing daily soil moisture data on date T and
rithms include the Land Parameter Retrieval Model (LPRM) simultaneously select its adjacent time-series data before and
and Japan Aerospace Exploration Agency (JAXA) (Du et al., after 4 d (date T −4 to T +4). The corresponding land masks
2017; Kim et al., 2018). The error of soil moisture for each of these daily soil moisture data are generated through the in-
frequency was also given in AMSR2 products. valid pixel marking.
In our study, we choose LPRM AMSR2 descending level In the training procedure, these spatio-temporal soil mois-
3 (L3) global daily 0.25◦ soil moisture products as the ture data and land mask patch groups are imported as the
study data. To avoid introducing additional error and un- training data of the presented spatio-temporal 3-D recon-
certainty, we did not carry out the downscaling operation struction model through patch selection and mask simula-
of the generated SGD-SM products. This dataset was ob- tion. The convergence condition denotes that the loss of
tained from https://hydro1.gesdisc.eosdis.nasa.gov/ (last ac- the proposed model gradually decreases and finally remains
cess: 18 June 2020). For instance, the original AMSR2 0.25◦ smooth in the training procedure through back-propagation
soil moisture data in 2 April 2019 are displayed in Fig. 1a. (BP) in Fig. 3. Then in the testing procedure, seamless
Due to the satellite orbit coverage and limitations of soil global daily reconstruction soil moisture data are outputted
moisture retrieving algorithms in tundra areas (Muzalevskiy through the convergent model. Subsequently, the next daily
https://doi.org/10.5194/essd-13-1385-2021 Earth Syst. Sci. Data, 13, 1385–1401, 2021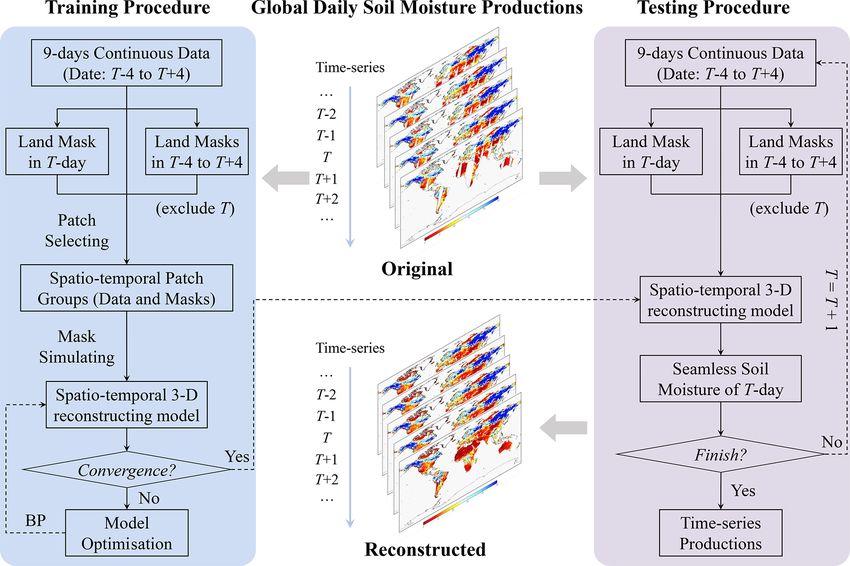
1388                                                                       Q. Zhang et al.: Generating SGD-SM AMSR2 products

Figure 1. AMSR2 soil moisture product and selected in situ soil moisture sites.

                                                                        spatio-temporal feature for data reconstruction and model
                                                                        optimisation. The structure and details are depicted in Fig. 4.
                                                                           This network includes 11 layers (3D partial CNN unit and
                                                                        ReLU (rectified linear unit)) in Fig. 4. The size of 3D filters
                                                                        is all set as 3 × 3 × 3. The number of feature maps before 10
                                                                        layers is fixed as 90, and the channel of the feature map in
                                                                        the final layer is exported as 1. It should be noted that after
                                                                        finishing each partial 3D-CNN layer, we must update all the
                                                                        new masks for the next layer. The mask updating operation
                                                                        is defined in Sect. 3.2. In terms of the model training and op-
                                                                        timisation, three steps, patch selecting, mask simulating, and
                                                                        back propagation, are performed in Sect. 3.3. Detailed tech-
                                                                        nique descriptions of the network implementation are pro-
Figure 2. The daily global land coverage ratio of AMSR2 soil            vided in the Supplement. For network optimisation, we take
moisture products in 2019.                                              the global loss and local loss into consideration. As described
                                                                        in Fig. 3, this deep reconstruction model needs to learn with
                                                                        large training label samples, before the testing procedure for
processing soil moisture data are designated and the above-             outputting global seamless daily soil moisture products. The
mentioned steps are repeated, until all the daily data are se-          global land mask and the mask on the current date T are also
rially reconstructed in order. Details of the reconstruction            employed for the global loss and local loss in Fig. 4. Descrip-
model and network are described below.                                  tions of partial 3D-CNN and model optimisation are demon-
                                                                        strated in Sect. 3.2 and 3.3, respectively.

                                                                        3.2   Partial convolutional neural network
3.1    Spatio-temporal 3-D reconstruction model
                                                                        Deep convolution neural network have been widely applied
The spatio-temporal soil moisture reconstruction model is               for nature image reconstruction (Liu et al., 2018a; Yeh et al.,
displayed in Fig. 4. After assigning the original soil mois-            2017; Liu et al., 2019) and satellite imagery recovery (Yuan
ture data on date T , time-series soil moisture data and corre-         et al., 2019; Zhang et al., 2019; Q. Zhang et al., 2020b). Nev-
sponding masks on dates T − 4 to T + 4 are simultaneously               ertheless, it should be highlighted that valid and invalid pix-
imported as the 3D-tensor inputs of the presented deep recon-           els simultaneously exist, especially around coastal regions
struction model in Fig. 4. In the spatial dimension, missing            and gap regions (Pathak et al., 2016). The common CNN ig-
and non-missing areas contain spatial consistency in daily              nores the location information of invalid or valid pixels in
soil moisture data. In the temporal dimension, the daily time-          soil moisture data, which cannot eliminate the invalid infor-
series changing curve of the same point natively appears with           mation (Liu et al., 2018b). Therefore, to solve this negative
the continuous and smooth peculiarities. Therefore, the 3D              effect, we have developed the partial 3D-CNN to ignore the
CNN is employed to process the spatio-temporal soil mois-               invalid information in the proposed reconstruction model.
ture data in this model. In this way, we can jointly utilise
both spatial and temporal information of these time-series
soil moisture products. Further, it can better exploit the deep

Earth Syst. Sci. Data, 13, 1385–1401, 2021                                              https://doi.org/10.5194/essd-13-1385-2021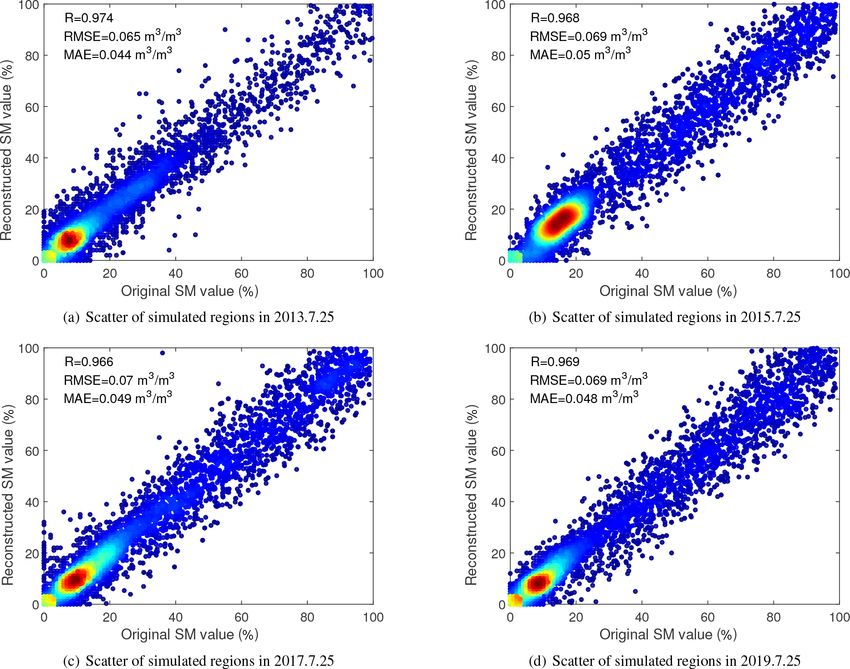
Q. Zhang et al.: Generating SGD-SM AMSR2 products                                                                                       1389

Figure 3. Flow chart of the presented framework.

Figure 4. Spatio-temporal soil moisture 3D reconstruction model.

   Before introducing the partial convolution, the operation       convolution:
of common convolution can be defined as below:
                                                                   x0 =
       T
                                                                   (
x = W X + b,                                                 (1)                               k1       k
                                                                     WT (X(w,h,t)   M(w,h,t) ) kM(w,h,t) k1 + b,   M(w,h,t) 1 6 = 0 ,    (2)
                                                                                                  (w,h,t) 1
                                                                                      0,                            otherwise
where X denotes the input tensor data. W and b are the
weight and bias parameters, respectively. Different from the       where stands for the pixel-wise multiplication. w, h, and t
common convolution, the mask information M of the cor-             refer to the width, height, and temporal number of the input
responding soil moisture data is introduced into the partial       data, respectively. 1 denotes the identical dimension tensor

https://doi.org/10.5194/essd-13-1385-2021                                           Earth Syst. Sci. Data, 13, 1385–1401, 2021
1390                                                                    Q. Zhang et al.: Generating SGD-SM AMSR2 products

with mask M, whose elements are all a value of 1. Obvi-              (label) is simulated as the incomplete patch (data) through
ously, the partial convolutional output x 0 is only decided by       the above mask. And the original corresponding mask of this
the valid soil moisture pixels of input X, rather than the in-       patch also needs to be replaced. After traversing and building
valid soil moisture pixels. Through the mask M, we can ef-           the label data 3D spatio-temporal patch groups, this dataset
fectively exclude the interference information of invalid soil       is set as the training sample for use of the reconstruction net-
moisture pixels such as marine regions and gap regions. Then         work in Fig. 3.
the scaling divisor in Eq. (2) further adjusts for the variational       In the back propagation step, we need a loss function to it-
number of valid soil moisture pixels.                                eratively optimise the learning parameters of the deep recon-
   After finishing each partial convolution layer, all the masks     struction network. This operation follows the chain rule in
need to be updated through the following rule: if the partial        model optimising. The Euclidean loss function is employed
convolution can generate at least one valid value of the output      in most data reconstruction or regression issues based on
result, then we mark this location as a valid value in the new       deep learning, such as satellite product downscaling (Fang
masks. This updating operation is demonstrated as below:             et al., 2020) and retrieval (Lee et al., 2019). Nevertheless,
                                                                    Euclidean loss function only pays attention to the holistic in-
               Land(w,h) · 1,    M(w,h,t) 1 6 = 0
m0 (w,h,t) =                                      ,            (3)   formation bias for network optimisation. It ignores the soil
                    0,             otherwise                         moisture particularity of the local areas, especially in lo-
where Land(w,h) is the global land mask at the location (w, h)       cal coastal, mountain, and hinterland regions. However, this
of the global soil moisture product. This global land mask           particularity is extremely significant for invalid region gap-
covers six continents and excludes Antarctica and most of            filling, because of the spatial heterogeneity in soil moisture
Greenland.                                                           products. Therefore, to take both the global consistency and
                                                                     local soil moisture particularity into consideration, the global
                                                                     land mask and current mask on date T are both employed af-
3.3    Model training and optimisation
                                                                     ter the final layer as shown in Fig. 3. Further, the reconstruc-
As shown in Fig. 3, the training procedure needs to generate         tion network presents the local and global two-norm loss as
large numbers of training samples for learning the proposed          below:
spatio-temporal 3-D reconstruction model in Fig. 4. Different
from the testing procedure, the training procedure addition-         ζlocal = k(1 − MT )      (SMrec − SMori )k22 ,                (4)
ally contains the patch selection, mask simulation, and back         ζglobal = kMG      (SMrec − SMori )k22 ,                      (5)
propagation (BP) steps. These three steps are significant for
model training and optimisation. The purpose of the patch            where MT stands for the current mask patch on date T . MG
selection and mask simulation steps in Fig. 3 is to establish        represents the corresponding global land mask patch. SMrec
the label (complete) data (incomplete) training samples in the       and SMori denote the reconstructed soil moisture patch and
deep learning framework. The significance of the BP step in          original seamless soil moisture patch, respectively. The uni-
Fig. 3 is to optimise the reconstruction network in Fig. 4 and       fied loss function of the reconstruction network combines
acquire the loss convergence model for testing use.                  ζlocal and ζglobal as below:
   In the patch selection step, we traverse the global regions
on date T to select the complete soil moisture patch label,          ζ (2) = ζlocal + η · ζglobal ,                                (6)
whose local land regions are undamaged. It should be noted
the other incomplete patches on date T are excluded be-              where 2 refers to the learnable arguments for each layer of
cause they cannot participate in the supervised learning. The        the deep reconstruction model. η denotes the balancing fac-
corresponding time-series soil moisture patches of this se-          tor to adjust the ζlocal and ζglobal . In this work, we fixed this
lected patch between date T − 4 and T + 4 are set as the             factor as 0.1 during the training procedure.
spatio-temporal 3D data patch groups. And their correspond-             After building up this unified loss function, the presented
ing masks between dates T −4 and T +4 are set as the spatio-         reconstruction model employs the Adam algorithm as the
temporal 3D mask patch groups. After traversing the origi-           gradient descent strategy. The number of batch sizes in this
nal global daily AMSR2 soil moisture products from 2013 to           model is fixed as 128 for network training (Shi et al., 2020).
2019, we finally establish the spatio-temporal data and mask         The total epochs and initial learning rate are determined as
patch groups with 276 488 patches. The soil moisture patch           300 and 0.001, respectively. Starting every 30 epochs, the
size is fixed as 40 × 40 for patch selection.                        learning rate is degraded through a decay coefficient of 0.5
   In the mask simulation step, 10 000 patch masks of the            (Zhang et al., 2018b). The training and testing procedure of
size 40×40 are chosen from the global AMSR2 soil moisture            the proposed model are implemented by the PyTorch plat-
masks from 2013 to 2019. The missing ratio range of these            form. The software environment is listed as follows: Python
masks is set as [0.3, 0.7]. Then these patch masks are ran-          3.7.4 language, Windows 10 operating system, and PyCharm
domly selected for label patch use within the spatio-temporal        2019 integrated development environment (IDE). The final
data and mask patch groups. The complete patch on date T             soil moisture products are exported as a hierarchical data for-

Earth Syst. Sci. Data, 13, 1385–1401, 2021                                             https://doi.org/10.5194/essd-13-1385-2021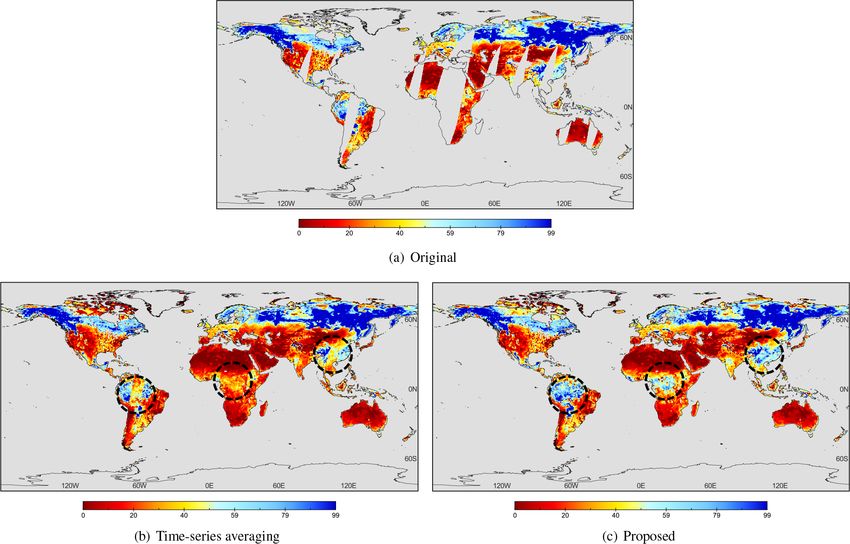
Q. Zhang et al.: Generating SGD-SM AMSR2 products                                                                            1391

mat, which contains both the original and reconstructed soil       Table 1. Comparisons between original and reconstructed soil
moisture data.                                                     moisture products.

                                                                          Soil moisture products       Evaluation index
4     Experimental results and validation
                                                                                                       R    RMSE     MAE
In this section, we provide the experimental results and
                                                                          Original                 0.689     0.093   0.077
related validation results to testify the availability of the             Reconstructed            0.685     0.097   0.079
presented framework. Through this framework, we finally
generate the seamless global daily AMSR2 soil mois-
ture long-term products from 1 January 2013 to 31 De-
cember 2019. The daily soil moisture products are saved            their adjacent valid regions in Figs. 5 and 6. Especially
in NetCDF4 format. This dataset can be directly down-              around the high-value areas and low-value areas, the spa-
loaded at https://doi.org/10.5281/zenodo.4417458 (Zhang et         tial information is consecutive without obvious reconstruc-
al., 2021) for free use. Codes are released at https://github.     tion boundary effects such as in Africa, Australia, and Eu-
com/qzhang95/SGD-SM (last access: 27 February 2021).               rope in Figs. 5 and 6.
   We firstly give two sample seamless reconstruction results         From the temporal dimension, although the incomplete
of global time-series soil moisture products. The original and     time-series daily results are highly similar and correlative,
reconstructed results are both given for comparisons. Later,       there are still some variations and differences between each
to further validate the effectiveness of these products, three     other. The proposed method performs well when preserving
verification methods are employed as follows:                      consistent temporal information and predicting specific tem-
                                                                   poral information in Figs. 5 and 6.
    1. in situ validation,

    2. time-series validation, and                                 4.2   In situ validation

                                                                   In situ shallow-depth soil moisture sites can be employed as
    3. simulated missing-region validation.
                                                                   the ground truth to validate the reconstructed satellite soil
In situ validation is utilised to compare the reconstructed soil   moisture products. We select 113 soil moisture stations (0–
moisture with original AMSR2 soil moisture through the se-         5 cm) through ISMN between 1 January 2013 and 31 De-
lected in situ sites from the spatial prospect. In situ shallow-   cember 2019. Nine in situ soil moisture sites and the corre-
depth soil moisture sites can be employed as the ground truth      sponding reconstruction data within invalid regions are then
to validate the reconstruction satellite soil moisture prod-       contrasted as the scatter plots in Fig. 7a–i, respectively. The
ucts. Time-series validation is employed for evaluating the        horizontal axis stands for the in situ soil moisture value.
time-series continuity from the temporal prospect. Soil mois-      Meanwhile the vertical axis represents the reconstructed soil
ture time-series scatter can obviously reveal the annual peri-     moisture value. It should be highlighted that due to the lack
odic variations for time-series validation. Simulated missing-     of recorded data between 2013 and 2019, most in situ val-
region validation is used to evidence the soil moisture con-       ues are incomplete with different point numbers. As shown
sistency from the spatial prospect. It can verify the spatial      in Fig. 7a–i, the correlation coefficient (R) indexes are dis-
consistency between the valid and invalid soil moisture re-        tributed between 0.679 and 0.754. The root-mean-square er-
gions.                                                             ror (RMSE) and mean absolute error (MAE) indexes are dis-
                                                                   tributed from 0.026 to 0.134 and from 0.021 to 0.107, respec-
                                                                   tively.
4.1     Experimental results
                                                                      In addition, we compare the reconstructed with original
As displayed in Figs. 5a–h and 6a–h, original and recon-           AMSR2 soil moisture products through the selected 113 in
structed global daily time-series AMSR2 soil moisture prod-        situ sites, as listed in Table 1. The averaged R, RMSE, and
ucts between 1–4 June 2019 and 1–4 October 2016 are given          MAE of the original and reconstructed soil moisture prod-
as the sample results, respectively. The left column lists         ucts are 0.685 (0.689), 0.097 (0.093), and 0.079 (0.077), re-
the original incomplete soil moisture results, and the right       spectively. Overall, the accuracy of reconstructed soil mois-
column lists the corresponding complete soil moisture re-          ture products is generally accorded with the original prod-
sults after reconstruction by the proposed method from 1 to        ucts. The differences of these indexes R, RMSE, and MAE
4 June 2019 and 1 to 4 October 2016. We ignore the cover-          are minor between the original and reconstructed soil mois-
age of Antarctica and most of Greenland, because the satel-        ture results in Table 1. To some degree, this validation en-
lite soil moisture data within these regions are perennially       sures the reliability and availability of the proposed seamless
missing.                                                           global daily AMSR2 soil moisture products. In addition, the
   From the spatial dimension, the reconstructed global soil       in situ validation results in the Tibetan Plateau region (Qiu et
moisture products are consistent between invalid regions and       al., 2020; P. Zhang et al., 2020) are listed in the Supplement.

https://doi.org/10.5194/essd-13-1385-2021                                         Earth Syst. Sci. Data, 13, 1385–1401, 2021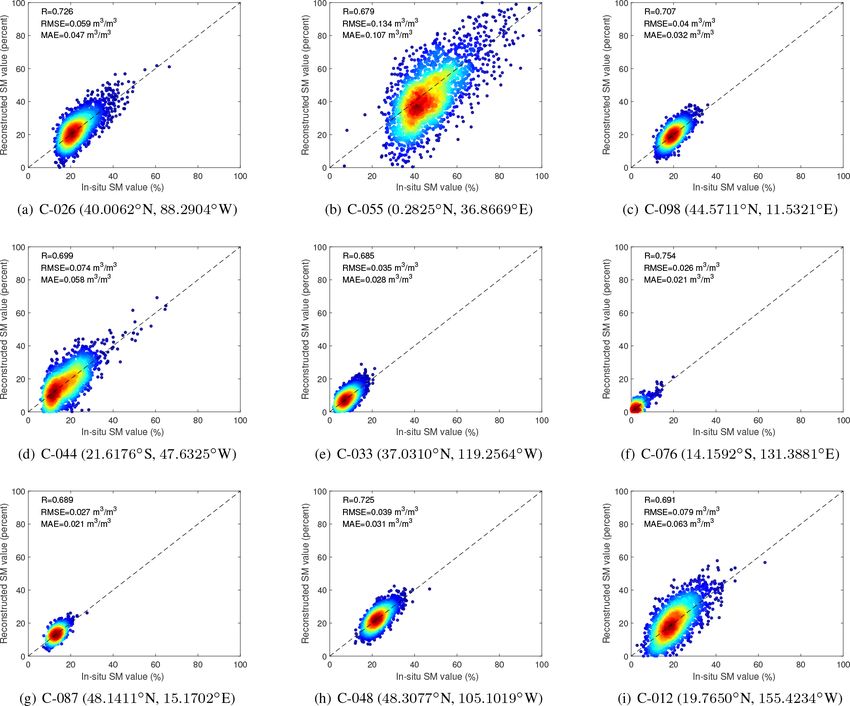
1392                                                                     Q. Zhang et al.: Generating SGD-SM AMSR2 products

Figure 5. Original and reconstructed global daily SM results between 1 and 4 June 2019.

4.3    Time-series validation                                         scribed in Fig. 8a–f, the horizontal axis stands for the daily
                                                                      time-series date between 1 January 2013 and 31 Decem-
To further validate the reconstructed soil moisture results,          ber 2019. The vertical axis represents the soil moisture value.
time-series variations in both original and reconstructed             The blue points refer to the original valid soil moisture daily
results are stacked in six points around the six conti-               results, and the red forks stand for the reconstructed invalid
nents: Africa (0.375◦ N, 36.875◦ E), Europe (49.375◦ N,               soil moisture daily results in Fig. 8.
35.125◦ E), Asia (38.125◦ N, 117.375◦ E), North Amer-                    As depicted in Fig. 8a–f, most of the soil moisture time-
ica (39.875◦ N, 106.125◦ W), South America (15.125◦ S,                series scatters can obviously reveal the annual periodic varia-
52.625◦ W), and Australia (30.125◦ S, 150.375◦ E). As de-             tions. The reconstructed soil moisture results generally show

Earth Syst. Sci. Data, 13, 1385–1401, 2021                                                https://doi.org/10.5194/essd-13-1385-2021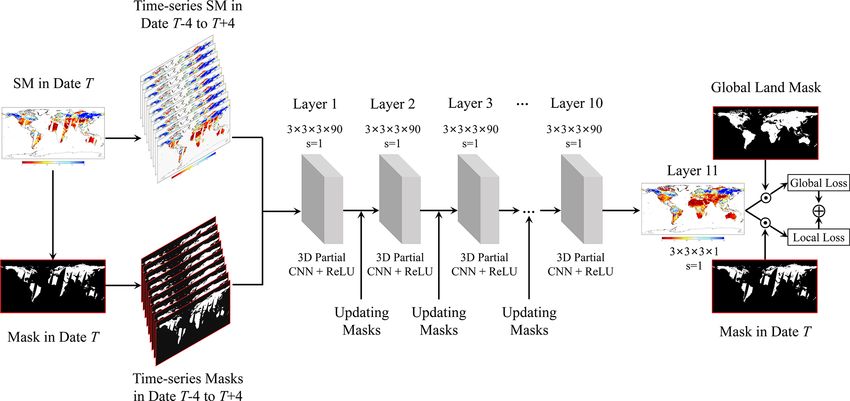
Q. Zhang et al.: Generating SGD-SM AMSR2 products                                                                             1393

Figure 6. Original and reconstructed global daily SM results between 1 and 4 October 2016.

a fine temporal consistency with the original soil moisture           steadily reflect the temporal consistency and variation. This
results in different areas. Related low soil moisture values          is significant for time-series applications and analysis. This
mostly existed in the drought season of winter with frozen            daily time-series validation also demonstrates the robustness
lands such as in Fig. 8d. Related high soil moisture values           of the presented method and the availability of the estab-
were mainly generated in the moist season of summer with              lished seamless global daily products.
more rainy days, especially in Fig. 8b, d, and f.
   Overall, compared with the whole original variation ten-
dency between 2013 and 2019, the generated long-term
seamless global daily AMSR2 soil moisture products can

https://doi.org/10.5194/essd-13-1385-2021                                             Earth Syst. Sci. Data, 13, 1385–1401, 2021
1394                                                                     Q. Zhang et al.: Generating SGD-SM AMSR2 products

Figure 7. Scatters of the in situ reconstructed soil moisture values within selected COsmic-ray Soil Moisture Observing System (COSMOS)
stations.

4.4    Simulated missing-region validation                            patches in 25 July 2015 are displayed in Fig. 10. Table 2
                                                                      gives the evaluation index (R, RMSE, MAE) of the simulated
In addition to the time-series consistency in Sect. 4.3, the          patches between 2013 and 2019. Then the original recon-
spatial continuity is also important for the reconstructed            structed scatters of simulated regions in 2013, 2015, 2017,
seamless soil moisture products. Therefore, to further evi-           and 25 July 2019 are listed in Fig. 11a–b, respectively.
dence this key point, we carry out the simulated missing-                As shown in Fig. 9a and b, the reconstructed invalid re-
region validation in this subsection. Based on the original           gions are consecutive between the original valid regions. And
soil moisture products, six simulated square missing regions          in the simulated missing regions, the spatial texture informa-
are performed on six continents. In this way, we can easily           tion is also continuous without obvious boundary reconstruc-
compare the reconstructed SM regions with original SM re-             tion effects in Fig. 9b. To better distinguish the spatial de-
gions, to validate the 2D spatial continuity of the proposed          tails of reconstructed soil moisture, we select four enlarged
SGD-SM products. We select four dates of the long-term soil           patches in simulated regions in Fig. 10. It can be clearly ob-
moisture products: 25 July 2013, 25 July 2015, 25 July 2017,          served that the reconstructed patches perform with high con-
and 25 July 2019 as the simulated objects. For example,               sistency with the original patches, as displayed in Fig. 10.
original and reconstructed results with simulated missing re-            In addition, the reconstructed soil moisture patches in sim-
gions in 25 July 2019 are depicted in Fig. 9a and b, re-              ulated missing regions show high reconstruction accuracy,
spectively. The simulated missing regions can be clearly ob-          whose R values are distributed between 0.963 and 0.974 in
served in Fig. 9a around the six continents. Detailed origi-          Table 2 and Fig. 11a–d. RMSE and MAE values also perform
nal and reconstructed spatial information of four simulated

Earth Syst. Sci. Data, 13, 1385–1401, 2021                                            https://doi.org/10.5194/essd-13-1385-2021
Q. Zhang et al.: Generating SGD-SM AMSR2 products 1395
Figure 8. Original and reconstructed time-series results in selected regions.
well with 0.065 to 0.073 m3 /m3 and 0.044 to 0.052 m3 /m3 in Table 2. Evaluation indexes of the simulated patches between 2013
Table 2 and Fig. 11a–d, respectively. Overall, this simulated to 2019.
missing-region validation manifests the reconstruction abil-
ity of spatial information continuity. Evaluation index
Year
R RMSE MAE
5 Discussion 2013 0.974 0.065 0.044
2014 0.963 0.073 0.052
5.1 Comparisons with time-series averaging 2015 0.968 0.069 0.050
2016 0.972 0.067 0.046
As mentioned in Sect. 1, some simple strategies such as time- 2017 0.966 0.070 0.049
series averaging can also be employed for synthesising the 2018 0.970 0.065 0.046
complete soil moisture products. Therefore, we perform the 2019 0.969 0.069 0.048
comparisons between the time-series averaging approach and Average 0.968 0.068 0.471
the presented method, to further validate the effectiveness
and rationality of our dataset and framework. In terms of
the time-series averaging method, it averages the time-series
https://doi.org/10.5194/essd-13-1385-2021 Earth Syst. Sci. Data, 13, 1385–1401, 20211396 Q. Zhang et al.: Generating SGD-SM AMSR2 products
Figure 9. Original and reconstructed results with simulated missing regions in 25 July 2019.
daily soil moisture data to reconstruct gap regions. The orig- Table 3. Evaluation index (R, RMSE, MAE) comparisons between
inal soil moisture result, time-series averaging result, and the the time-series averaging and proposed method. The better indexes
proposed reconstruction result on 10 September 2016 are are marked in bold.
shown in Fig. 12a–c, respectively. Three reconstructed re-
gions are marked with a black circle in Fig. 12b and c. The Evaluation index
Method
evaluation index comparisons between the time-series av- R RMSE MAE
eraging method and proposed method are listed in Table 3
Time-series averaging 0.635 0.124 0.093
through the corresponding in situ data validations. Proposed 0.708 0.085 0.066
As displayed in the black circled regions of Fig. 12b and
c, we can clearly distinguish the spatial discontinuity in the
Earth Syst. Sci. Data, 13, 1385–1401, 2021 https://doi.org/10.5194/essd-13-1385-2021Q. Zhang et al.: Generating SGD-SM AMSR2 products 1397 Figure 10. Detailed original and reconstructed spatial information of four simulated patches on 25 July 2015. Figure 11. Original and reconstructed scatter of simulated regions in 2013, 2015, and 2017 and on 25 July 2019. time-series averaging result. Reversely, the proposed method ference effect”, especially in the circled regions of Fig. 12b. performs better on spatial continuity between the valid and This also reveals the limitations and shortages of the time- invalid regions. The evaluation indexes R, RMSE, and MAE series averaging method. Conversely, the proposed method also manifest the superiority of the presented approach, com- jointly utilises both spatial and temporal information of these pared with the time-series averaging method in Table 3. The time-series soil moisture products. Further, it can better ex- main reason is that daily soil moisture products show tempo- ploit the deep spatio-temporal feature for soil moisture data ral differences, and the time-series averaging strategy cannot reconstruction. Overall, this discussion demonstrates the su- use the 2D spatial information and ignores these temporal periority of the proposed framework for daily time-series differences. Therefore, it reflects the obvious “boundary dif- https://doi.org/10.5194/essd-13-1385-2021 Earth Syst. Sci. Data, 13, 1385–1401, 2021
1398                                                                       Q. Zhang et al.: Generating SGD-SM AMSR2 products

Figure 12. Original and time-series averaging and proposed global soil moisture results on 10 September 2016.

product reconstruction, especially compared with the time-                   the reconstruction effects. This uncertainty can be no-
series averaging strategy.                                                   ticed in time-series validation, especially for the rainy
                                                                             season.
5.2    Uncertainty analysis of the SGD-SM products
                                                                          3. The generalisation of the proposed reconstruction
Uncertainty analysis is important for quantitative remote                    model. In this work, we train the proposed network
sensing products. The uncertainties in this generated SGD-                   through selecting complete soil moisture patches. In ad-
SM product can be classified as three types: (1) the errors                  dition, the simulated masks are also chosen from the
of the original AMSR2 SM product, (2) the meteorological                     daily soil moisture products. However, there are still
factors such as precipitation and snowfall, and (3) the gener-               differences between the training data and testing data,
alisation of the proposed reconstruction model. Detailed de-                 such as land cover type, mask size, and so on. This un-
scriptions of these three uncertainties are listed as follows.               certainty may disturb the generalisation of the proposed
                                                                             reconstruction model, to some degree.
  1. The errors of original AMSR2 SM product. The pro-
     posed SGD-SM product is generated based on the orig-
                                                                      6    Data availability
     inal AMSR2 SM product. This original AMSR2 SM
     product also contains errors, due to the satellite sen-
                                                                      This       dataset     can      be    downloaded             at
     sor imaging and SM retrieval algorithm. As shown in
                                                                      https://doi.org/10.5281/zenodo.4417458 (Zhang et            al.,
     Table 1, the R, RMSE, and MAE evaluation indexes
                                                                      2021).
     of the original AMSR2 SM product are 0.687, 0.095,
     and 0.078, respectively. These errors are also inevitably
     transmitted into the generated SGD-SM product.                   7    Conclusions

  2. The meteorological factors. SGD-SM relies on the tem-            In this work, aiming at the spatial incompleteness and tem-
     poral continuity and spatial consistency for daily SM            poral discontinuity, we generate a seamless global daily
     gap-filling. Nevertheless, if the unusual meteorology            (SGD) AMSR2 soil moisture long-term product from 2013
     occurs in a single day, such as precipitation and snow-          to 2019. To jointly utilise spatial and temporal information, a
     fall, it may destroy the above assumption and influence          novel spatio-temporal partial CNN is proposed for AMSR2

Earth Syst. Sci. Data, 13, 1385–1401, 2021                                             https://doi.org/10.5194/essd-13-1385-2021
Q. Zhang et al.: Generating SGD-SM AMSR2 products 1399
soil moisture product gap-filling. The partial 3D-CNN and References
global–local loss function are developed for better extract-
ing valid region features and ignoring invalid regions through
data and mask information. Three validation strategies are Al Bitar, A., Mialon, A., Kerr, Y. H., Cabot, F., Richaume, P.,
Jacquette, E., Quesney, A., Mahmoodi, A., Tarot, S., Parrens,
employed to testify the precision of our seamless global
M., Al-Yaari, A., Pellarin, T., Rodriguez-Fernandez, N., and
daily products as follows: (1) in situ validation, (2) time- Wigneron, J.-P.: The global SMOS Level 3 daily soil moisture
series validation, and (3) simulated missing-region valida- and brightness temperature maps, Earth Syst. Sci. Data, 9, 293–
tion. Evaluation results demonstrate that the seamless global 315, https://doi.org/10.5194/essd-9-293-2017, 2017.
daily AMSR2 soil moisture dataset shows high accuracy, re- Chan, S. K., Bindlish, R., O’Neill, P., Jackson, T., Njoku,
liability, and robustness. E., Dunbar, S., and Colliander, A.: Development and
Although the proposed framework performs well when assessment of the SMAP enhanced passive soil mois-
generating this seamless global daily soil moisture dataset, ture product, Remote Sens. Environ., 204, 931–941,
some drawbacks and limitations still need to be overcome, https://doi.org/10.1016/j.rse.2017.08.025, 2018.
especially on multi-source data fusion, spatio-temporal in- Chen, J., Zhu, X., Vogelmann, J. E., Gao, F., and Jin, S.: A sim-
formation extraction, and deep learning model optimisation. ple and effective method for filling gaps in Landsat ETM+
SLC-off images, Remote Sens. Environ., 115, 1053–1064,
In our future work, we will introduce multi-source informa-
https://doi.org/10.1016/j.rse.2010.12.010, 2011.
tion fusion into the proposed model, such as precipitation and Chen, Y., Feng, X., and Fu, B.: An improved global remote-
snowfall. The proposed reconstruction model will be increas- sensing-based surface soil moisture (RSSSM) dataset
ingly improved by means of more powerful units and struc- covering 2003–2018, Earth Syst. Sci. Data, 13, 1–31,
tures. In addition, we will consider more soil moisture prod- https://doi.org/10.5194/essd-13-1-2021, 2021.
ucts in our future work such as AMSR-E, SMOS-IC, SMAP, Cho, E., Su, C. H., Ryu, D., Kim, H., and Choi, M.: Does
and so on. AMSR2 produce better soil moisture retrievals than AMSR-
E over Australia?, Remote Sens. Environ., 188, 95–105,
https://doi.org/10.1016/j.rse.2016.10.050, 2017.
Supplement. The supplement related to this article is available Colliander, A., Jackson, T. J., and Bindlish, R.: Valida-
online at: https://doi.org/10.5194/essd-13-1385-2021-supplement. tion of SMAP surface soil moisture products with core
validation sites, Remote Sens. Environ., 191, 215–231,
https://doi.org/10.1016/j.rse.2017.01.021, 2017.
Author contributions. QZ designed the proposed model and per- Dong, J., Crow, W. T., and Tobin, K. J.: Comparison of mi-
formed the experiments. QY and LZ revised the whole manuscript. crowave remote sensing and land surface modeling for surface
JL, YW, and FS provided related data and some figures of this work. soil moisture climatology estimation, Remote Sens. Environ.,
All authors read and provided suggestions for this paper. 242, 111756, https://doi.org/10.1016/j.rse.2020.111756, 2020.
Dorigo, W., de Jeu, R., Chung, D., Parinussa, R., Liu, Y., Wag-
ner, W., and Fernández-Prieto, D.: Evaluating global trends
(1988–2010) in harmonized multi-satellite surface soil moisture,
Competing interests. The authors declare that they have no con-
Geophys. Res. Lett., 39, https://doi.org/10.1029/2012GL052988,
flict of interest.
2012.
Dorigo, W. A., Wagner, W., Hohensinn, R., Hahn, S., Paulik, C.,
Xaver, A., Gruber, A., Drusch, M., Mecklenburg, S., van Oeve-
Acknowledgements. We sincerely thank the ISMN organisation len, P., Robock, A., and Jackson, T.: The International Soil Mois-
for supplying scientific site data. ture Network: a data hosting facility for global in situ soil mois-
ture measurements, Hydrol. Earth Syst. Sci., 15, 1675–1698,
https://doi.org/10.5194/hess-15-1675-2011, 2011.
Financial support. This research has been supported by the Na- Dorigo, W. A., Xaver, A., Vreugdenhil, M., Gruber, A., Hegyiová,
tional Natural Science Foundation of China (no. 41922008), the A., Sanchis-Dufau, A. D., Zamojski, D., Cordes, C., Wagner,
Strategic Priority Research Program of the Chinese Academy W., and Drusch, M.: Global automated quality control of in situ
of Sciences (no. XDA19090104), and the Fundamental Research soil moisture data from the international soil moisture network,
Funds for the Central Universities of Wuhan University (no. Vadose Zone J., 12, 1–21, https://doi.org/10.2136/vzj2012.0097,
2042019kf0213). 2013.
Du, J., Kimball, J. S., Jones, L. A., Kim, Y., Glassy, J., and
Watts, J. D.: A global satellite environmental data record de-
Review statement. This paper was edited by Giulio G. R. Iovine rived from AMSR-E and AMSR2 microwave Earth observations,
and reviewed by four anonymous referees. Earth Syst. Sci. Data, 9, 791–808, https://doi.org/10.5194/essd-
9-791-2017, 2017.
Fang, K., Shen, C., Kifer, D., and Yang, X.: Prolongation of SMAP
to spatiotemporally seamless coverage of continental US using a
deep learning neural network, Geophys. Res. Lett., 44, 11030–
11039, https://doi.org/10.1002/2017GL075619, 2017.
https://doi.org/10.5194/essd-13-1385-2021 Earth Syst. Sci. Data, 13, 1385–1401, 20211400 Q. Zhang et al.: Generating SGD-SM AMSR2 products Fang, L., Zhan, X., and Yin, J.: An Intercomparing Study a data fusion approach, Remote Sens. Environ., 246, 111863, of Algorithms for Downscaling SMAP Radiometer Soil https://doi.org/10.1016/j.rse.2020.111863, 2020. Moisture Retrievals, J. Hydrometeor., 21, 1761–1775, Ma, H., Zeng, J., and Chen, N.: Satellite surface soil moisture from https://doi.org/10.1175/JHM-D-19-0034.1, 2020. SMAP, SMOS, AMSR2 and ESA CCI: A comprehensive assess- Jalilvand, E., Tajrishy, M., Hashemi, S. A. G. Z., and Brocca, L.: ment using global ground-based observations, Remote Sens. En- Quantification of irrigation water using remote sensing of soil viron., 231, 111215, https://doi.org/10.1016/j.rse.2019.111215, moisture in a semi-arid region, Remote Sens. Environ., 231, 2019. 111226, https://doi.org/10.1016/j.rse.2019.111226, 2019. McColl, K. A., Alemohammad, S. H., and Akbar, R.: The global Kim, H., Parinussa, R., and Konings, A. G.: Global-scale assess- distribution and dynamics of surface soil moisture, Nat. Geosci., ment and combination of SMAP with ASCAT (active) and 10, 100–104, https://doi.org/10.1038/NGEO2868, 2017. AMSR2 (passive) soil moisture products, Remote Sens. En- Muzalevskiy, K., and Ruzicka, Z.: Detection of soil freeze/thaw viron., 204, 260–275, https://doi.org/10.1016/j.rse.2017.10.026, states in the Arctic region based on combined SMAP and AMSR- 2018. 2 radio brightness observations, Int. J. Remote Sens., 41, 5046– Kim, S., Liu, Y. Y., Johnson, F. M., Parinussa, R. M., and Sharma, 5061, https://doi.org/10.1080/01431161.2020.1724348, 2020. A.: A global comparison of alternate AMSR2 soil moisture prod- Pathak, D., Krahenbuhl, P., Donahue, J., Darrell, T., and ucts: Why do they differ?, Remote Sens. Environ., 161, 43–62, Efros, A.: Context encoders: Feature learning by inpainting, https://doi.org/10.1016/j.rse.2015.02.002, 2015. Proc. IEEE Conf. Comp. Vis. Pattern Recogn., 2536–2544, Lee, C. S., Sohn, E., Park, J. D., and Jang, J. D.: Estimation https://doi.org/10.1109/CVPR.2016.278, 2016. of soil moisture using deep learning based on satellite data: a Peng, J., Loew, A., Merlin, O., and Verhoest, N. E.: A review of spa- case study of South Korea, GISci. Remote Sens., 56, 43–67, tial downscaling of satellite remotely sensed soil moisture, Rev. https://doi.org/10.1080/15481603.2018.1489943, 2019. Geophys., 55, 341–366, https://doi.org/10.1002/2016RG000543, Lievens, H., Tomer, S. K., and Al Bitar, A.: SMOS soil moisture 2017. assimilation for improved hydrologic simulation in the Murray Purdy, A. J., Fisher, J. B., Goulden, M. L., Colliander, A., Halver- Darling Basin, Australia, Remote Sens. Environ., 168, 146–162, son, G., Tu, K., and Famiglietti, J. S.: SMAP soil moisture im- https://doi.org/10.1016/j.rse.2015.06.025, 2015. proves global evapotranspiration, Remote Sens. Environ., 219, Liu, G., Reda, F. A., Shih, K. J., Wang, T. C., Tao, A., and 1–14, https://doi.org/10.1016/j.rse.2018.09.023, 2018. Catanzaro, B.: Image inpainting for irregular holes using par- Qiu, J., Dong, J., Crow, W. T., Zhang, X., Reichle, R. H., and M. tial convolutions, Proc. Europ. Conf. Com. Vis., 85–100, De Lannoy, G. J.: The added value of brightness temperature https://doi.org/10.1007/978-3-030-01252-6_6, 2018a. assimilation for the SMAP Level-4 surface and root-zone soil Liu, G., Shih, K. J., Wang, T. C., Reda, F. A., Sapra, K., Yu, moisture analysis over mainland China, Hydrol. Earth Syst. Sci. Z., and Catanzaro, B.: Partial convolution based padding, arXiv Discuss. [preprint], https://doi.org/10.5194/hess-2020-407, in re- [preprint], arXiv:1811.11718, 2018b. view, 2020. Liu, H., Jiang, B., Xiao, Y., and Yang, C.: Coherent semantic at- Samaniego, L., Thober, S., Kumar, R., Wanders, N., Rakovec, O., tention for image inpainting, Proc. IEEE Inter. Conf. Com. Vis., Pan, M., and Marx, A.: Anthropogenic warming exacerbates Eu- 4170–4179, https://doi.org/10.1109/ICCV.2019.00427, 2019. ropean soil moisture droughts, Nat. Clim. Change, 8, 421–426, Liu, X., Pei, F., Wen, Y., Li, X., Wang, S., Wu, C., and Liu, https://doi.org/10.1038/s41558-018-0138-5, 2018. Z.: Global urban expansion offsets climate-driven increases in Santi, E., Paloscia, S., Pettinato, S., Brocca, L., Ciabatta, L., terrestrial net primary productivity, Nat. Commun., 10, 5558, and Entekhabi, D.: On the synergy of SMAP, AMSR2 AND https://doi.org/10.1038/s41467-019-13462-1, 2019. SENTINEL-1 for retrieving soil moisture, Int. J. Appl. Earth Liu, X., Huang, Y., Xu, X., Li, X., Li, X., Ciais, P., and Obs., 65, 114–123, https://doi.org/10.1016/j.jag.2017.10.010, Zeng, Z.: High-spatiotemporal-resolution mapping of global ur- 2018. ban change from 1985 to 2015, Nat. Sustain., 3, 564–570, Shi, Q., Liu, M., Liu, X., Liu, P., Zhang, P., Yang, J., and Li, X.: https://doi.org/10.1038/s41893-020-0521-x, 2020. Domain adaption for fine-grained urban village extraction from Llamas, R. M., Guevara, M., Rorabaugh, D., Taufer, M., and satellite images, IEEE Geosci. Remote Sens. Lett., 17, 1430– Vargas, R.: Spatial Gap-Filling of ESA CCI Satellite- 1434, https://doi.org/10.1109/LGRS.2019.2947473, 2020. Derived Soil Moisture Based on Geostatistical Tech- Sun, Z., Long, D., Yang, W., Li, X., and Pan, Y.: Reconstruc- niques and Multiple Regression, Remote Sens., 12, 665, tion of GRACE Data on Changes in Total Water Storage Over https://doi.org/10.3390/rs12040665, 2020. the Global Land Surface and 60 Basins, Water Resour. Res., Long, D., Shen, Y., and Sun, A.: Drought and flood monitor- 56, e2019WR026250, https://doi.org/10.1029/2019WR026250, ing for a large karst plateau in Southwest China using ex- 2020. tended GRACE data, Remote Sens. Environ., 155, 145–160, Wang, G., Garcia, D., Liu, Y., De Jeu, R., and Dolman, A. https://doi.org/10.1016/j.rse.2014.08.006, 2014. J.: A three-dimensional gap filling method for large geo- Long, D., Bai, L., and Yan, L.: Generation of spatially com- physical datasets: Application to global satellite soil mois- plete and daily continuous surface soil moisture of high ture observations, Environ. Modell. Softw., 30, 139–142, spatial resolution, Remote Sens. Environ., 233, 111364, https://doi.org/10.1016/j.envsoft.2011.10.015, 2012. https://doi.org/10.1016/j.rse.2019.111364, 2019. Wang, L., and Qu, J. J.: Satellite remote sensing applications for sur- Long, D., Yan, L., Bai, L., Zhang, C., Li, X., Lei, H., Yang, H., Tian, face soil moisture monitoring: A review, Front. Earth Sci. China, F., Zeng, C., Meng, X., and Shi, C.: Generation of MODIS-like 3, 237–247, https://doi.org/10.1007/s11707-009-0023-7, 2009. land surface temperatures under all-weather conditions based on Earth Syst. Sci. Data, 13, 1385–1401, 2021 https://doi.org/10.5194/essd-13-1385-2021
Q. Zhang et al.: Generating SGD-SM AMSR2 products                                                                                   1401

Wigneron, J. P., Calvet, J. C., Pellarin, T., Van de Griend, A.       Zhang, Q., Yuan, Q., Li, J., Yang, Z., and Ma, X.: Learning a dilated
  A., Berger, M., and Ferrazzoli, P.: Retrieving near-surface soil      residual network for SAR image despeckling, Remote Sens., 10,
  moisture from microwave radiometric observations: current sta-        196, https://doi.org/10.3390/rs10020196, 2018b.
  tus and future plans, Remote Sens. Environ., 85, 489–506,           Zhang, Q., Yuan, Q., Li, J., Liu, X., Shen, H., and Zhang, L.:
  https://doi.org/10.1016/S0034-4257(03)00051-8, 2013.                  Hybrid noise removal in hyperspectral imagery with a spatial–
Wu, Q., Liu, H., Wang, L., and Deng, C.: Evaluation of                  spectral gradient network, IEEE T. Geosci. Remote, 57, 7317–
  AMSR2 soil moisture products over the contiguous United               7329, https://doi.org/10.1109/TGRS.2019.2912909, 2019.
  States using in situ data from the International Soil Mois-         Zhang, Q., Yuan, Q., Li, J., Li, Z., Shen, H., and Zhang,
  ture Network, Int. J. Appl. Earth Obs., 45, 187–199,                  L.: Thick cloud and cloud shadow removal in multi-
  https://doi.org/10.1016/j.jag.2015.10.011, 2016.                      temporal imagery using progressively spatio-temporal patch
Yeh, R. A., Chen, C., Yian Lim, T., Schwing, A. G., Hasegawa-           group deep learning, ISPRS J. Photogramm., 162, 148–160,
  Johnson, M., and Do, M. N.: Semantic image inpainting with            https://doi.org/10.1016/j.isprsjprs.2020.02.008, 2020a.
  deep generative models, Proc. IEEE Conf. Comp. Vis. Pattern         Zhang, Q., Yuan, Q., Li, J., Sun, F., and Zhang, L.: Deep
  Recogn., 5485–5493, https://doi.org/10.1109/CVPR.2017.728,            spatio-spectral Bayesian posterior for hyperspectral image non-
  2017.                                                                 iid noise removal, ISPRS J. Photogramm., 164, 125–137,
Yuan, Q., Zhang, Q., Li, J., Shen, H., and Zhang, L.: Hyperspectral     https://doi.org/10.1016/j.isprsjprs.2020.04.010, 2020b.
  image denoising employing a spatial–spectral deep residual con-     Zhang, Q., Yuan, Q., Li, J., Wang, Y., Sun, F., and Zhang,
  volutional neural network, IEEE T. Geosci. Remote., 57, 1205–         L.: SGD-SM: Generating Seamless Global Daily AMSR2
  1218, https://doi.org/10.1109/TGRS.2018.2865197, 2019.                Soil Moisture Long-term Products (2013–2019), Zenodo,
Zeng, J., Li, Z., Chen, Q., Bi, H. Y., Qiu, J. X., and                  https://doi.org/10.5281/zenodo.4417458, 2021.
  Zou, P. F.: Evaluation of remotely sensed and reanaly-              Zhang, X., Zhang, T., Zhou, P., Shao, Y., and Gao, S.: Validation
  sis soil moisture products over the Tibetan Plateau using             analysis of SMAP and AMSR2 soil moisture products over the
  in-situ observations, Remote Sens. Environ., 163, 91–110,             United States using ground-based measurements, Remote Sens.,
  https://doi.org/10.1016/j.rse.2015.03.008, 2015.                      9, 104, https://doi.org/10.3390/rs9020104, 2017.
Zhang, P., Zheng, D., van der Velde, R., Wen, J., Zeng, Y., Wang,     Zhao, T., Hu, L., and Shi, J.: Soil moisture retrievals using
  X., Wang, Z., Chen, J., and Su, Z.: Status of the Tibetan Plateau     L-band radiometry from variable angular ground-based and
  observatory (Tibet-Obs) and a 10-year (2009–2019) surface             airborne observations, Remote Sens. Environ., 248, 111958,
  soil moisture dataset, Earth Syst. Sci. Data Discuss. [preprint],     https://doi.org/10.1016/j.rse.2020.111958, 2020.
  https://doi.org/10.5194/essd-2020-209, in review, 2020.             Zhu, X., Gao, F., Liu, D., and Chen, J.: A modified neighborhood
Zhang, Q., Yuan, Q., Zeng, C., Li, X., and Wei, Y.: Miss-               similar pixel interpolator approach for removing thick clouds in
  ing data reconstruction in remote sensing image with a                Landsat images, IEEE Geosci. Remote Sens. Lett., 9, 521–525,
  unified spatial-temporal-spectral deep convolutional neu-             2011.
  ral network, IEEE T. Geosci. Remote, 56, 4274–4288,
  https://doi.org/10.1109/TGRS.2018.2810208, 2018a.

https://doi.org/10.5194/essd-13-1385-2021                                             Earth Syst. Sci. Data, 13, 1385–1401, 2021
You can also read