Patient Representation Learning From Heterogeneous Data Sources and Knowledge Graphs Using Deep Collective Matrix Factorization: Evaluation Study
←
→
Page content transcription
If your browser does not render page correctly, please read the page content below
JMIR MEDICAL INFORMATICS                                                                                                                 Kumar et al

     Original Paper

     Patient Representation Learning From Heterogeneous Data
     Sources and Knowledge Graphs Using Deep Collective Matrix
     Factorization: Evaluation Study

     Sajit Kumar1, MBA; Alicia Nanelia2, BSc; Ragunathan Mariappan2, MSc; Adithya Rajagopal3, BTech; Vaibhav
     Rajan2, PhD
     1
      Great Learning, Bengaluru, India
     2
      Department of Information Systems and Analytics, National University of Singapore, Singapore, Singapore
     3
      National Institute of Technology, Thiruchirappalli, India

     Corresponding Author:
     Vaibhav Rajan, PhD
     Department of Information Systems and Analytics
     National University of Singapore
     13 Computing Drive
     Singapore, 117417
     Singapore
     Phone: 65 65166737
     Email: vaibhav.rajan@nus.edu.sg

     Abstract
     Background: Patient representation learning aims to learn features, also called representations, from input sources automatically,
     often in an unsupervised manner, for use in predictive models. This obviates the need for cumbersome, time- and resource-intensive
     manual feature engineering, especially from unstructured data such as text, images, or graphs. Most previous techniques have
     used neural network–based autoencoders to learn patient representations, primarily from clinical notes in electronic medical
     records (EMRs). Knowledge graphs (KGs), with clinical entities as nodes and their relations as edges, can be extracted automatically
     from biomedical literature and provide complementary information to EMR data that have been found to provide valuable
     predictive signals.
     Objective: This study aims to evaluate the efficacy of collective matrix factorization (CMF), both the classical variant and a
     recent neural architecture called deep CMF (DCMF), in integrating heterogeneous data sources from EMR and KG to obtain
     patient representations for clinical decision support tasks.
     Methods: Using a recent formulation for obtaining graph representations through matrix factorization within the context of
     CMF, we infused auxiliary information during patient representation learning. We also extended the DCMF architecture to create
     a task-specific end-to-end model that learns to simultaneously find effective patient representations and predictions. We compared
     the efficacy of such a model to that of first learning unsupervised representations and then independently learning a predictive
     model. We evaluated patient representation learning using CMF-based methods and autoencoders for 2 clinical decision support
     tasks on a large EMR data set.
     Results: Our experiments show that DCMF provides a seamless way for integrating multiple sources of data to obtain patient
     representations, both in unsupervised and supervised settings. Its performance in single-source settings is comparable with that
     of previous autoencoder-based representation learning methods. When DCMF is used to obtain representations from a combination
     of EMR and KG, where most previous autoencoder-based methods cannot be used directly, its performance is superior to that of
     previous nonneural methods for CMF. Infusing information from KGs into patient representations using DCMF was found to
     improve downstream predictive performance.
     Conclusions: Our experiments indicate that DCMF is a versatile model that can be used to obtain representations from single
     and multiple data sources and combine information from EMR data and KGs. Furthermore, DCMF can be used to learn
     representations in both supervised and unsupervised settings. Thus, DCMF offers an effective way of integrating heterogeneous
     data sources and infusing auxiliary knowledge into patient representations.

     https://medinform.jmir.org/2022/1/e28842                                                            JMIR Med Inform 2022 | vol. 10 | iss. 1 | e28842 | p. 1
                                                                                                                     (page number not for citation purposes)
XSL• FO
RenderX
JMIR MEDICAL INFORMATICS                                                                                                             Kumar et al

     (JMIR Med Inform 2022;10(1):e28842) doi: 10.2196/28842

     KEYWORDS
     representation learning; deep collective matrix factorization; electronic medical records; knowledge graphs; multiview learning;
     graph embeddings; clinical decision support

                                                                           One such auxiliary source of information is a clinical knowledge
     Introduction                                                          graph (KG) that has been found to be valuable for improving
     Background                                                            both the accuracy and interpretability of predictive models.
                                                                           These KGs have clinical entities (eg, diseases, drugs, and
     Machine learning–based predictive models have been found to           biomolecules) as nodes and different kinds of relations (eg,
     be highly accurate in many clinical decision support tasks.           treats, predisposes, and causes) as edges. They can be
     Examples include predictions of unforeseen complications [1],         automatically created from various sources such as biomedical
     patient severity assessment through mortality predictors [2] and      literature and web-based health portals. Representation learning
     automated coding for billing [3], and prediction of patient           methods have also been developed for graph inputs that can
     outcomes [4], to name a few. The key ingredients of these             automatically learn vectorial representations of nodes to
     models are the features used to describe patients for whom            incorporate the global structural and semantic properties of the
     predictions are required. The traditional approach for building       graph. These node representations can then be used in machine
     these features is to handcraft them typically in collaboration        learning models for graph analytics such as community detection
     with a domain expert. However, with the growing amount,               or node classification. Owing to its wide applicability, a large
     complexity, and diversity of clinical information sources, such       number of graph representation learning techniques have been
     manual feature engineering is practically infeasible. For instance,   developed for various classes of graphs, including KGs.
     in electronic medical records (EMRs), patient information may
     be distributed among laboratory tests, nursing notes, radiology       In this paper, we analyze patient representation learning in light
     images and reports, genomic data, and other data sources.             of 2 recent advances in CMF and KG representation learning.
                                                                           A deep autoencoder-based architecture, called deep CMF
     Representation learning aims to learn features or representations     (DCMF), was developed for CMF, which was found to
     from the given input sources automatically, often in an               outperform classical nonneural variants of CMF in several tasks
     unsupervised manner. This obviates the need for manual feature        [9]. Using DCMF, which provides a seamless way of integrating
     engineering and is particularly useful with unstructured data         heterogeneous data, we evaluate the effectiveness of patient
     sources such as clinical notes. These real-valued vectorial           representations when the input data are augmented with
     representations can be used as features directly in machine           additional information from literature-derived KGs. The
     learning models for various downstream tasks such as prediction       generality of DCMF allows many different ways of using KG
     or cluster detection. Such representation learning has been found     as inputs; however, not all of them are equally effective.
     to be effective in several predictive models, for example, disease    Recently, it has been shown that many graph representation
     category prediction [5] and mortality prediction [6].                 learning methods can be reformulated as a matrix factorization
     Previous studies have primarily used clinical notes to learn          problem. Leveraging this formulation within the context of
     patient representations. Clinical notes are a rich source of          CMF and DCMF, we infuse auxiliary information during patient
     information containing detailed subjective and objective              representation learning. To our knowledge, this is the first study
     evaluations of patient conditions during the hospital stay. Some      to use this technique to obtain clinical KG representations and
     previous studies have also combined other structured tables           use it within the DCMF framework to obtain patient
     from EMR with features extracted from notes to obtain patient         representations.
     representations [1,5] or to mine clinical information such as         Furthermore, the DCMF architecture can easily be extended to
     drug mentions [7]. Many of these studies have used variants of        create a task-specific end-to-end model that learns to
     deep neural architecture based on autoencoders to obtain              simultaneously find effective patient representations and
     unsupervised patient representations.                                 predictions. We also compare the efficacy of such a model to
     When information from multiple heterogeneous sources is               that of a 2-stage process of first learning unsupervised
     available, predictive models benefit from latent representations      representations and then independently learning a predictive
     that systematically model correlated shared structures. The aim       model.
     of multi-view learning is to effectively build such latent            We rigorously evaluate patient representation learning using
     representations, where views refer to measurements for the same       DCMF-based methods and autoencoders for 2 clinical decision
     subjects that differ in source, datatype, or modality;                support tasks on EMR data comprising 28,563 patient episodes.
     heterogeneous data sources within EMR provide such multiple           The first task is that of primary diagnosis category prediction,
     views of patients. A general technique for multi-view                 which is performed during coding from discharge summaries
     representation learning from arbitrary collections of                 when a patient is discharged from the hospital for billing and
     heterogeneous data sources is collective matrix factorization         reimbursement purposes. The second task is that of mortality
     (CMF) [8]. CMF can be used to obtain patient representations          (risk of death) prediction, which can be used to identify high-risk
     from multi-view EMR data and can also be used to seamlessly           patients and prioritize their care.
     integrate auxiliary information from external sources.

     https://medinform.jmir.org/2022/1/e28842                                                        JMIR Med Inform 2022 | vol. 10 | iss. 1 | e28842 | p. 2
                                                                                                                 (page number not for citation purposes)
XSL• FO
RenderX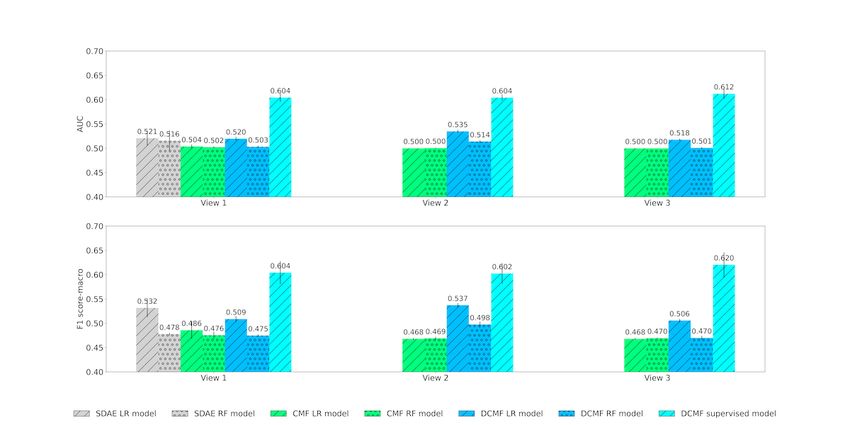
JMIR MEDICAL INFORMATICS                                                                                                           Kumar et al

     The utility of DCMF-based patient representations, obtained         DCMF Architecture
     from only EMR data and a combination of KGs and EMR data            In multi-view learning, views refer to measurements for the
     in these 2 tasks, is empirically analyzed and discussed.            same subjects that differ in source, datatype, or modality. CMF
     Related Work                                                        is a general technique for learning shared representations from
                                                                         arbitrary collections of heterogeneous data sources [8].
     Representation Learning
                                                                         For a single matrix Xm×n containing m rows and n columns,
     Statistical machine learning models typically assume inputs as
                                                                         low-rank factorization aims to obtain latent factors Um×k’ and
     feature vectors. To obviate the need for cumbersome, time- and
     resource-intensive manual feature engineering, especially from      Vn×k’ such that X≈UVT, where the latent dimension k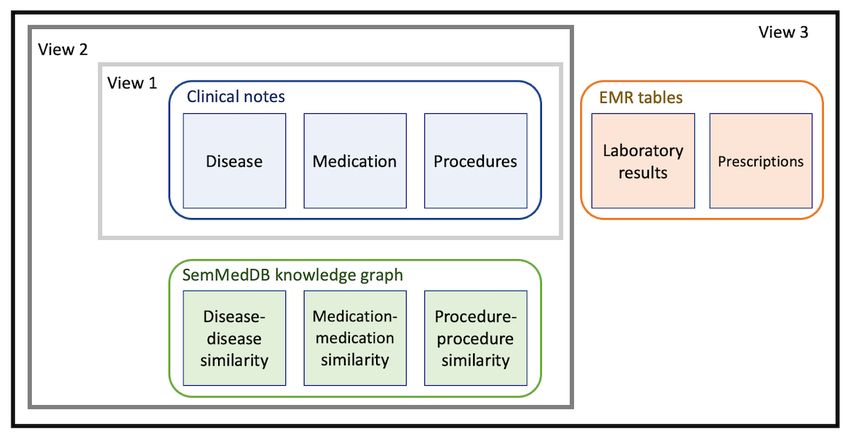
JMIR MEDICAL INFORMATICS                                                                                                                       Kumar et al

                                                                                  a schematic of the model construction steps for an example
                                                                                  comprising 5 matrices.
                                                                                  Collective training of all autoencoders induces dependencies
                                                                                  between the autoencoder networks, which may result in
     where lE is the reconstruction loss between the autoencoder’s                simultaneous underfitting in some networks and overfitting in
     input C(e) and the decoding C(e)’; lR is the matrix reconstruction           other networks. This makes collective learning of all latent
                                                                                  representations challenging and, to scale to arbitrary collections
     loss, where the reconstructed matrix               of the
       th
                                                                                  of matrices, necessitates automatic hyperparameter selection.
     m view is obtained by multiplying the associated row and                     We address these optimization challenges through multitask
     column entity representations              and        . Figure 1 shows       Bayesian optimization (details can be found in the study by
                                                                                  Mariappan and Rajan [9]).
     Figure 1. Schematic of supervised deep collective matrix factorization architecture for an example input of 5 matrices, 6 entities. Top: input matrices
     and a graph showing the entities present in each matrix. Bottom: for each entity, matrices containing that entity (as row or column) are concatenated
     (shaded) and then given as input to the autoencoder. All autoencoders are trained collectively.

                                                                                  Unified Medical Language System (UMLS) Metathesaurus [30]
     Graph Embeddings                                                             contains >5 million clinical concepts, identified by controlled
     Representation learning from graphs aims to learn                            unique identifiers (CUIs) and organized into several structured
     low-dimensional real-valued features of its nodes, also called               ontologies. Biomedical knowledge is growing at a rapid
     graph embeddings, to capture the global structural information               rate—MEDLINE, the largest index of medical literature,
     and semantic properties in the graph. Many representation                    contains >24 million articles with >1.8 million new articles
     learning methods have been proposed for homogeneous graphs,                  published annually [31]. One cannot possibly assimilate all the
     where nodes and edges are both of a single type, for example,                knowledge, even in a narrow domain that is growing at such a
     DeepWalk [21] and Node2Vec [22]. Many real-world                             tremendous pace, let alone find novel connections. To facilitate
     interactions, including those found in clinical KGs, give rise to            automated knowledge discovery, hypothesis generation, and
     heterogeneous information networks (HINs) where nodes and                    predictive modeling from such an enormous and rapidly growing
     edges can be of different types. Representation learning methods             source, automated techniques to extract and organize knowledge
     for such graphs have also been developed, for example,                       into KGs have been developed.
     Metapath2vec [23] and Heterogeneous Graph Neural Network
     [24]. Cui et al [25] and Cai et al [26] described general surveys,           These KGs contain clinical entities as nodes and the relations
     Yang et al [27] described a survey on HIN embeddings, and                    between entities as edges. As there are different kinds of clinical
     Wang et al [28] described a survey on representation learning                entities (eg, diseases, drugs, and biomolecules) and different
     of KGs.                                                                      kinds of relations (eg, treats, predisposes, and causes), such
                                                                                  KGs are essentially HINs. Examples include Hetionet [32],
     The key underlying idea of many of these techniques is to learn              which comprises 47,031 nodes of 11 types and 2,250,197
     the similarities or correlations between nodes in the input                  relationships of 24 types; KnowLife [33], which contains
     network and approximate them at the latent level in the                      >500,000 relations for 13 node types, covering genes, organs,
     embeddings. Many network embedding techniques are                            diseases, symptoms, and treatments, as well as environmental
     equivalent to the factorization of a node similarity matrix with             and lifestyle risk factors; and Semantic Medline Database
     suitable definitions of similarities [29].                                   (SemMedDB) [34], which contains approximately 94 million
                                                                                  relations automatically extracted from approximately 27.9
     Knowledge Graphs
                                                                                  million PubMed abstracts.
     Knowledge bases and ontologies systematically organize the
     wealth of available biomedical knowledge. For instance, the
     https://medinform.jmir.org/2022/1/e28842                                                                  JMIR Med Inform 2022 | vol. 10 | iss. 1 | e28842 | p. 4
                                                                                                                           (page number not for citation purposes)
XSL• FO
RenderX
JMIR MEDICAL INFORMATICS Kumar et al
In this study, we used the SemMedDB, which, through the use (eg, sigmoid for classification and linear for regression). There
of NLP techniques, automatically creates a KG from biomedical is a task-specific loss lT(yT,y’) associated with this layer that is
literature. In SemMedDB, clinical concepts are identified in also task dependent (eg, cross-entropy for classification and
PubMed abstracts through entity recognition algorithms and mean-squared error for regression), where y’ denotes the
then mapped to their CUIs. Various heuristics are used to infer network’s predictions. The supervised latent representations are
the relations between concepts [35]. SemMedDB infers 30 now learned by solving the following equation:
different kinds of relations that are organized into
s u b j e c t - p re d i c a t e - o b j e c t triplets ( eg ,
drugA–TREATS–diseaseB), where both the subject and object
are clinical concepts, and the predicate is a relation. These Collective training of all autoencoders is performed in exactly
triplets form an HIN comprising multiple vertex types (clinical the same way as in DCMF but with the new loss function as
concepts) and multiple edge types (predicates). given above. During prediction, new inputs for entity ep may
Biomedical knowledge, in various forms, including KGs, has be given along with all other auxiliary data, and the additional
been used in clinical predictive models. For instance, the layer’s outputs can be used as predictions.
International Classification of Diseases (ICD) hierarchy, which
Figure 1 shows a schematic of the model. There are 5 input
represents relationships across diseases, has been used for
matrices containing pairwise relations across 6 entities. The
diagnosis prediction [36-38]. Recently, domain
graph at the top shows the associations between entities and
knowledge–guided recurrent neural network, a recurrent neural
matrices. One of the entities (shaded) is associated with the
network architecture, was proposed [39], where embeddings
labels for a classification task. The network comprises 6
from a general KG were used internally for initialization. Most
autoencoders, as shown at the bottom, 1 for each entity. The
of these approaches have specialized architectures for predictive
input to the autoencoders is from the concatenated matrix
tasks and are not designed to obtain patient representations from
corresponding to each entity (shown in the input transformation
heterogeneous collections of data.
part). The bottleneck layer from the first autoencoder is used
as input to a network layer that uses the provided labels during
Methods training. Note that this illustration shows a specific example of
Supervised DCMF 5 matrices; however, the DCMF model can be used with any
collection of input matrices.
We extended the unsupervised DCMF model to incorporate
task-specific supervision. This allowed us to learn entity Combined Data-Driven and Knowledge-Based
representations that are influenced by the target variables Representation Learning Using DCMF
provided for the predictive task. Furthermore, this creates a Any graph may be represented by its adjacency matrix.
predictive model that can seamlessly learn from arbitrary However, factorization of this adjacency matrix may not yield
collections of matrices. We assumed that the predictive task, effective representations. We also observed this empirically in
for example, regression or classification, is with respect to one our experiments. Another way of using KGs is to first obtain
entity only. In the case of clinical tasks, this entity is most often graph embeddings and then use the embeddings within the CMF.
patients. All other data, such as EMRs and KGs, can be used We experimented with TransE [40] and found that this did not
as inputs from which a predictive model for patients can be yield effective representations. To obtain good representations,
built. Examples include predicting the length of stay (regression) we used the technique used previously by Liu et al [29]. The
or the risk of an unforeseen complication (classification). key idea was to compute the similarities between the nodes in
The DCMF architecture is extended by adding an additional the graphs and obtain representations by factorizing the
task-specific layer that takes as input the latent representation similarity matrices.
of the entity for which labels are provided. This layer is provided The global resource allocation (GRA) similarity, between 2
with labels during training and is trained along with the rest of nodes in a graph, was proposed by Liu et al [29] with the aim
the network. Let ep be the specific entity (eg, patients) for which of having similar embeddings for similar nodes and generalizing
task-specific labels yT are provided for a task T. Let be previous metrics. We found similarities between diseases,
the bottleneck of the autoencoder corresponding to the entity medications, and procedures (separately) from the SemMedDB
ep. The network is constructed as described above with the KG using the GRA similarity. These similarity matrices are
provided as input to CMF-based methods that internally
addition of a single network layer that takes as input and factorize all the matrices collectively, as shown in Figure 2.
has an activation layer depending on the task and loss function
https://medinform.jmir.org/2022/1/e28842 JMIR Med Inform 2022 | vol. 10 | iss. 1 | e28842 | p. 5
(page number not for citation purposes)
XSL• FO
RenderXJMIR MEDICAL INFORMATICS Kumar et al
Figure 2. Schematic of combined data-driven knowledge-based representation learning. Pairwise Global Resource Allocation similarities among clinical
entities are computed from the knowledge graph. Patient representations are learnt from these similarity matrices and the input electronic health record
data collectively using Collective Matrix Factorization-based methods. CMF: Collective Matrix Factorization; EHR: electronic health record.
We now provide an intuitive explanation of GRA similarity and between the nodes. The final GRA similarity is the sum of the
explain why it is a good measure for clinical KGs; a more contributions over all paths weighted by a factor that decays
technical description can be found in the study by Liu et al [29]. exponentially with path length:
The similarity between 2 nodes i and j is computed based on
the paths that exist between them. Such a global measure can
be applied to any 2 nodes in the graph, irrespective of their
distance within the graph. In contrast, local measures, such as
the number of common neighbors, often yield ineffective
embeddings as many node pairs may have the same scores. This
is particularly true for dense clinical KGs. By exponentially decaying the weights, shorter paths are
assigned higher weights. Thus, both the number and length of
The similarity score depends on (1) the number of paths, (2) the paths are accounted for in the similarity measure.
the length of the paths, and (3) the node degrees of the
intermediate nodes in each path. For each path between i and Liu et al [29] showed that this technique generalizes and
j, its contribution is equal to the reciprocal of the product of the outperforms many previous graph embedding methods. To our
degrees of the intermediate nodes of the path. Let pl(i,j) be a knowledge, ours is the first study to use this technique to obtain
path of length l between nodes i and j, and let the intermediate clinical KG representations and use it within a collective matrix
nodes be i1,i2,...i{l–2}. Let k(i) denote the degree of node i, that factorization setting to obtain patient representations.
is, the number of edges incoming to or outgoing from i. The Experiment Settings
contribution of a path c(pl) is defined as follows: Figure 3 shows a schematic of the experimental settings. We
considered 3 views: 1, 2, and 3. View 1 comprises data extracted
from clinical notes that have been used for patient representation
learning in several previous studies. In view 2, data from
SemMedDB KGs were extracted as described above and added
In this manner, paths that contain high-degree nodes have higher to the data from view 1. In view 3, structured data from the
denominators, and their contributions are decreased. This is EMR were also added to obtain patient representations. In the
justified as high-degree nodes connect many different nodes following section, we evaluate the performance of
and thus affect many paths. Therefore, paths that do not contain representations learned from these 3 views in 2 clinical decision
such high-degree nodes should contribute to the higher similarity support tasks.
https://medinform.jmir.org/2022/1/e28842 JMIR Med Inform 2022 | vol. 10 | iss. 1 | e28842 | p. 6
(page number not for citation purposes)
XSL• FO
RenderXJMIR MEDICAL INFORMATICS Kumar et al
Figure 3. Views 1, 2, and 3 used to obtain patient representations. EMR: electronic medical record; SemMedDB: Semantic Medline Database.
software identifies several concept types, such as anatomical
Data site, disease disorder, medication, procedure, and
Overview sign–symptoms. We considered only 3 concept
types—medication, procedure, and disease–disorder—for our
We used the Medical Information Mart for Intensive Care
analysis.
(MIMIC) III database [41], which contains clinical data of
>40,000 patients admitted to the ICUs in the Beth Israel For each of the 3 concept types, we constructed a separate
Deaconess Medical Center in Boston, Massachusetts, between matrix, where each row corresponded to a patient episode and
2001 and 2012. The data were extracted and deidentified in the columns corresponded to CUI for the clinical entity. Note
compliance with the Health Insurance Portability and that concepts identified from all the notes of a patient episode
Accountability Act standards [41]. We excluded patients with were considered together to construct the row in the matrix. The
>1 hospital stay at MIMIC-III. Patients agedJMIR MEDICAL INFORMATICS Kumar et al
As the database is very large, we excluded some relations that episodes into 90% as training set and 10% as test set. A total
were not directly related to clinical concepts in the patient data. of 3 different 90 to 10 splits were randomly generated, and all
These predicates included (1) PART_OF, indicating that a results shown were averaged over these 3 test sets.
physical unit is a part of a larger unit; (2) LOCATION_OF,
indicating the site or region of an entity; and (3) PROCESS_OF,
Clinical Decision Support Tasks
indicating the organism in which a process occurs. In addition, Predictive performance was evaluated on 2 clinical decision
all negations of the predicates in SemMedDB, which begin with support tasks.
NEG, were not considered. More details of these ontological The first task was that of the primary diagnosis category
predicates can be found in the study by Kilicoglu et al [34]. The prediction. When a patient is discharged from the hospital,
rows containing these predicates were removed from the table. clinical coders use clinical and demographic data in EMR to
From the remaining rows, only those rows where both the assign codes in a standard format, such as ICD, for billing and
subject and object CUIs were present in the 6604 CUIs used in reimbursement purposes. Several factors such as disease
the patient data were considered; the other rows were excluded. etiology, anatomical site, and severity are used in coding
The final set of triplets was used to construct an undirected algorithms [44]. This is a time-consuming and error-prone
graph in the following steps. All clinical concepts present as process, and mistakes can lead to claim denials and
subjects or objects in the triplets were used as nodes. An edge underpayment for hospitals [45]. As a result, many methods
was added to the graph between nodes u and v if there was a have been developed for automated ICD coding [3,46,47]. An
predicate with subject u and object v in the considered triplets. important code, from a billing perspective, that needs to be
Note that there may be multiple triples between the same subject ascertained is the primary diagnosis (the reason for
and object if there are different types of relations. The edges in hospitalization). Following the study by Sushil et al [6], we
our graph only indicated the existence of a relation and did not predicted the category of primary diagnosis, where the categories
describe the type. Thus, our constructed KG had 6604, 4653, were grouped into 18 generic categories that corresponded to
and 3406 nodes of 3 types—disease, medication, and procedure, diagnosis-related groups [48]. We modeled this as a multilabel
respectively—and 51,326,066 edges among them. This graph classification task.
was used to construct GRA similarity matrices, as described Our second task was that of mortality (risk of death) prediction.
earlier for diseases, medications, and procedures. At the individual patient level, such models can be used to
Structured EMR Data identify high-risk patients and prioritize their care within the
ICU. It can also aid in critical decisions such as interrupting
The prescriptions and laboratory events tables from MIMIC for
treatments or providing do-not-resuscitate orders [2,49].
the selected episodes were used directly. UMLS CUIs for
MIMIC-III provides 3 different mortality labels: in-hospital,
medications were fetched by invoking the representational state
1-month, and 1-year mortality. We used 1-year mortality, which
transfer application programming interface from RxNorm [43].
had the least class imbalance. The label indicates whether a
The UMLS CUIs for laboratories were obtained using the
patient died within 1 year of discharge from the hospital. Thus,
MRCONSO file from UMLS [30]. Thus, we obtained 1841 and
this was a binary classification task.
242 CUIs for medications and laboratories, respectively.
The label distributions for both the data sets are shown in Tables
Evaluation 1 and 2.
Overview
We evaluated the performance of the models by constructing
randomly selected held-out test sets. We split the patient
Table 1. Label distribution for 1-year mortality prediction task.
Label Meaning Episodes, n (%)
0 Not expired within 1 year after discharge 25,071 (87.79)
1 Expired within 1 year after discharge 3487 (12.21)
https://medinform.jmir.org/2022/1/e28842 JMIR Med Inform 2022 | vol. 10 | iss. 1 | e28842 | p. 8
(page number not for citation purposes)
XSL• FO
RenderXJMIR MEDICAL INFORMATICS Kumar et al
Table 2. Label distribution for diagnosis category prediction task.
Label Meaning Episodes, n (%)
0 Infection and parasitic diseases 2067 (7.24)
1 Neoplasms 2202 (7.71)
2 Endocrine, nutritional, and metabolic diseases and immunity disorders 616 (2.16)
3 Diseases of blood and blood-forming organs 96 (0.34)
4 Mental disorders 273 (0.96)
5 Diseases of nervous system and sense organs 487 (1.71)
6 Diseases of the circulatory system 11,249 (39.39)
7 Diseases of the respiratory system 2031 (7.11)
8 Diseases of the digestive system 2614 (9.15)
9 Diseases of the genitourinary system 505 (1.77)
10 Complications of pregnancy, childbirth, and the puerperium 119 (0.42)
11 Diseases of the skin and subcutaneous tissue 75 (0.26)
12 Diseases of the musculoskeletal system and connective tissue 372 (1.3)
13 Congenital anomalies 217 (0.76)
14 Certain conditions originating in the perinatal period 0 (0)
15 Symptoms, signs, and ill-defined conditions 333 (1.17)
16 Injury and poisoning 5210 (18.24)
17 Supplementary factors influencing health status and contact with health services 85 (0.3)
18 Supplementary classification of external causes of injury and poisoning 7 (0.02)
Evaluation Metrics
Models Compared
Diagnosis category prediction was a multilabel classification
We compared 3 models to obtain patient representations. The
task, and we used the standard metrics of accuracy, macro F1,
first was the SDAE that has been used in several previous
and weighted F1 scores. The F1 score is the harmonic mean of
studies. It was also found to have good performance in
precision and recall. Macro F1 is the unweighted mean of the
representation learning from clinical notes for our selected tasks
F1 score for each label. Weighted F1 determines the mean
[6]. Note that the SDAE cannot be used when KG matrices are
weighted by the number of true instances for each label.
used.
Mortality prediction is a binary classification task, and we use
The other 2 models are the nonneural versions of CMF and
the F1 score and area under the receiver operating characteristic
DCMF, which can be used in all 3 views. All 3 models were
(AUC) curve as evaluation metrics. The AUC shows the overall
unsupervised learning methods. The representations learned
classifier performance at different thresholds that trade-off
from these methods can be used to train any off-the-shelf
sensitivity for specificity.
classifier. We evaluated the performance using 2 classifiers:
random forest [50] and logistic regression. We also evaluated
DCMF in the extended supervised mode, where no additional
Results
classifier was required. Overview
The SDAE was trained following the implementation of Vincent We first present the results of the diagnosis category prediction
et al [20]. A single hidden layer was used with an embedding and then mortality prediction. For each task, we visually present
dimension of 300, with sigmoid encoding activation and linear the results in 2 ways: one organized by view and another
decoding activation. The network was trained using the organized by method. The former allowed us to compare
RMSprop optimizer with a batch size of 32, 0.4 dropout [51], methods within each view, and the latter allowed us to compare
mean square error loss function, and for 20 epochs. DCMF, views within each method.
both supervised and unsupervised, was trained using a single
hidden layer in each entity’s autoencoder, with tanh activation Diagnosis Category Prediction
functions. The weight decay of 1e-6 was used with a learning Table 3 shows the results of the diagnosis category prediction.
rate of 1e-5. The network was trained using the Adam [52]. The In view 1, predictions using supervised DCMF yielded >30%
R package for CMF [53] was used with default parameters. improvement in macro-F1 scores compared with classifiers with
SDAE-based representations. In views 2 and 3, considerable
improvement, ranging from 82% to 1955% in macro-F1 scores,
https://medinform.jmir.org/2022/1/e28842 JMIR Med Inform 2022 | vol. 10 | iss. 1 | e28842 | p. 9
(page number not for citation purposes)
XSL• FO
RenderXJMIR MEDICAL INFORMATICS Kumar et al
was observed over other methods that separately learned representations. However, with the addition of knowledge
representations and classifiers. In view 1, the accuracy and matrices in view 3, which can be performed seamlessly,
weighted F1-score of supervised DCMF were comparable with supervised DCMF surpassed their performance.
those obtained from classifiers trained on SDAE-based
Table 3. Results of diagnosis category prediction.
Model and view Accuracy (%) F1 score-macro (%) F1 score-weighted (%)
View 1
SDAEa LRb 68.25 29.99 64.99
SDAE RFc 63.03 22.74 57.79
CMFd LR 6.66 0.99 2.40
CMF RF 43.96 9.08 34.57
e 62.44 22.59 58.01
DCMF LR
DCMF RF 58.44 17.66 52.34
DCMF supervised 66.86f 39.22f 65.7f
View 2
CMF LR 39.95 3.38 22.87
CMF RF 41.05 4.99 26.83
DCMF LR 63.71 25.34 59.87
DCMF RF 62.48 22.95 58.31
DCMF supervised 67.96f 39.58f 66.69f
View 3
CMF LR 9.39 2.00 5.21
CMF RF 44.51 10.90 37.44
DCMF LR 60.94 22.56 56.94
DCMF RF 56.17 17.26 49.88
DCMF supervised 70.87f 41.10f 69.39f
a
SDAE: stacked denoising autoencoder.
b
LR: logistic regression.
c
RF: random forest.
d
CMF: collective matrix factorization.
e
DCMF: deep collective matrix factorization.
f
Best score for the corresponding view.
Figure 4 shows the results of the diagnosis category prediction all other methods. The addition of information from KGs in
across the 3 views. In view 1, we observed that neural view 2 improved the performance of DCMF, both unsupervised
representations from SDAE and DCMF outperformed nonneural and supervised, in all 3 metrics. The addition of structured EMR
representations from CMF. The supervised DCMF outperformed data in view 3 further improved the performance.
https://medinform.jmir.org/2022/1/e28842 JMIR Med Inform 2022 | vol. 10 | iss. 1 | e28842 | p. 10
(page number not for citation purposes)
XSL• FO
RenderXJMIR MEDICAL INFORMATICS Kumar et al
Figure 4. Diagnosis category prediction across Views. Top row: accuracy; middle row: macro F1 score; bottom row: weighted F1 score. CMF: collective
matrix factorization; DCMF: deep collective matrix factorization; LR: logistic regression; RF: random forest; SDAE: stacked denoising autoencoder.
Figure 5 shows the same results of diagnosis category prediction all 3 views. However, although the addition of KG matrices in
as seen in Figure 4 but is organized based on the method. SDAE view 2 improved performance over view 1, further addition of
representations cannot be used in augmented multi-view settings data in view 3 deteriorated performance. However, with the
but outperform CMF-based representations even when the CMF addition of supervision from the labels, supervised DCMF was
uses more data in views 2 and 3. This is likely because of the able to learn better with increasing performance across the 3
better representation learning capability of the neural networks. views.
We also see that the DCMF learned better representations from
https://medinform.jmir.org/2022/1/e28842 JMIR Med Inform 2022 | vol. 10 | iss. 1 | e28842 | p. 11
(page number not for citation purposes)
XSL• FO
RenderXJMIR MEDICAL INFORMATICS Kumar et al
Figure 5. Diagnosis category prediction across Models. Top row: accuracy; middle row: macro F1 score; bottom row: weighted F1 score. CMF:
collective matrix factorization; DCMF: deep collective matrix factorization; LR: logistic regression; RF: random forest; SDAE: stacked denoising
autoencoder.
from KGs and EMRs were cumulatively added to clinical notes,
Mortality Prediction supervised DCMF outperformed all the baselines by similar
Table 4 shows the results of mortality prediction. We observed margins. These results demonstrate the advantage of end-to-end
that supervised DCMF outperformed SDAE-based models by learning using supervised DCMF over other methods that
>16% in AUC and >13% in macro-F1 in view 1, where data separately learn representations and classifiers.
were obtained from clinical notes. In views 2 and 3, where data
https://medinform.jmir.org/2022/1/e28842 JMIR Med Inform 2022 | vol. 10 | iss. 1 | e28842 | p. 12
(page number not for citation purposes)
XSL• FO
RenderXJMIR MEDICAL INFORMATICS Kumar et al
Table 4. Results of mortality prediction.
Model and view AUCa (%) F1 score-macro (%) F1 score-weighted (%)
View 1
SDAEb LRc 52.06 53.15 83.95
SDAE RFd 51.55 47.77 82.65
CMFe LR 50.37 48.59 81.90
CMF RF 50.21 47.55 82.44
DCMFf LR 51.96 50.88 83.41
DCMF RF 50.31 47.48 82.58
DCMF supervised 60.44g 60.41g 83.99g
View 2
CMF LR 50.00 46.81 82.40
CMF RF 50.04 46.91 82.43
DCMF LR 53.48 53.71 84.04
DCMF RF 51.38 49.76 83.12
DCMF supervised 60.41g 60.25g 82.97g
View 3
CMF LR 49.99 46.81 82.39
CMF RF 50.00 46.95 82.37
DCMF LR 51.76 50.57 83.28
DCMF RF 50.08 47.00 82.44
DCMF supervised 61.22g 62.05g 84.43g
a
AUC: area under receiver operating characteristic curve.
b
SDAE: stacked denoising autoencoders.
c
LR: logistic regression.
d
RF: random forest.
e
CMF LR: collective matrix factorization.
f
DCMF: deep collective matrix factorization.
g
Best score for the corresponding view.
Figure 6 shows the AUC and F1 scores obtained by the methods that of SDAE. Supervised DCMF outperformed all other
across the 3 views. In view 1, the SDAE representations methods by a large margin. The addition of KG matrices in
outperform those from CMF. Results with the logistic regression view 2 improved the performance of the unsupervised
classifier were marginally better than those from the random DCMF-based classifier. The addition of structured EMR data
forest, with SDAE, CMF, and DCMF representations. In view in view 3 improved the performance of the supervised DCMF.
1, DCMF representations have performance comparable with
https://medinform.jmir.org/2022/1/e28842 JMIR Med Inform 2022 | vol. 10 | iss. 1 | e28842 | p. 13
(page number not for citation purposes)
XSL• FO
RenderXJMIR MEDICAL INFORMATICS Kumar et al
Figure 6. Mortality prediction across Views. Top row: area under receiver operating characteristic curve; bottom row: F1 score. AUC: area under
receiver operating characteristic curve; CMF: collective matrix factorization; DCMF: deep collective matrix factorization; LR: logistic regression; RF:
random forest; SDAE: stacked denoising autoencoder.
Figure 7 shows the same results from Figure 6, but is organized However, the addition of structured EMR data did not increase
based on each method. The performances of the unsupervised its performance. However, supervised DCMF is able to use
neural methods SDAE and DCMF are comparable. DCMF can additional data well and achieves the best performance overall
use information from KG matrices to boost its performance. with view 3.
Figure 7. Mortality prediction across Models. Top row: area under receiver operating characteristic curve; bottom row: F1 score. AUC: area under
receiver operating characteristic curve; CMF: collective matrix factorization; DCMF: deep collective matrix factorization; LR: logistic regression; RF:
random forest; SDAE: stacked denoising autoencoder.
model also learns patient representations internally; however,
Discussion these representations are influenced by task-specific labels used
Principal Findings for supervision. How these supervised representations perform
on tasks other than what they are trained for, that is, whether
Our experiments strongly suggest that end-to-end models that they are beneficial in transfer learning, remains to be examined.
are trained in a supervised manner outperform models Thus, for a given clinical decision support task, if labels are
comprising 2 stages of unsupervised representation learning
and an independently learned classifier. An end-to-end neural
https://medinform.jmir.org/2022/1/e28842 JMIR Med Inform 2022 | vol. 10 | iss. 1 | e28842 | p. 14
(page number not for citation purposes)
XSL• FO
RenderXJMIR MEDICAL INFORMATICS Kumar et al
available, our experiments indicate that an end-to-end model diagnosis category prediction). Furthermore, the evaluation was
should be preferred. performed on a subset of data sources (clinical notes, laboratory
investigations, and medications) from a single hospital. The
DCMF provides a seamless way of integrating multiple sources
trends in performance are expected to remain the same for other
of data for obtaining patient representations in both unsupervised
tasks (eg, regression tasks) and the addition of other data sources
and supervised settings. As a versatile learning method, it can
(eg, radiology images) but must be empirically verified.
be used with inputs from a single source (eg, clinical notes) as
well as when inputs are from multiple sources (eg, clinical notes The KG used is derived automatically from biomedical literature
and structured EMR tables). Its performance in these settings using NLP techniques. Inaccuracies because of NLP algorithms
is comparable with that of previous autoencoder-based may lead to false positives (erroneous nodes and edges) and
representation learning methods. DCMF can also be used to false negatives (incompleteness) in KG. Further investigation
obtain representations in augmented multi-view settings into the effects of these inaccuracies in the representations is
containing arbitrary collections of matrices, where most previous required. Evaluation of KGs derived from other sources can
representation learning methods cannot be used directly. In such also be performed. It is possible that the results may improve
settings, its performance is considerably superior to that of the with decreasing inaccuracies in the KG.
previous nonneural methods for CMF. Thus, it provides a
Very little hyperparameter tuning was performed for the neural
framework for infusing valuable information from auxiliary
models. The results of all neural models are expected to improve
information sources, such as KG, into patient representations.
with more tuning. The autoencoders used within the DCMF are
Graph embeddings allow us to obtain vectorial representations simple feedforward networks. Other types of autoencoders, such
of nodes in a graph in a way that incorporates the global as SDAE or variational autoencoders, may also be used, which
structural and semantic properties of the graph. Such may improve the performance of the DCMF.
embeddings can be obtained for KGs as well. The technique
for obtaining the embedding can be formulated as a factorization
Conclusions
of a similarity matrix where the similarities between nodes are In this study, we investigated the use of DCMF to obtain patient
defined based on the number and structural characteristics of representations for 2 clinical decision support tasks. The key
the paths between them. With this formulation, the factorization advantage of DCMF is its versatility: it can be used to obtain
can become part of CMF, which enables us to learn patient representations from a single view (eg, clinical notes), from
representations from multiple clinical data sources as well as multiple views (eg, notes and structured tables in EMR data),
KGs. Such patient representations were found to improve and in augmented multi-view settings where it can seamlessly
downstream predictive performance, especially in supervised integrate information from diverse sources such as EMR data
settings. Other ways of using KGs within DCMF were not found and KGs. Most previous representation learning methods cannot
to be as effective; the 2 alternatives tested were directly using be used with such augmented multi-view data. Furthermore,
the adjacency matrices of the graphs and first obtaining graph DCMF can be easily used to learn representations in both
embeddings and then using the embedding matrices within supervised and unsupervised settings. In our experiments, we
CMF. found that DCMF-based representations lead to predictive
accuracy that is comparable with or better than previous
Limitations techniques. Thus, DCMF offers an effective way of integrating
Our experimental evaluation was conducted on 2 clinical heterogeneous data sources and infusing auxiliary knowledge
decision support tasks: a binary classification task (mortality into patient representations.
prediction) and a multilabel classification task (primary
Acknowledgments
This work was supported by the Singapore Ministry of Education Academic Research Fund (R-253-000-159-114). The principal
investigator was VR.
Authors' Contributions
SK implemented supervised deep collective matrix factorization (DCMF) and scripts to use baseline algorithms. AR and AN
implemented the global resource allocation (GRA) similarity. SK, AN, and RM conducted the experiments. VR, SK, and RM
wrote the manuscript. VR conceived and supervised the project.
Conflicts of Interest
None declared.
References
1. Huddar V, Desiraju BK, Rajan V, Bhattacharya S, Roy S, Reddy CK. Predicting complications in critical care using
heterogeneous clinical data. IEEE Access 2016;4:7988-8001. [doi: 10.1109/access.2016.2618775]
https://medinform.jmir.org/2022/1/e28842 JMIR Med Inform 2022 | vol. 10 | iss. 1 | e28842 | p. 15
(page number not for citation purposes)
XSL• FO
RenderXJMIR MEDICAL INFORMATICS Kumar et al
2. Ghanvatkar S, Rajan V. Deep recurrent neural networks for mortality prediction in intensive care using clinical time series
at multiple resolutions. In: Proceedings of the ICIS Conference 2019. 2019 Presented at: ICIS conference 2019; Dec 15-18,
2019; Munich, Germany URL: https://aisel.aisnet.org/icis2019/data_science/data_science/12/
3. Gartner D, Kolisch R, Neill D, Padman R. Machine learning approaches for early DRG classification and resource allocation.
INFORMS J Comput 2015 Nov;27(4):718-734 [FREE Full text] [doi: 10.1287/ijoc.2015.0655]
4. Arnaud E, Elbattah M, Gignon M, Dequen G. Deep learning to predict hospitalization at triage: integration of structured
data and unstructured text. In: Proceedings of the IEEE International Conference on Big Data (Big Data). 2020 Presented
at: IEEE International Conference on Big Data (Big Data); Dec 10-13, 2020; Atlanta, GA, USA. [doi:
10.1109/bigdata50022.2020.9378073]
5. Miotto R, Li L, Kidd BA, Dudley JT. Deep patient: an unsupervised representation to predict the future of patients from
the electronic health records. Sci Rep 2016 May 17;6:26094 [FREE Full text] [doi: 10.1038/srep26094] [Medline: 27185194]
6. Sushil M, Šuster S, Luyckx K, Daelemans W. Patient representation learning and interpretable evaluation using clinical
notes. J Biomed Inform 2018 Aug;84:103-113 [FREE Full text] [doi: 10.1016/j.jbi.2018.06.016] [Medline: 29966746]
7. Almeida J, Silva J, Matos SJ, Oliveira JL. A two-stage workflow to extract and harmonize drug mentions from clinical
notes into observational databases. J Biomed Inform 2021 Aug;120:103849. [doi: 10.1016/j.jbi.2021.103849] [Medline:
34214696]
8. Singh A, Gordon G. Relational learning via collective matrix factorizationProceedings of the 14th ACM SIGKDD
international conference on Knowledge discovery and data mining. In: Proceedings of the 14th ACM SIGKDD International
Conference on Knowledge Discovery and Data Mining. 2008 Presented at: 14th ACM SIGKDD International Conference
on Knowledge Discovery and Data Mining; Aug 24 - 27, 2008; Las Vegas Nevada USA. [doi: 10.1145/1401890.1401969]
9. Mariappan R, Rajan V. Deep collective matrix factorization for augmented multi-view learning. Mach Learn 2019 May
17;108(8-9):1395-1420 [FREE Full text] [doi: 10.1007/s10994-019-05801-6]
10. Le Q, Mikolov T. Distributed representations of sentences and documents. In: Proceedings of the 31st International
Conference on Machine Learning. 2014 Presented at: 31st International Conference on Machine Learning; June 22-24,
2014; Beijing, China p. 1188-1196 URL: https://proceedings.mlr.press/v32/le14.html
11. Zhao J, Zhan Z, Yang Q, Zhang Y, Hu C, Li Z, et al. Adaptive learning of local semantic and global structure representations
for text classification. In: Proceedings of the 27th International Conference on Computational Linguistics. 2018 Presented
at: 27th International Conference on Computational Linguistics; Aug 20-26, 2018; Santa Fe, New Mexico, USA URL:
https://aclanthology.org/C18-1173/
12. Tian H, Tao Y, Pouyanfar S, Chen S, Shyu M. Multimodal deep representation learning for video classification. World
Wide Web 2019 May;22(3):1325-1341 [FREE Full text] [doi: 10.1007/s11280-018-0548-3]
13. Wang W, Yin H, Du X, Hua W, Li Y, Nguyen Q. Online user representation learning across heterogeneous social networks.
In: Proceedings of the 42nd International ACM SIGIR Conference on Research and Development in Information Retrieval.
2019 Presented at: 42nd International ACM SIGIR Conference on Research and Development in Information Retrieval;
Jul 21 - 25, 2019; Paris France. [doi: 10.1145/3331184.3331258]
14. Liany H, Jeyasekharan A, Rajan V. Predicting synthetic lethal interactions using heterogeneous data sources. Bioinformatics
2020 Apr 01;36(7):2209-2216. [doi: 10.1093/bioinformatics/btz893] [Medline: 31782759]
15. Ruan T, Lei L, Zhou Y, Zhai J, Zhang L, He P, et al. Representation learning for clinical time series prediction tasks in
electronic health records. BMC Med Inform Decis Mak 2019 Dec 17;19(Suppl 8):259 [FREE Full text] [doi:
10.1186/s12911-019-0985-7] [Medline: 31842854]
16. Cohen T, Widdows D. Embedding of semantic predications. J Biomed Inform 2017 Apr;68:150-166 [FREE Full text] [doi:
10.1016/j.jbi.2017.03.003] [Medline: 28284761]
17. Dasgupta S, Jayagopal A, Jun Hong AL, Mariappan R, Rajan V. Adverse drug event prediction using noisy literature-derived
knowledge graphs: algorithm development and validation. JMIR Med Inform 2021 Oct 25;9(10):e32730 [FREE Full text]
[doi: 10.2196/32730] [Medline: 34694230]
18. Dubois S, Nathanael R, David K, Nigam S, Kenneth J. Effective representations from clinical notes. arXiv. 2018 Aug 16.
URL: https://arxiv.org/abs/1705.07025 [accessed 2022-01-03]
19. Suresh H, Peter S, Marzyeh G. The use of autoencoders for discovering patient phenotypes. arXiv. 2017 Mar 20. URL:
https://arxiv.org/abs/1703.07004 [accessed 2022-01-02]
20. Vincent P, Larochelle H, Lajoie I, Bengio Y, Manzagol P. Stacked denoising autoencoders: learning useful representations
in a deep network with a local denoising criterion. J Mach Learn Res 2010 Jan 3;11:3371-3408. [doi:
10.5555/1756006.1953039]
21. Perozzi B, Al-Rfou R, Skiena S. DeepWalk: online learning of social representations. In: Proceedings of the 20th ACM
SIGKDD International Conference on Knowledge Discovery and Data Mining. 2014 Presented at: 20th ACM SIGKDD
International Conference on Knowledge Discovery and Data Mining; Aug 24 - 27, 2014; New York USA. [doi:
10.1145/2623330.2623732]
22. Grover A, Leskovec J. node2vec: scalable feature learning for networks. In: Proceedings of the 22nd ACM SIGKDD
International Conference on Knowledge Discovery and Data Mining. 2016 Presented at: 22nd ACM SIGKDD International
https://medinform.jmir.org/2022/1/e28842 JMIR Med Inform 2022 | vol. 10 | iss. 1 | e28842 | p. 16
(page number not for citation purposes)
XSL• FO
RenderXJMIR MEDICAL INFORMATICS Kumar et al
Conference on Knowledge Discovery and Data Mining; Aug 13 - 17, 2016; San Francisco California USA. [doi:
10.1145/2939672.2939754]
23. Dong Y, Chawla N, Swami A. metapath2vec: scalable representation learning for heterogeneous networks. In: Proceedings
of the 23rd ACM SIGKDD International Conference on Knowledge Discovery and Data Mining. 2017 Presented at: 23rd
ACM SIGKDD International Conference on Knowledge Discovery and Data Mining; Aug 13-17, 2017; Halifax NS Canada.
[doi: 10.1145/3097983.3098036]
24. Zhang C, Song D, Huang C, Swami A, Chawla N. Heterogeneous graph neural network. In: Proceedings of the 25th ACM
SIGKDD International Conference on Knowledge Discovery & Data Mining. 2019 Presented at: 25th ACM SIGKDD
International Conference on Knowledge Discovery & Data Mining; Aug 4-8, 2019; Anchorage AK USA. [doi:
10.1145/3292500.3330961]
25. Cui P, Wang X, Pei J, Zhu W. A survey on network embedding. IEEE Trans Knowl Data Eng 2019 May 1;31(5):833-852.
[doi: 10.1109/tkde.2018.2849727]
26. Cai H, Zheng VW, Chang KC. A comprehensive survey of graph embedding: problems, techniques, and applications. IEEE
Trans Knowl Data Eng 2018 Sep 1;30(9):1616-1637. [doi: 10.1109/tkde.2018.2807452]
27. Yang C, Xiao Y, Zhang Y, Sun Y, Han J. Heterogeneous network representation learning: a unified framework with survey
and benchmark. IEEE Trans Knowl Data Eng 2020 Dec:1. [doi: 10.1109/tkde.2020.3045924]
28. Wang Q, Mao Z, Wang B, Guo L. Knowledge graph embedding: a survey of approaches and applications. IEEE Trans
Knowl Data Eng 2017 Dec 1;29(12):2724-2743. [doi: 10.1109/tkde.2017.2754499]
29. Liu X, Murata T, Kim K, Kotarasu C, Zhuang C. A general view for network embedding as matrix factorization. In:
Proceedings of the Twelfth ACM International Conference on Web Search and Data Mining. 2019 Presented at: Twelfth
ACM International Conference on Web Search and Data Mining; Feb 11-15, 2019; Melbourne VIC Australia. [doi:
10.1145/3289600.3291029]
30. Bodenreider O. The Unified Medical Language System (UMLS): integrating biomedical terminology. Nucleic Acids Res
2004 Jan 01;32(Database issue):267-270 [FREE Full text] [doi: 10.1093/nar/gkh061] [Medline: 14681409]
31. Fact sheet MEDLINE®. U.S. National Library of Medicine. URL: httpshttp://wayback.archive-it.org/org-350/
20180312141554/https://www.nlm.nih.gov/pubs/factsheets/medline.html://www.nlm.nih.gov/pubs/factsheets/medline.html
[accessed 2021-12-21]
32. Himmelstein DS, Lizee A, Hessler C, Brueggeman L, Chen SL, Hadley D, et al. Systematic integration of biomedical
knowledge prioritizes drugs for repurposing. Elife 2017 Sep 22;6:e26726 [FREE Full text] [doi: 10.7554/eLife.26726]
[Medline: 28936969]
33. Ernst P, Siu A, Weikum G. KnowLife: a versatile approach for constructing a large knowledge graph for biomedical
sciences. BMC Bioinformatics 2015 May 14;16:157 [FREE Full text] [doi: 10.1186/s12859-015-0549-5] [Medline:
25971816]
34. Kilicoglu H, Shin D, Fiszman M, Rosemblat G, Rindflesch TC. SemMedDB: a PubMed-scale repository of biomedical
semantic predications. Bioinformatics 2012 Dec 01;28(23):3158-3160. [doi: 10.1093/bioinformatics/bts591] [Medline:
23044550]
35. Rindflesch TC, Fiszman M. The interaction of domain knowledge and linguistic structure in natural language processing:
interpreting hypernymic propositions in biomedical text. J Biomed Inform 2003 Dec;36(6):462-477 [FREE Full text] [doi:
10.1016/j.jbi.2003.11.003] [Medline: 14759819]
36. Che Z, Kale D, Li W, Bahadori M, Liu Y. Deep computational phenotyping. In: Proceedings of the 21th ACM SIGKDD
International Conference on Knowledge Discovery and Data Mining. 2015 Presented at: 21th ACM SIGKDD International
Conference on Knowledge Discovery and Data Mining; Aug 10-13, 2015; Sydney NSW Australia. [doi:
10.1145/2783258.2783365]
37. Choi E, Bahadori M, Song L, Stewart W, Sun J. GRAM: Graph-based attention model for healthcare representation learning.
In: Proceedings of the 23rd ACM SIGKDD International Conference on Knowledge Discovery and Data Mining. 2017
Presented at: 23rd ACM SIGKDD International Conference on Knowledge Discovery and Data Mining; Aug 13 - 17, 2017;
Halifax NS Canada. [doi: 10.1145/3097983.3098126]
38. Ma F, You Q, Xiao H, Chitta R, Zhou J, Gao J. KAME: Knowledge-based attention model for diagnosis prediction in
healthcare. In: Proceedings of the 27th ACM International Conference on Information and Knowledge Management. 2018
Presented at: 27th ACM International Conference on Information and Knowledge Management; Oct 22 - 26, 2018; Torino
Italy. [doi: 10.1145/3269206.3271701]
39. Yin C, Zhao R, Qian B, Lv X, Zhang P. Domain knowledge guided deep learning with electronic health records. In:
Proceedings of the IEEE International Conference on Data Mining (ICDM). 2019 Presented at: IEEE International Conference
on Data Mining (ICDM); Nov 8-11, 2019; Beijing, China. [doi: 10.1109/icdm.2019.00084]
40. Bordes A, Usunier N, Garcia-Duran A, Weston J, Yakhnenko O. Translating embeddings for modeling multi-relational
data. In: Proceedings of the 26th International Conference on Neural Information Processing Systems. 2013 Presented at:
26th International Conference on Neural Information Processing Systems; Dec 5 - 10, 2013; Lake Tahoe Nevada URL:
https://hal.archives-ouvertes.fr/hal-00920777/document
https://medinform.jmir.org/2022/1/e28842 JMIR Med Inform 2022 | vol. 10 | iss. 1 | e28842 | p. 17
(page number not for citation purposes)
XSL• FO
RenderXYou can also read