Discovering Black Lives Matter Events in the United States: Shared Task 3, CASE 2021
←
→
Page content transcription
If your browser does not render page correctly, please read the page content below
Discovering Black Lives Matter Events in the United States:
                           Shared Task 3, CASE 2021
 Salvatore Giorgi1,2 , Vanni Zavarella3 , Hristo Tanev3 , Nicolas Stefanovitch3 , Sy Hwang1 ,
  Hansi Hettiarachchi4 , Tharindu Ranasinghe5 , Vivek Kalyan6 , Paul Tan6 , Shaun Tan6 ,
        Martin Andrews6 , Tiancheng Hu7 , Niklas Stoehr7 , Francesco Ignazio Re7 ,
                    Daniel Vegh7 , Dennis Atzenhofer7 , Brenda Curtis2 ,
                                     Ali Hürriyetoğlu8
              1
                University of Pennsylvania, 2 National Institute on Drug Abuse,
   3
     European Commission, 4 Birmingham City University, 5 University of Wolverhampton,
                         6
                           Handshakes, 7 ETH Zurich, 8 Koc University
             sgiorgi@sas.upenn.edu, ahurriyetoglu@ku.edu.tr
                 Abstract                        of social processes, particularly in the domain of
                                                        socio-political and armed conflict, where spatial
    Evaluating state-of-the-art event detection sys-
                                                        analysis has become standard.
    tems for determining the spatio-temporal dis-
    tribution of the events on the ground is infre-        The complex dynamics of the Black Lives Mat-
    quently performed. Despite this, the ability to     ter movement and its varied media coverage by
    both (1) extract events “in the wild” from text     news outlets and social media make it a particularly
    and (2) properly evaluate event detection sys-      relevant use case for assessing the capability of au-
    tems has potential to support a wide variety of     tomated, Event Extraction systems to model socio-
    tasks such as monitoring the activity of socio-     political processes. The “Discovering Black Lives
    political movements, examining media cover-
                                                        Matter Events” task1 organized in the context of the
    age and public support of these movements,
    and informing policy decisions. Given the           Challenges and Applications of Automated Extrac-
    global response to the murder of George Floyd,      tion of Socio-political Events from Text (CASE)
    an unarmed Black man, at the hands of police        2021 workshop aims at doing so by challenging
    officers, we study performance of event detec-      Event Extraction (EE) engines to extract a collec-
    tion systems on detecting Black Lives Matter        tion of protest events from two heterogeneous text
    (BLM) events from tweets and news articles.         collections (i.e., news and social media). The task’s
    This shared task asks participants to identify      evaluation is done by measuring a number of spatio-
    BLM related events from large unstructured
                                                        temporal correlation coefficients against a curated
    data sources, using systems pretrained to ex-
    tract socio-political events from text. We eval-    Gold Standard data set of protest incidents from
    uate several metrics, assessing each system’s       the BLM movement.
    ability to monitor the evolution of protest            During May and June of 2020, protests occurred
    events both temporally and spatially. Results       across the globe in response to the murder of
    show that identifying daily protest counts is       George Floyd, an unarmed Black man, by Derek
    an easier task than classifying spatial and tem-    Chauvin, a white police officer. In the U.S., the
    poral protest trends simultaneously, with max-
                                                        number of locations holding demonstrations related
    imum performance of 0.745 (Spearman) and
    0.210 (Pearson r), respectively. Additionally,      to this murder outnumbered any other demonstra-
    all baselines and participant systems suffered      tion in U.S. history (Putnam et al., 2020). These
    from low recall (max 5.08), confirming the          events were more often than not associated with the
    high impact of media sourcing in the mod-           Black Lives Matter (BLM) movement, either (1) di-
    elling of protest movements.                        rectly through organizing or (2) indirectly through
                                                        the slogan “Black Lives Matter” or shared politi-
1   Introduction
                                                        cal agendas such as police abolition and protests
Typically, performance evaluations of automated         against police violence towards Black communi-
event coding engines are carried out with respect to    ties. Since its inception in 2013, the Black Lives
benchmarks made of annotated linguistic units (e.g.     Matter movement, a loose network of affiliated or-
clause, sentence or document). While this is crucial    ganizations, has organized demonstrations around
in order to factorize the individual, linguistic sub-   a large number of police shootings and killings
tasks composing the event extraction process, it        and sought to raise awareness of systematic vio-
does not estimate the overall usability of machine-       1
                                                            https://github.com/emerging-welfare/
coded event data sets for micro-level modelling         case-2021-shared-task
lence against Black communities. While support the capabilities of the best performing systems on
for Black Lives Matter has varied over its life- Task 1 (Hürriyetoğlu et al., 2021a) in this respect.
time (Horowitz, 2020), the work done over the past We believe this effort will shed light on system
years laid the foundation for the global response performances beyond precision, recall, and F1.
seen in the wake of George Floyd’s murder.
This task is the third in a series of tasks at CASE 3 Data
2021 workshop (Hürriyetoğlu et al., 2021b). The The goal of this task is to evaluate the performance
first task is concerned with protest news detection of automatic event detection systems on model-
at multiple text resolutions (e.g., the document and ing the spatial and temporal pattern of a social
sentence level) and in multiple languages: English, protest movement. We evaluate the capability of
Hindi, Portuguese, and Spanish (Hürriyetoğlu et al., participant systems to reproduce a manually cu-
2021a). Teams which participated in Task 1 were rated BLM-related protest event data set, by detect-
invited to participate in this third task: “Discover- ing BLM event reports, enriched with location and
ing Black Lives Matter Events in the United States”. date attributes, from a news corpus collection, a
This task is an evaluation only task, where all mod- Twitter collection, and from the union of the two.
els are (1) trained on the data supplied in Task 1,
(2) applied to the news and social media data (i.e, 3.1 Training Data
New York Times and Twitter data), and (3) evalu-
As a usability analysis, no training data were pro-
ated on a manually curated, Gold Standard BLM
vided for this Task. Namely, the event definition
protest event list. Each team’s system is compared
applied for coding the reference event data set
to simple baselines in order to properly evaluate
is the same as the one adopted for Shared Task
their accuracy.
1 (Hürriyetoğlu et al., 2021a) and any data uti-
lized for Task 1 and Task 2, such as the one from
2 Related Work
Hürriyetoğlu et al. (2021), or any additional data
Summary measures such as precision, recall, and could be used to build a system/model run on the
F1 are limited in their capacity to inform about input data.
the quality of the predictions of an automated
3.2 Input Data
system (Derczynski, 2016; Yacouby and Axman,
2020). Moreover, evaluating capabilities of a sys- We provide two types of input data. The first is
tem on detecting socio-political events from text a generic, not topic filtered collection of all news
requires additional metrics such as spatio-temporal items (Title and Lead Paragraph) from the New
correlation of the system output and the actual dis- York Times for the target time range May 25th -
tribution of the events (Wang et al., 2016; Althaus June 30th. The second is a collection of Black
et al., 2021). Lives Matter related tweets (Giorgi et al., 2020).
Several studies focused on assessing the corre- New York Times The New York Times (NYT)
lation of machine-coded event data sets with Gold data sets consists of 5,347 articles published be-
Standards based on disaggregated event counts, for tween May, 25 and June 30, 2020. The data as-
example Ward et al. (2013) and Schrodt and An- sociated with each article includes published date,
alytics (2015). Hammond and Weidmann (2014) print headline, lead paragraph, web URL, authors,
applied disaggregation of events incidents across and an abstract, among other meta-data. This is a
PRIO-GRID geographical cells (Tollefsen et al., general set of NYT articles (i.e., articles may or
2012) to assess the Global Database of Events, may not be related to BLM), unlike the Twitter data
Language and Tone (GDELT) data approxima- set which only contains tweets related to BLM or
tion of the spatio-temporal pattern of conflicts. counter protests (e.g., All Lives Matter and Blue
Zavarella et al. (2020) adapted this method to ad- Lives Matter).
ministrative units for measuring the impact of event
de-duplication on increasing correlation with the Twitter We used an open source data set of
Armed Conflict Location and Event Data (ACLED) tweets containing keywords related to Black Lives
data sets for a number of conflicts in Africa. In this Matter and the counter protests: All Lives Matter
report we report on an evaluation task, which we and Blue Lives Matter. While this data set con-
refer as Task 3, we provide a detailed analysis of tains tweets dating back to the origins of the BlackLives Matter movement, the tweets used in this of 3,463 events, 754 events also occurred in the
task are limited to the date range: May 25, 2020 CCC data, matching on (1) URL or (2) both date
(the date of George Floyd’s murder) to June 30, and city. We then combined the two data sets (i.e.,
2020. These tweets were pulled in real time us- the CCC events with our original list) and removed
ing the Twitter API’s keyword matching with the duplicates. This resulted in 7,976 protest events in
following three keywords: BlackLivesMatter, Al- our final Gold Standard data. The U.S. map in Fig-
lLivesMatter, and BlueLivesMatter. This data set ure 1 shows the spatial distribution of these events
consists of 30,160,837 tweets. Participants were (yellow dots).
given full access to each tweet’s meta-data (includ-
ing the tweet’s text), which could include URLs, 4 Evaluation
location information, and dates.
System performance is evaluated by computing
3.3 Gold Standard Data correlation coefficients on event counts aggregated
For the Gold Standard data (i.e., the BLM events on cell-days, using uniform grid cells of approxi-
list we wish to automatically detect) we considered mately 55 kilometers sides from the PRIO-GRID
two online sources of Black Lives Matter protest data set (Tollefsen et al., 2012). We use these ana-
events: Creosote Maps 2 and Race and Policing3 . lytical measures as a proxy to the spatio-temporal
Starting with these two data sets, we first checked pattern of the BLM protest movement.
if the source URL link was still active. If not, we
4.1 Data Normalization
referenced other data sets for the event in question:
Wikipedia (a list of George Floyd protests in and In order to be joined with PRIO-GRID shapefiles,
outside of the U.S.) and the New York Times. If string-like location information of system output
a valid article was not found matching this protest data had to be normalized to coordinate pairs. To
date and location, then we performed a Google do this we used the OpenStreetMap Nominatim
search for the specific event. If still nothing was search API5 . For structured location name repre-
found, then the event was removed from the data sentations (i.e., city, state, country) we used a para-
set. If at any point, we discovered a valid URL for metric search, otherwise we used free-form query
the event, we ran a validation check. This check strings. We note that geographical coordinate con-
asked: (1) is the source a tweet or Facebook post; version from Nominatim places the event at the ge-
(2) does the source describe an upcoming event; (3) ographical centroid of the polygon of the assigned
is the source irrelevant to the protest at the location; administrative unit. In our evaluation, we discarded
(4) does the source have enough information; and the system output event records with no source lo-
(5) is the source not accessible because of a paywall. cation information or whose string-like location
If the source passed this check, we then scraped attribute returned null results in Nominatim API.
the source for the publication date and days of the
week in the article text. If the publication date and 4.2 Metrics
the day of the week do not match, we then inferred We use the cell-days counts for two different anal-
the date of the protest by the mention of the day of ysis: the correlation with the total daily “protest
the week closest to the publication date. Finally, cell” counts (i.e., time trends alone) and the event
we manually checked the scraped or inferred dates counts for each cell-day (i.e., spatial and temporal
and record this as the event date. trends together).
In the end, this produced 3,463 distinct U.S.
events between May 25 and June 30, 2020 with Temporal Trends The first analysis only consid-
date, city, and state information. Of these events, ers the total number of “activated” cells (i.e., for
only 537 (approximately 15% of the events) oc- which at least one Protest event was recorded), in
curred after the first week of June. To compensate the system output and Gold Standard data set. This
for the lack of coverage across all of June, we used time series analysis is sufficient to estimate how
the open source data set from the The Crowd Count- well the automatic systems capture the time trends
ing Consortium (CCC)4 . From our original data set of the protest movement. However, it does not
2
https://www.creosotemaps.com/ crowdcountingconsortium/home
3 5
http://raceandpolicing.com/ https://nominatim.org/release-docs/
4
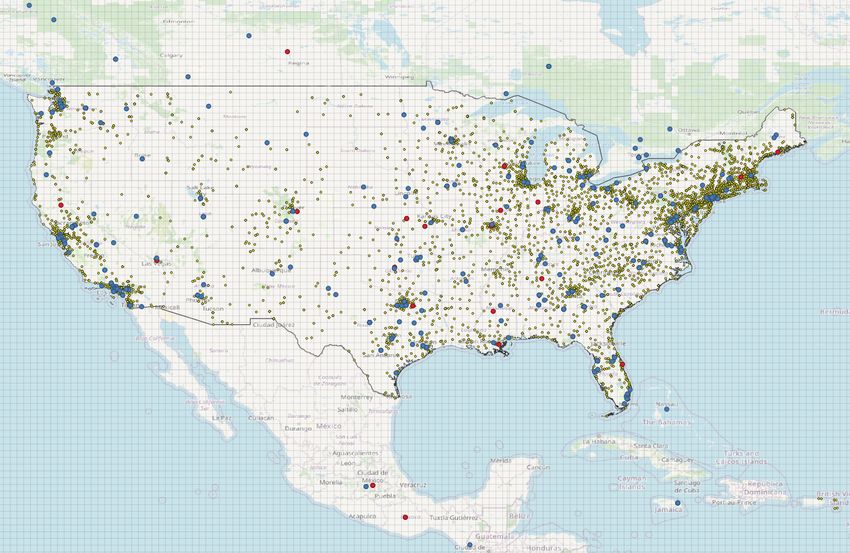
https://sites.google.com/view/ develop/api/Search/#parametersFigure 1: The geo-referenced BLM protest event records from Gold Standard (small yellow dots) overlaid with the
PRIO-GRID cells over the US. The larger red and blue dots represent events recognized by the Baseline system
from NYT and Twitter, respectively.
compute accuracy of system data in estimating the the extraction grammars of the system have been
spatial variation of the target process. learned using weakly supervised lexical learning on
generic news corpora (Tanev and Zavarella, 2014;
Spatial and Temporal Trends To this purpose, Zavarella et al., 2014). No learning was performed
we also measure the correlation coefficients on the on domain corpora in protest movements or related
absolute event counts with respect to Gold Stan- themes. Details on Nexus full taxonomy of event
dard, over each single cell-day. categories can be found in Atkinson et al. (2017).
For both analyses, we use two types of correla- For this task, we filter the events belonging to the
tion coefficients to assess variable’s relationship: following type set: Disorder/Protest/Mutiny, Boy-
Pearson coefficient r and Spearman’s rank correla- cott/Strike, Public Demonstration, Riot/Turmoil,
tion coefficient ρ. Moreover, we used Root Mean Sabotage/Impede, Mutiny. NEXUS performs event
Squared Error (RMSE) to measure the absolute geocoding by (1) matching populated place names
value of the error on estimating cell/event counts from the GeoNames gazetteer7 in the news item;
from the Gold Standard. (2) resolving them into unique location entities via
disambiguation heuristics (Pouliquen et al., 2006);
4.3 Baseline and (3) selecting a single main event location based
As a baseline, we used the output from NEXUS, on the text proximity with the matched event com-
a state-of-the-art engine for events detection from ponents (see the slots above) in the news article.
news (Tanev et al., 2008) that has been used in the In order to mitigate the lack of geographical con-
area of security and disaster management6 . We de- text in the tweet body, when processing the Twitter
note this system as Baseline throughout. Nexus is data, we ran Nexus on an enriched text, which in-
based on a blend of rule-based cascaded grammars cluded the String value of the full name field in
for detection event slots (i.e. perpetrator, various the Place child object of the tweet, whenever that
types of affected people, infrastructure and vehicle was available8 . This resulted in a small fraction of
targets and weapons used), and a combination of 32,085 tweets with geographical information (out
keyword-based and statistical classifiers for detec- of the roughly 30 million tweets originally sam-
tion of event classes. The dictionaries underlying
7
http://www.geonames.org
6 8
A spin-off of the NEXUS system is the Medical NEXUS, https://developer.twitter.com/en/
an event detection system for disease outbreaks and food docs/twitter-api/data-dictionary/
poisoning (Linge et al., 2012) object-model/tweetpled). For the sake of comparison, we shared with given the large size of the data, the above proce-
participants this subset of tweets, together with the dure was computationally expensive. Thus, the
assigned location. Python library spaCy (Honnibal et al., 2020) for re-
trieving NER/GPE entities, given its much smaller
4.4 Nexus Deduplication computational cost. The complete system details
This system, developed by the Task organizers and can be found in Ignazio Re et al. (2021).
denoted NexusDdpl, is an extension of the Baseline
EventMiner Team EventMiner’s approach for
system, where an event deduplication has been inte-
Task 3 is mainly based on transformer models (Het-
grated as a post-processing module. The algorithm
tiarachchi et al., 2021). This approach involved
uses two metrics based on geographical distance
three steps: (1) event document identification, (2)
between two event points and semantic distance,
location detail extraction, (3) and event filtering to
respectively. The semantic distance is computed
identify the spatial and temporal pattern of the tar-
using the cosine between the projections of the sen-
geted social protest movement. Event documents
tence embeddings of the texts of the events records.
are identified using the winning solution submitted
The LASER embeddings (Schwenk and Douze,
to CASE 2021 Task 1-Subtask 1: event document
2017) were used for that purpose. Twitter data
classification (Hettiarachchi et al., 2021). Next, the
has been cleaned of hashtags, URLs, and accounts
location details in event described tweets are ex-
names, as these have a negative impact on the se-
tracted. Since this team only focused on the Twitter
mantic similarity measure. In order to be consid-
corpus, they used tweet metadata to extract location
ered duplicate two events must have both distance
details. However, since the majority of the tweets
measures under a fixed threshold, which were set to
are not geotagged and to extract the location details
2km for spatial distance, 0.20 for semantic distance
mentioned in the text, they used a NER approach
on NYT data, 0.30 for semantic distance on Twit-
too. For NER, a transformer model is fine-tuned for
ter data. The reason of these different threshold
token classification using the data set released with
depending on the data sets is that Twitter data are
the WNUT 2017 Shared Task on Novel and Emerg-
noisier than NYT data, with higher variations in
ing Entity Recognition (Derczynski et al., 2017).
text size and style when describing a single event.
The BERTweet model is used since it is pretrained
As such looser threshold was required. When ap-
on Tweets (Nguyen et al., 2020). To convert the
plying on the combination of both data sets, we use
location details into an unique format and fill the
a compromise threshold of 0.35 was used.
missing details (e.g. region, country), locations are
4.5 Team Systems geocoded using the GeoPy library9 . For the final
step, event tweets with location details are grouped
Four teams participated in this event: DaDeFrNi,
based on their created dates and locations and re-
EventMiner, Handshakes, and NoConflict. We
moved the groups with fewer tweets assuming that
briefly describe the systems below and ask the
important events generate a high number of tweets.
reader to refer to their systems papers for additional
Three systems were submitted. For the first system,
details.
denoted by †, only the new events are included (i.e.,
DaDeFrNi This team considered two slightly dif- events with locations which are identified in the
ferent procedures for this task. For the NYT data previous day are removed). The second system ††,
set, they first extracted geo-entities from each ar- includes all the extracted events (i.e., no filtering as
ticle using the Python library geography, which in †). Finally, the third system ††† further filters the
was used to classify each entity in one of the three events from † to include U.S. events only. Please
categories “city”, “country”, and “region”. For the see Hettiarachchi et al. (2021) for more details
cases where an article contained the name of a city
Handshakes This model is a pretrained XLM-
but did not provide any region or country reference,
RoBERTa model, fine-tuned on the multi-language
DaDeFrNi retrieved the necessary information by
article data from Task 1 Subtask 1 and sentence
checking the city name against a worldwide cities
data from Subtask 2, with a classification head
database. When the name of a city was associated
that predicts if the input text is a protest or not.
with several locations, we filtered the city with the
We make use of the provided location data in the
highest population, along with its corresponding
9
“region” and “country”. For the Twitter data set, https://geopy.readthedocs.iodata sets, where available. Please see Kalyan et al. Data r ρ RMSE
(2021) for further details. NYT 0.646 0.626 301.98
Baseline Twitter 0.337 0.367 291.01
NoConflict Team NoConflict used their model of Merged 0.353 0.334 288.04
NYT 0.646 0.626 301.98
protest event sentence classification from the win- NexusDdpl Twitter 0.337 0.367 291.01
ning submission of the English version of Task 1 Merged 0.357 0.334 287.85
Subtask 2. Their model is based on a RoBERTa NYT -0.366 -0.264 287.04
DaDeFrNi Twitter -0.202 -0.280 306.77
(Liu et al., 2019) backbone with a second pretrain- Merged -0.408 -0.365 287.26
ing (Gururangan et al., 2020) stage done on the Twitter† 0.451 0.327 300.15
POLUSA (Gebhard and Hamborg, 2020) data set EventMiner Twitter†† 0.427 0.312 299.59
Twitter††† 0.453 0.343 300.83
before finetuned on Subtask 2 data. For the NYT HandShakes Twitter 0.424 0.254 276.13
data set, they first filtered the articles based on NYT 0.725 0.669 302.14
the section name. They then ran their model on NYT 0.745 0.762 302.96
NoConflict NYT 0.601 0.658 303.407
the abstract of each article to identify ones con- Twitter 0.534 0.524 287.88
taining protest events. For each remaining article, Merged 0.522 0.537 286.59
they run a transformer-based (Vaswani et al., 2017) Table 1: Correlation coefficients and error rates for
named entity recognition from spaCy (Honnibal daily protest cell counts: r represents Pearson corre-
et al., 2020) to identify the location and date of lation coefficient, ρ is Spearman’s rank correlation co-
the events. They covert the location to absolute efficient, and RMSE is the Root Mean Squared Error
location using the Geocoder library and convert the computed on day-cell units. Superscripts refer to the
date of the event to the absolute date based on the various systems submitted by EventMiner and NoCon-
article’s publication date. If the relative location or flict, as described in Section 4.5.
date is unavailable, they default to those included in
the metadata. The event sentence classification sys- the news and social media, independent of their
tem details can be found in Hu and Stoehr (2021). location. We see the following: (1) NoConflict
Three systems were submitted for the NYT data, surpasses the Baseline with the NYT, Twitter, and
denoted , , and . Each system used a set Merged data in both Pearson r and Spearman ρ, and
of manually curated keywords applied to different (2) EventMiner and HandShakes surpasses Base-
parts of each data point. Theses rules are included line with Twitter data in Pearson r (both systems
in the Appendix. For the Twitter data set, Team have lower Spearman ρ than Baseline). Addition-
NoConflict ran their model on the full text of each ally, NoConflict surpasses the NexusDdpl system
tweet to identify protest events. For each poten- (using NYT, Twitter, and Merged data), and the
tial event tweet, they identify the location and time HandShakes system surpasses the NexusDdpl sys-
based on the metadata of the tweet itself and the tem using Twitter data.
main tweet if it is a retweet. Table 2 reports Pearson r, Spearman correla-
tion coefficient ρ, and Root Mean Squared Error
5 Results
(RMSE) over cell-day event counts of the Base-
Table 1 shows the Pearson r, Spearman correla- line and participant systems with respect to Gold
tion coefficient ρ, and Root Mean Squared Error Standard, for the 35 days time range. Here the
(RMSE) for the total daily protest cell counts of the variables range over the whole set of PRIO-GRID
Baseline and participant systems, over the 35 days cells included in the US territory and, thus, shows
target time range. When a run for both source types the correlation of event numbers across geo-cells,
exists for a system, we also evaluate the union of thus evaluating the system’s geolocation capabili-
the two event sets (noted as “Merged” in Tables). ties. NoConflict (NYT ) had the highest Pearson r
Here, the correlations are between the total number and lowest RMSE across all systems, as well as the
of cells per day where the system found an event vs. highest Spearman ρ (with the Merged data). Using
the number of cells where event happened accord- Twitter data alone, the Baseline and NexusDdpl sys-
ing to the Gold Standard (i.e., temporal patterns tems outperformed all others in terms of Pearson
and not spatial patterns). These correlation mea- r, however NexusDdpl had a higher Spearman ρ.
sures are tolerant to errors in geocoding (as far as However, when looking at both correlation metrics
the events are located in U.S.) and evaluate the ca- simultaneously, no system is above the NexusDdpl
pability of the system to detect protest events in baseline.103 NYT 103 Twitter
102 102
Protest Cells
101 101
100 100
0 0
26 ne
31 ne
5 ly
10uly
15uly
20uly
25uly
30uly
26 ne
31 ne
5 ly
10uly
15uly
20uly
25uly
30uly
Ju
Ju
Ju
Ju
Ju
Ju
J
J
J
J
J
J
J
J
J
J
Gold Standard Baseline DaDeFrNi EventMiner Handshakes NoConflict
Figure 2: Time series of total daily protest cells from the Gold Standard (in blue), against system runs on New
York Times (left) and Twitter (right) input data. Protest cell counts are on a log scale. Baseline and NexusDdpl
systems produce the same cell count numbers (see Table 2), so the NexusDdpl system was omitted.
In Figure 2 we plot the time series of total daily with Gold Standard is shown in Table 3. Here we
protest cells for the best performing instance of report the confusion matrix between grid cells that
each system on New York Times (left) and Twit- Gold Standard and system runs code as experienc-
ter (right) data, respectively. We see the systems ing at least a protest event. It can be observed that
evaluated on the NYT data failing to pick up both only few of the cells classified as Protest by Gold
variation in the temporal patterns (i.e., a large num- Standard are detected by the automatic systems,
ber of protests early in late May and early June, which on the other hand incorrectly classified as
which gradually declines with weekly spikes) and Protest several additional cells.
the magnitude of the events (i.e, most systems pick
up less than 100 events per day). Systems evalu- 6 Conclusions
ated on Twitter data pick up more events in late The goal of the “Discovering Black Lives Matter
May and early June, but still fail to pick up the Events” Shared Task was to explore novel perfor-
magnitude of the events. mance evaluations of pretrained event detection
A more lenient representation of the agreement systems. These systems were applied to large noisy,
heterogeneous text data sets (i.e., news articles and
Data r ρ RMSE social media data) related to a specific protest move-
NYT 0.096 0.089 0.732 ment, namely, Black Lives Matter. Thus, the sys-
Baseline Twitter 0.171 0.127 0.785 tems are being evaluated out-of-domain in terms
Merged 0.181 0.132 0.724
NYT 0.100 0.088 0.725 of both data type (i.e., the systems are trained on
NexusDdpl Twitter 0.193 0.124 0.777 news data and evaluated on both news and social
Merged 0.192 0.129 0.715 media) and protest movement context (i.e., the
NYT 0.165 0.136 0.711
DaDeFrNi Twitter 0.002 -0.004 69.171 training data are not necessarily related to BLM).
Merged 0.003 0.122 87.422 Systems are evaluated in their ability to identify
Twitter† 0.155 0.077 0.715 both events across time as well as their distribution
EventMiner Twitter†† 0.147 0.077 0.715
across space. This evaluation scenario proved diffi-
Twitter††† 0.157 0.076 0.715
HandShakes Twitter 0.109 0.105 0.783 cult for all systems participating in the shared task.
NYT 0.210 0.095 0.712 A major problem, as shown on Table 3, is the sys-
NYT 0.196 0.086 0.714 tem’s low recall. No system was able to outperform
NoConflict NYT 0.184 0.082 0.715
Twitter 0.020 0.138 148.18 the NexusDdpl baseline both in precision and recall
Merged 0.018 0.145 148.20 together. The only system which outperformed the
Table 2: Correlation coefficients and error rates for cell- baseline in either recall or F1 is the DaDeFrNi (Ig-
day event counts of the Baseline and participant sys- nazio Re et al., 2021), with a recall of 5.08 and F1
tems with respect to Gold Standard. Superscripts refer of 8.86. On the other hand, two systems surpass the
to the various systems submitted by EventMiner and baseline in precision: EventMiner (Hettiarachchi
NoConflict, as described in Section 4.5. et al., 2021) and NoConflict (Hu and Stoehr, 2021),Gold Standard
Precision Recall F1
true false
true 330 341
Baseline 49.2 3.87 7.20
false 8163 195790
true 326 353
NexusDdpl 48.0 3.84 7.11
false 8167 195778
true 431 802
DaDeFrNi 35.0 5.08 8.86
false 8062 195329
true 94 74
EventMiner††† 56.0 1.11 2.17
false 8399 196057
true 328 631
Handshakes 34.2 3.86 6.94
false 8165 195500
true 81 29
NoConflict 73.6 0.95 1.88
false 8412 196102
Table 3: Confusion matrix of grid cells experiencing at least one Protest event (true) versus inactive cells (false),
for the Gold Standard, Baseline and participant systems. Unless denoted by a superscript, all systems use the
“merged” version (i.e., both NYT and Twitter data sets) except for HandShakes system which uses only Twitter
data.
with precisions of 56.0 and 73.6, respectively. Vanni Zavarella. 2017. On the creation of a security-
The low recall at this years shared task may well related event corpus. In Proceedings of the Events
and Stories in the News Workshop, pages 59–65.
be due to the low coverage of protest events of
the highly diffused BLM movement both in the Leon Derczynski. 2016. Complementarity, F-score,
NYT and Twitter corpus, so the upper bound of and NLP evaluation. In Proceedings of the Tenth In-
the recall may turn out not to be much higher than ternational Conference on Language Resources and
the system performance. One possible explanation Evaluation (LREC’16), pages 261–266, Portorož,
Slovenia. European Language Resources Associa-
for this is that a significant part of the BLM events tion (ELRA).
in the Gold standard are located in small towns,
for which NYT has a limited coverage and also Leon Derczynski, Eric Nichols, Marieke van Erp, and
they were not in the focus of social media, due to Nut Limsopatham. 2017. Results of the WNUT2017
their small scale. NexusDdpl turned out to be quite shared task on novel and emerging entity recogni-
tion. In Proceedings of the 3rd Workshop on Noisy
high both in terms of event detection accuracy, as User-generated Text, pages 140–147, Copenhagen,
well as geo-coding correlation. While no single Denmark. Association for Computational Linguis-
system outperformed all others in tracking both tics.
temporal and spatial trends, NoConflict had a clear
advantage (i.e., the highest scoring system in 2 out Lukas Gebhard and Felix Hamborg. 2020. The polusa
dataset: 0.9 m political news articles balanced by
of 3 metrics) in terms of tracking daily events. time and outlet popularity. In Proceedings of the
ACM/IEEE Joint Conference on Digital Libraries in
Acknowledgments 2020, pages 467–468.
The author from Koc University was funded by the Salvatore Giorgi, Sharath Chandra Guntuku, Muham-
European Research Council (ERC) Starting Grant mad Rahman, McKenzie Himelein-Wachowiak,
714868 awarded to Dr. Erdem Yörük for his project Amy Kwarteng, and Brenda Curtis. 2020. Twit-
ter corpus of the #blacklivesmatter movement and
Emerging Welfare. The authors from the National
counter protests: 2013 to 2020. arXiv preprint
Institute on Drug Abuse were supported in part arXiv:2009.00596.
by the Intramural Research Program of the NIH,
National Institute on Drug Abuse (NIDA). Suchin Gururangan, Ana Marasović, Swabha
Swayamdipta, Kyle Lo, Iz Beltagy, Doug Downey,
and Noah A. Smith. 2020. Don’t stop pretraining:
Adapt language models to domains and tasks. In
References Proceedings of ACL.
Scott Althaus, Buddy Peyton, and Dan Shalmon. 2021.
A total error approach for validating event data. Jesse Hammond and Nils B Weidmann. 2014. Us-
American Behavioral Scientist, 3(2). ing machine-coded event data for the micro-level
study of political violence. Research & Politics,
Martin Atkinson, Jakub Piskorski, Hristo Tanev, and 1(2):2053168014539924.Hansi Hettiarachchi, Mariam Adedoyin-Olowe, Jagdev on Challenges and Applications of Automated Ex-
Bhogal, and Mohamed Medhat Gaber. 2021. DAAI traction of Socio-political Events from Text (CASE
at CASE 2021 task 1: Transformer-based multilin- 2021), online. Association for Computational Lin-
gual socio-political and crisis event detection. In guistics (ACL).
Proceedings of the 4th Workshop on Challenges
and Applications of Automated Extraction of Socio- Jens P Linge, Marco Verile, Hristo Tanev, Vanni
political Events from Text (CASE 2021), online. As- Zavarella, Flavio Fuart, and Erik van der Goot.
sociation for Computational Linguistics (ACL). 2012. Media monitoring of public health threats
with medisys. C. WILLIAM, CWR. WEB-STER, D.
Matthew Honnibal, Ines Montani, Sofie Van Lan- BALAHUR, et al, pages 17–31.
deghem, and Adriane Boyd. 2020. spaCy:
Industrial-strength Natural Language Processing in Yinhan Liu, Myle Ott, Naman Goyal, Jingfei Du, Man-
Python. dar Joshi, Danqi Chen, Omer Levy, Mike Lewis,
Luke Zettlemoyer, and Veselin Stoyanov. 2019.
Juliana Horowitz. 2020. Amid protests, majorities Roberta: A robustly optimized bert pretraining ap-
across racial and ethnic groups express support for proach. arXiv preprint arXiv:1907.11692.
the Black Lives Matter movement. Pew Research
Center. Dat Quoc Nguyen, Thanh Vu, and Anh Tuan Nguyen.
2020. BERTweet: A pre-trained language model
Tiancheng Hu and Niklas Stoehr. 2021. Team nocon- for English tweets. In Proceedings of the 2020
flict at case 2021 task 1: Pretraining for sentence- Conference on Empirical Methods in Natural Lan-
level protest event detection. In Proceedings of the guage Processing: System Demonstrations, pages 9–
4th Workshop on Challenges and Applications of Au- 14, Online. Association for Computational Linguis-
tomated Extraction of Socio-political Events from tics.
Text (CASE 2021), online. Association for Compu-
tational Linguistics (ACL). Bruno Pouliquen, Marco Kimler, Ralf Steinberger,
Camelia Ignat, Tamara Oellinger, Ken Blackler,
Ali Hürriyetoğlu, Osman Mutlu, Farhana Ferdousi Flavio Fuart, Wajdi Zaghouani, Anna Widiger, Ann-
Liza, Erdem Yörük, Ritesh Kumar, and Shyam Charlotte Forslund, et al. 2006. Geocoding multilin-
Ratan. 2021a. Multilingual protest news detection gual texts: Recognition, disambiguation and visuali-
- Shared Task 1, CASE 2021. In Proceedings of sation. arXiv preprint cs/0609065.
the 4th Workshop on Challenges and Applications of
Automated Extraction of Socio-political Events from Lara Putnam, Erica Chenoweth, and Jeremy Pressman.
Text (CASE 2021), online. Association for Computa- 2020. The floyd protests are the broadest in us his-
tional Linguistics (ACL). tory—and are spreading to white, small-town amer-
ica. Washington Post, 6.
Ali Hürriyetoğlu, Hristo Tanev, Vanni Zavarella, Jakub
Piskorski, Reyyan Yeniterzi, Erdem Yörük, Osman Philip A Schrodt and Parus Analytics. 2015. Compar-
Mutlu, Deniz Yüret, and Aline Villavicencio. 2021b. ing methods for generating large scale political event
Challenges and Applications of Automated Extrac- data sets. In Text as Data meetings, New York Uni-
tion of Socio-political Events from Text (CASE versity, 16–17, 2015, pages 1–32.
2021): Workshop and Shared Task Report. In
Proceedings of the 4th Workshop on Challenges Holger Schwenk and Matthijs Douze. 2017. Learn-
and Applications of Automated Extraction of Socio- ing joint multilingual sentence representations
political Events from Text (CASE 2021), online. As- with neural machine translation. arXiv preprint
sociation for Computational Linguistics (ACL). arXiv:1704.04154.
Ali Hürriyetoğlu, Erdem Yörük, Osman Mutlu, Fırat Hristo Tanev, Jakub Piskorski, and Martin Atkinson.
Duruşşan, Çağrı Yoltar, Deniz Yüret, and Burak 2008. Real-time news event extraction for global
Gürel. 2021. Cross-Context News Corpus for crisis monitoring. In Natural Language and Infor-
Protest Event-Related Knowledge Base Construc- mation Systems, pages 207–218, Berlin, Heidelberg.
tion. Data Intelligence, 3(2):308–335. Springer Berlin Heidelberg.
Francesco Ignazio Re, Daniel Vegh, Dennis Atzen- Hristo Tanev and Vanni Zavarella. 2014. Multilingual
hofer, and Niklas Stoehr. 2021. Team dadefrni at lexicalisation and population of event ontologies: A
case 2021 task 1: Document and sentence classifi- case study for social media. In Towards the Multilin-
cation for protest event detection. In Proceedings of gual Semantic Web, pages 259–274. Springer.
the 4th Workshop on Challenges and Applications of
Automated Extraction of Socio-political Events from Andreas Forø Tollefsen, Håvard Strand, and Halvard
Text (CASE 2021), online. Association for Computa- Buhaug. 2012. Prio-grid: A unified spatial data
tional Linguistics (ACL). structure. Journal of Peace Research, 49(2):363–
374.
Vivek Kalyan, Paul Tan, Shaun Tan, and Martin An-
drews. 2021. Handshakes ai research at case 2021 Ashish Vaswani, Noam Shazeer, Niki Parmar, Jakob
task 1: Exploring different approaches for multi- Uszkoreit, Llion Jones, Aidan N. Gomez, Lukasz
lingual tasks. In Proceedings of the 4th Workshop Kaiser, and Illia Polosukhin. 2017. Attention is allyou need. In Advances in Neural Information Pro- graph: “Hong Kong”. NYT : include key-
cessing Systems. words: “Police Brutality, Misconduct and Shoot-
Wei Wang, Ryan Kennedy, David Lazer, and Naren Ra- ings”, “Attacks on Police”, “George Floyd Protests
makrishnan. 2016. Growing pains for global moni- (2020)”, “Demonstrations, Protests and Riots”,
toring of societal events. Science, 353(6307):1502– “Black Lives Matter Movement”; exclude key-
1503. words: “Coronavirus (2019-nCoV)”, “Quaran-
Michael D Ward, Andreas Beger, Josh Cutler, Matthew tines”, “Hong Kong Protests (2019)”; include sec-
Dickenson, Cassy Dorff, and Ben Radford. 2013. tion name: “U.S.”, “Politics”, “New York”; ex-
Comparing gdelt and icews event data. Event Data clude News Desk: “Arts & Leisure”, “Gender”,
Analysis, 21(1):267–297. “Investigative”, “Special Sections”, “Sports”, “Sci-
Reda Yacouby and Dustin Axman. 2020. Probabilistic ence”, “Magazine”, “Video”, “Podcast”, “News
extension of precision, recall, and f1 score for more Desk”, “Washington”, “Politics”, “Foreign”; ex-
thorough evaluation of classification models. In Pro- clude if present in abstract or lead paragraph:
ceedings of the First Workshop on Evaluation and
“Hong Kong”.
Comparison of NLP Systems, pages 79–91, Online.
Association for Computational Linguistics.
Vanni Zavarella, Jakub Piskorski, Camelia Ignat,
Hristo Tanev, and Martin Atkinson. 2020. Master-
ing the media hype: Methods for deduplication of
conflict events from news reports. In Proceedings of
AI4Narratives — Workshop on Artificial Intelligence
for Narratives.
Vanni Zavarella, Hristo Tanev, Ralf Steinberger, and
Erik Van der Goot. 2014. An ontology-based ap-
proach to social media mining for crisis manage-
ment. In SSA-SMILE@ ESWC, pages 55–66. Cite-
seer.
A Additional System Details
The NoConflict team produced three separate rule-
based systems for the NYT data. NYT : in-
clude keywords “Police Brutality, Misconduct
and Shootings”, “Attacks on Police”, “George
Floyd Protests (2020)”, “Demonstrations, Protests
and Riots”, “Black Lives Matter Movement”; ex-
cluded keywords: “Hong Kong Protests (2019)”;
include section name: “U.S.”, “Politics”, “New
York”, “World”; exclude News Desk: “Arts &
Leisure”, “Gender”, “Investigative”, “Special Sec-
tions”, “Sports”, “Science”, “Magazine”, “Video”,
“Podcast”, “News Desk”; exclude if present in ab-
stract or lead paragraph: “Hong Kong”. NYT :
include keywords: “Police Brutality, Misconduct
and Shootings”, “Attacks on Police”, “George
Floyd Protests (2020)”, “Demonstrations, Protests
and Riots”, “Black Lives Matter Movement”; ex-
clude keywords: “Hong Kong Protests (2019)”;
include section name: “U.S.”, “Politics”, “New
York”, “World”; exclude News Desk: “Arts &
Leisure”, “Gender”, “Investigative”, “Special Sec-
tions”, “Sports”, “Science”, “Magazine”, “Video”,
“Podcast”, “News Desk”, “Washington”, “Poli-
tics”; exclude if present in abstract or lead para-You can also read