The Year Ahead 2020 - Bar Harbor Bank & Trust
←
→
Page content transcription
If your browser does not render page correctly, please read the page content below

The Year Ahead – 2020
 In the spirit of year-end prognostication, here’s my annual review
 of long-term trends and behavioral tendencies likely to influence
 key markets in 2020…

 Mark Ungewitter is a portfolio manager at Charter Trust Company. The opinions expressed herein are those   1
 of the author. Nothing contained in this communication should be construed as investment advice.
U.S. Equities
U.S. equities entered a secular bull market in
2013, evidenced by a price breakout in dollar
terms, and a trend reversal in gold terms.
A fresh cyclical bull market began in December
2018, evidenced by breadth thrust and price
momentum.
A cyclical top near SPX 3600 is expected by mid-
2021, based on historic averages.
The next cyclical bottom is targeted for late-
2022… perhaps featuring a severe drawdown,
given lofty valuations and late-cycle economy.
2
Dow/Gold ratio… Secular bull market

                                      3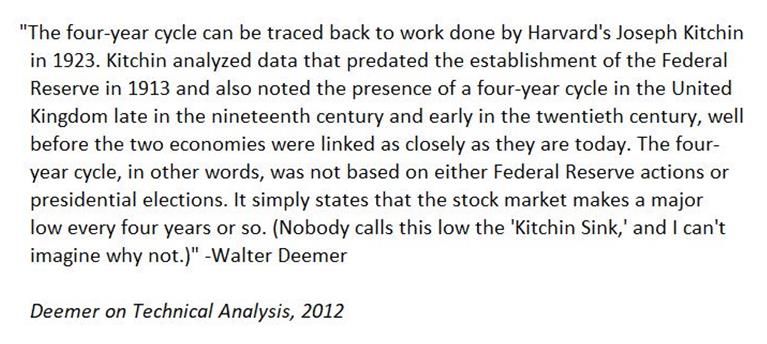
Classic thrust was observed in January 2019

                                              4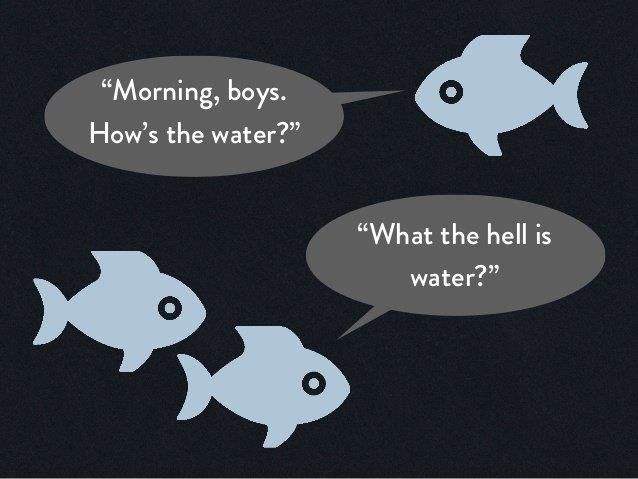
Additional thrust was observed in February 2019

                                                  5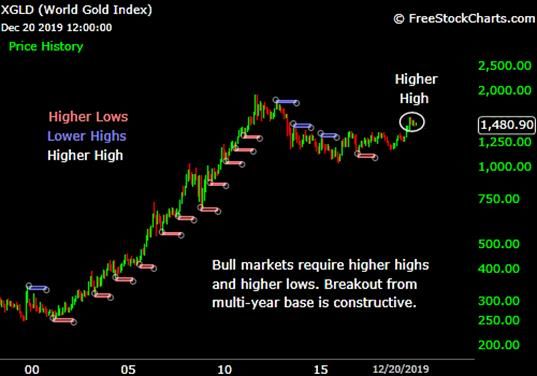
What is breadth thrust?

     Breadth thrust evidences a return of liquidity to the far
     reaches of the market.

     A basic tenet of technical analysis – unfortunately not
     taught in business school – is that thrust occurs near
     the beginning of cyclical advances, not near the end,
     as many investors suspect.

                                                                 6
Breadth thrust confirms cyclical bottoms

  “Bear markets do not end until: 1) sellers have panicked,
   and 2) buyers are panicked to buy again.” -Paul Desmond

                                                              7
What else?

             8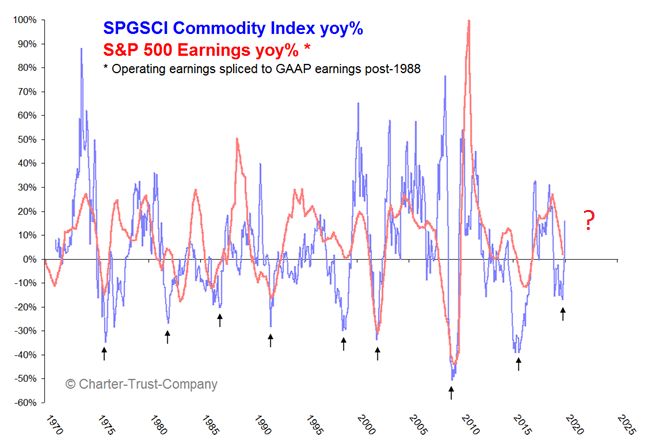
Price momentum turned bullish in April 2019

                                              9
December 2018 qualifies as 4-year cycle bottom
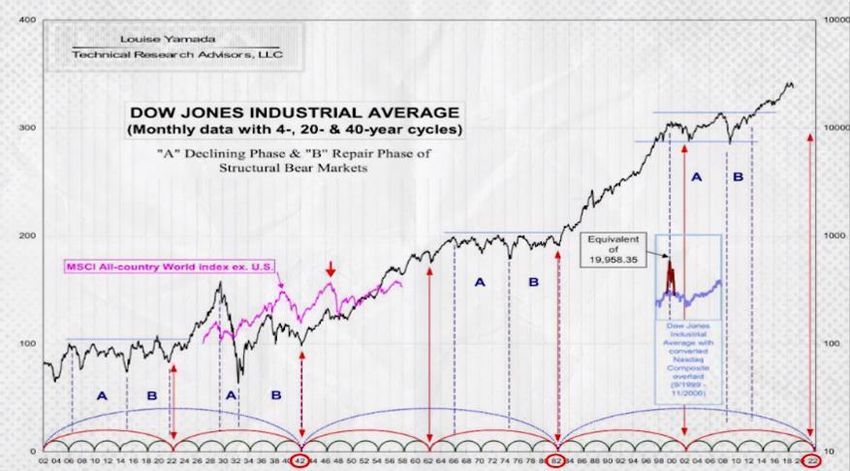
10What is the 4-year cycle?
11How long do cyclical bull markets last?
The 4-year cycle is measured from bottom to
bottom.
The cycle is typically “skewed right,” meaning that
cyclical bull markets last more than two years.
Since 1949, only one cyclical bull market lasted
less than two years.
In our experience, three years up, one year down
is the rule of thumb.
12History suggests SPX 3600 or higher by mid-2021
13Current path is normal versus bulk of prior cases
14Next cyclical bottom expected in 2022, if classic
patterns hold (Source: LYA Advisors)
15Lofty valuations suggest elevated risk
16It’s okay to begin thinking about the next bear market
17Equity recap
Plenty of upside ahead, if December 2018 was a
cyclical bottom.
Normal cyclical advance targets SPX 3600 by mid-
2021.
Maintain bullish outlook, pending contrary
evidence.
Lofty valuations suggest elevated risk; It’s not too
early to begin thinking about the next bear
market.
18Bonus comment: Cyclical bottoms are not precise
There’s nothing magic about the number 4. It’s just the
average time it has taken for human beings to traverse
the path from fear to greed, then back to fear.
19Bonus comment: Cyclical tops are not precise
The problem is not that nobody rings a bell at the top.
It’s that the bell is always ringing.
20Bonus comment (attributed to Humphey Neill)
21U.S. Bonds
A cyclical bottom in Treasury yields likely occurred
in August 2019 amid negative-yield hysteria.
Alan Greenspan, one of our favorite contrary
indicators, rang a contrarian bell on August 13th.
Nascent reversal in Copper/Gold ratio portends
higher yields ahead.
In line with our equity outlook, we have tilted
temporarily negative toward bonds.
22August 2019 looks & feels like a cyclical bottom
23A case of Greenspan being Greenspan?
“There is no barrier for U.S. Treasury yields going below zero.”
–Alan Greenspan, August 13, 2019
24Copper/Gold reversal portends higher yields ahead
A cyclical bottom in Copper/Gold, if that’s what’s transpiring,
bodes ill for U.S. bonds. Average sell-off in UST10Y was 210bp
(min. 155bp), suggesting yield target of 3.60% (min. 3.05%).
25Comment… Stocks vs. Bonds
“No recession,” says Stock/Bond ratio.
26Stocks vs. Bonds (Mind the lags)
In recent decades, cyclical bottoms in long-term
Treasury yield have tended to lag the stock market,
perhaps due to repressive monetary policy.
27Bonus cartoon…
28Gold
Gold broke out from a multi-year base in mid-2019;
the bullish case is constructive for now.
Dusting off our long-term charts, three conditions
are likely to confirm a major bull market:
1. Higher highs and higher lows (check)
2. Fresh highs in multiple currencies (check)
3. Relative strength versus S&P 500 (not yet)
Gold is likely to shine during the next cyclical bear
market, targeted for 2022.
291. Bull markets require higher highs & higher lows (Check)
302. Buy gold after multiple observations of 12-month
highs in all major currencies (Check)
313. Buy gold when gold outperforms equities (Not yet)
32Bonus quote… Ian McAvity
“It’s not what inflation says about gold,
it’s what golds says about inflation.”
33Crude Oil
Oil is trading near long-term support in both dollar
and gold terms.
Rebounding commodity prices suggest renewed
earnings growth.
Energy stocks are multi-decade cheap versus the
broad market. A return to the depths of 1999,
however, would require a 10% lag from here.
34Oil is cheap in dollar & gold terms
35Commodity bottom suggests earnings growth
36Energy stocks vs. S&P 500: long-term perspective
37Focus: Global Equities
One of today’s most glaring inter-market
divergences is the relative performance of U.S.
versus non-U.S. equities.
For dollar-based investors, non-U.S. stocks have
underperformed U.S. stocks by nearly 60% since
2010.
Chinese equities appear multi-decade cheap to the
S&P 500.
Trend-following discipline continues to favor U.S.,
but extreme valuation and positive breadth suggest
the possibility of a sea change.
38VEU vs. SPY: “The Most Important Chart in the World”
39Europe, developed-Pacific, and emerging-market indices
are all struggling vs. the S&P 500
Each sector is off approximately
60% versus SPX.
Higher highs in relative strength
would support the bull market case.
Plenty of upside, if long-term
reversal is confirmed.
40By this reckoning, China is multi-decade cheap
41Extreme valuation divergences
42Global participation >50% = Bullish
43Recap
U.S. equities are entering year two of a cyclical bull
market, suggesting further upside ahead.
We have tilted temporarily negative toward U.S.
bonds.
Gold is likely to shine during the next cyclical bear
market.
Commodity rebound suggests strong earnings
ahead.
Extreme divergences between U.S. and non-U.S.
equities are a stand-out feature in today’s market
landscape.
44Bonus page… Bitcoin
45Bonus quote… David Foster Wallace
46Bonus search… “What would make me wrong?”
47Bonus cartoon…
48Bonus cartoon…
49Want more? Follow me on Twitter
@mark_ungewitter
50You can also read