The Real Level of Unemployment 2022 - The myth of full employment across Britain Christina Beatty, Steve Fothergill, Tony Gore and David Leather
←
→
Page content transcription
If your browser does not render page correctly, please read the page content below
The Real Level of Unemployment 2022
The myth of full employment across Britain

Christina Beatty, Steve Fothergill,
Tony Gore and David Leather

THE REAL LEVEL OF UNEMPLOYMENT 2022
                                ‘

   The myth of full employment across Britain

 Christina Beatty, Steve Fothergill, Tony Gore and David Leather

       Centre for Regional Economic and Social Research
                   Sheffield Hallam University

                           May 2022

                               1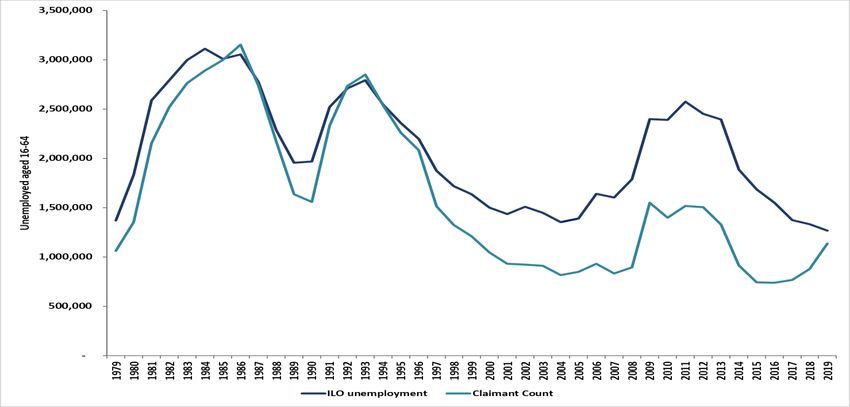
This research was funded by Sheffield Hallam University using Research England’s
Enhancing Research Culture Fund.

                                           2
Summary
This report presents an alternative set of unemployment figures for every district and unitary
authority in Great Britain. It is the sixth in a series of similar reports dating back to 1997.
The report explains how official measures of unemployment fail to adjust for distortions
arising from the operation of the benefits system and how the very large numbers of
incapacity-related claimants hide substantial unemployment.
Drawing on official statistics and proven methods, the report estimates that in early 2022 the
real level of unemployment across Great Britain as a whole was just over 2.3 million. This
compares with 1.77 million on the claimant count and only 1.31 million on the government’s
preferred measure based on ILO criteria and the Labour Force Survey.
The report estimates that there are some 790,000 ‘hidden unemployed’ on incapacity
benefits. These are men and women who might have been expected to be in work in a
genuinely fully employed economy. They do not represent fraudulent claims and they
account for slightly less than a third of the headline total of incapacity claimants of working
age.
The real level of unemployment is estimated to be broadly the same as in 2017, when similar
figures were last produced, but remains lower than the levels in the immediate wake of the
financial crisis or in the 1990s.
In Wales hidden unemployment is estimated to account for more than half of all
unemployment, and in Scotland, the North West, North East and South West hidden
unemployment accounts for approaching half the total. In London and the South East
hidden unemployment accounts for only a fifth.
Hidden unemployment is disproportionately concentrated in the weakest local economies,
particularly Britain’s older industrial areas and a number of seaside towns. In the worst
affected places, the estimated real rate of unemployment exceeds 10 per cent of all adults of
working age. By contrast, in substantial parts of southern England outside London the rate
is around 2 per cent.
(continued…)
3The report concludes that whilst some parts of Britain are now at or close to full employment,
the economy as a whole is still some way off and substantial unemployment persists in other
parts of the country.
The data for unitary and district local authorities shows that in 2022 there are really three
different Britains:
FULL EMPLOYMENT BRITAIN (below 4% real unemployment)
• 141 local authorities
• 20 million people
• Average real unemployment 2.8%
• 14% of unemployment ‘hidden’
MIDDLING BRITAIN (4-8% real unemployment)
• 158 local authorities
• 31 million people
• Average real unemployment 6.0%
• 34% of unemployment ‘hidden’
HIGH UNEMPLOYMENT BRITAIN (more than 8% real unemployment)
• 64 local authorities
• 14 million people
• Average real unemployment 9.4%
• 42% of unemployment ‘hidden’
The report argues that Levelling Up has a key role to play in reducing unemployment in less
prosperous areas and there needs to be help too, including from employers, in maintaining
labour market engagement among men and women with ill health or disabilities.
4THE REAL LEVEL OF UNEMPLOYMENT 2022
The myth of full employment across Britain
Why unemployment figures matter
In 2022 in the wake of the pandemic, ‘unemployment’ has faded as an economic and
political concern. The business pages of newspapers and the media in general are more
concerned with labour shortages and their contribution to inflatio n, and whilst no-one
suggests that unemployment has entirely disappeared the assumption is that much of Britain
is operating at close to full employment. The bad old days of mass unemployment are now
far behind it seems.
But are the official figures a reliable guide? Unfortunately, this is deeply questionable. In
particular, in the benefits system there are mechanisms that hide substantial unemployment,
meaning that the official figures consistently underestimate the true scale of unemployment.
The official numbers accurately reflect what they set out to count but they do not provide the
full picture.
This failing is more than a mere technical issue. It means that perceptions of the UK labour
market based on the official figures are distorted and likely to mislead policymakers. What’s
more, in so far as the hidden unemployment is concentrated far more in some places than
others it means that the official unemployment figures provide a misleading guide to the
disparities between different parts of the country – something that clearly matters at a time
when Levelling Up is high on the political agenda.
This is the sixth in a series of reports on the real level of unemployment that we have
published at five-yearly intervals since 1997 1. The new report, like its predecessors,
provides estimates for every unitary and district authority in Great Britain. Here we deploy
essentially the same methods as in the earlier studies but with a number of refinements. For
the first time, the report is also accompanied by an online dataset, accessible on the
Sheffield Hallam website, that allows the figures for each area to be interrogated.
1
The previous reports were f or 1997, 2002, 2007, 2012 and 2017.
5The difficulties of measuring unemployment
The casual observer might be forgiven for assuming that the level of unemploy ment is a
hard-edged number that is easily counted. Indeed, high-profile reports from players such as
HM Treasury and the Bank of England regularly provide a single definitive figure for the UK
as a whole. Look closer and the reality is more complex. Before we present our own
estimates it is therefore appropriate to explain the complexities and the often conflicting
levels of unemployment to which they can point.
The role of the benefits system
Let us begin with the impact of the benefits system. Men and women of working age who
are out-of-work actually draw on three main groups of benefits:
• Unemployment benefits. These used to be either contributions-based or income-
based Jobseeker’s Allowance (JSA). JSA remains for claimants with sufficient recent
National Insurance contributions but most unemployment benefit claimants now draw
on Universal Credit with a requirement to look for work.
• Incapacity benefits. These were originally Invalidity Benefit and Severe Disablement
Allowance, which were replaced by Incapacity Benefit, which in turn was replaced by
Employment and Support Allowance (ESA). Large numbers still remain on ESA but
since the roll-out of Universal Credit new claimants with health problems or
disabilities are placed in one of two ‘limited capability to work’ groups, neither of
which carries an immediate requirement to look for work.
• Lone parent benefits. This was once Income Support but the largest numbers now
claim Universal Credit as lone parents of young children.
The three groups are mutually exclusive. It is not possible, for example, to claim incapacity
benefits at the same time as unemployment benefits. Conventionally, only those in the first
of the three groups would be counted as ‘unemployed’. Figure 1 shows the numbers on
each of the three out-of-work benefits from 1979 to 2019 for Great Britain as a whole. We’ll
look more closely at what’s happened since then, during the pandemic, in a moment.
In the wake of recession, the numbers claiming unemployment benefits reached 3 million in
the mid-1980s, fell back, rose again during the recession of the early 1990s and then
declined to under a million. Following the 2008 financial crisis the numbers peaked at
around 1.5 million before falling back once more to below a million. From around 2017
onwards the numbers crept up again as Universal Credit was rolled out and widened the
range of claimants required to look for work.
The numbers claiming lone parent benefits rose from around 300,000 at the start of the
1980s to a peak of around 1 million in the mid-1990s. More recently the numbers on lone
parent benefits have fallen, not least because eligibility has gradually been restricted just to
those with the very youngest children.
6Figure 1: Out-of-work working age benefit claimants, GB, 1979-2019
Source: DWP
The most striking feature in Figure 1 is the rise in the numbers out-of-work on incapacity-
related benefits – up from around 750,000 at the end of the 1970s to a plateau of around 2.5
million in the early 2000s. The numbers then declined a little from this all-time high but not
by much. These remarkable numbers are in practice largely invisible: they surface in the
media from time to time but few beyond those who follow these issues are probably aware of
their scale.
The scale and timing of the increase in incapacity numbers in the years following the
deindustrialisation and job loss of the 1980s and early 90s points strongly to an element of
hidden unemployment. Indeed, it is impossible to explain the increase in health terms alone
at a time when general standards of health have slowly been improving. Over the period of
surging incapacity numbers there was also no real-terms increase in the financial value of
benefits that might have attracted more claimants, so that too cannot explain the increase. If
anything, the opposite was true – benefits were squeezed at the margins – and from the
1990s onwards there have been reforms to try to bring the numbers down.
The relevance to the measurement of unemployment is that the jobless who suffer from
health problems or disabilities generally claim incapacity benefits instead of unemployment
benefits. In practice, many unemployed people have picked up injuries over the course of
their working life and there is the effect on physical capabilities of illness, disease and simply
getting older. On top of this, mental health conditions including anxiety and depression are
widespread. In practice, therefore, many of the unemployed with health problems or
disabilities qualify for incapacity benefits and there can be a modest incentive to do so
because in many circumstances the benefit entitlement is a little higher and subject to lower
levels of conditionality.
7The result is that the very large numbers claiming incapacity benefits are likely to hide
unemployment. This does not imply, of course, that the health problems or disabilities are
anything less than real or that the benefit claims are in any way fraudulent.
Table 1 lists the local authorities with the twenty highest incapacity claimant rate s2. In all
these authorities the incapacity claimant rate exceeds 10 per cent of all adults of working
age (16-64). By contrast, in large parts of southern England outside London, where the
economy is stronger, the incapacity claimant rate is typically 2-3 per cent.
Table 1: Incapacity benefit claimant rate*, 2021, top 20 districts
% %
1. Blaenau Gwent 13.3 11. Glasgow 10.9
2. Blackpool 13.1 12. Middlesbrough 10.7
3. Inverclyde 12.8 13. Liverpool 10.6
4. Neath Port Talbot 12.5 14. Hartlepool 10.5
5. Merthyr Tydfil 12.5 15. Torbay 10.4
6. Knowsley 12.3 16. Torf aen 10.2
7. West Dunbartonshire 11.6 17. Clackmannanshire 10.2
DDunbartonshireDunbar
8. North Ayrshire 11.5 18. Burnley 10.2
tonshire
9. Rhondda Cynon Taf 11.3 19. St Helens 10.2
10, Caerphilly 11.1 20. Wirral 10.1
*% of all 16-64 year olds
Sources: ONS and DWP
The incapacity claimant rate is especially high in parts of South Wales, Merseyside, North
East England and Clydeside. These are places where standards of health have long been
known to be below the national average but what they also have in common is that they
have all experienced large-scale industrial job losses. Initially it was the ex-miners, ex-
steelworkers and other redundant industrial workers, mostly men, who drove much of the
increase in incapacity numbers in these places 3. They have now nearly all dropped out of
the figures into retirement but, where there is still a serious imbalance between labour
demand and labour supply, they have been succeeded by the generation behind them. In
these difficult local labour markets, the competition for jobs has eventually squeezed out
women with physical or mental ill health or disabilities as well 4.
2
The incapacity claimant numbers used here and subsequently in the report combine the numbers
claiming incapacity-related benefits (ESA, IB and SDA) in August 2021 and the number claiming
Universal Credit on the basis of limited capability to work in November 2021. Source: DWP.
3 See f or example C Beatty and S Fothergill (1996) ‘Labour market adjustment in areas of chronic
industrial decline’, Regional Studies, vol. 30, pp. 637-650.
4
C Beatty, S Fothergill, D Houston, R Powell and P Sissons (2009) Women on Incapacity Benefits,
CRESR, Sheffield Hallam University.
8A number of seaside towns also have high incapacity claimant rates. Blackpool and Torbay
make the top 20 but a number of other coastal districts are not far behind – Hastings, Great
Yarmouth, Scarborough, Thanet (which covers Margate and Ramsgate), Tendring (Clacton)
and East Lindsey (Skegness). These seaside towns have generally not lost jobs on the
scale of older industrial Britain but their economies have been under sustained pressure
from changing patterns of tourism and their peripheral location does not make it easy to
attract new businesses. Their distinctive housing stock – former guest houses converted
into cheap flats for example – can also draw in claimants from surrounding areas and further
afield. Their generally older population tends to boost incapacity numbers too.
The point here is that alongside the quite large numbers that claim unemployment -related
benefits there is a further, larger group out-of-work on incapacity-related benefits – and that
they are far from evenly spread across the country. A more comprehensive view of
unemployment needs to bring at least some of them into the picture.
Conflicting official measures
There are actually two official measures of unemployment, and the figures have often been
some way apart.
The claimant count – the number claiming unemployment benefits, shown earlier in Figure 1
– is an administrative count undertaken by what is these days the Department for Work and
Pensions. For many years the ‘claimant count’ and ‘unemployment’ were regarded as
synonymous but this broke down in the 1980s and 90s as changes to benefit rules reduced
entitlement and eligibility for unemployment benefits and increasing numbers fell outside the
scope of the count.
The other measure, and the one that is officially preferred and now most widely quoted, is
ILO unemployment. This is the number of people who meet the International Labour
Organisation (ILO) definition of unemployment:
• that they are out-of-work
• available to start work in the next two weeks
• and have looked for work in the last four weeks
This self-reported measure of unemployment is in theory independent of benefit status – you
don’t have to be eligible for or claiming unemployment benefits to be included. It therefore
includes unemployed jobseekers who are ineligible to receive benefit (for example because
of means-testing) and others who don’t make a claim for whatever reason.
A drawback of the ILO measure is that it is based on a sample survey, the Labour Force
Survey. Like any sample survey, the estimates for areas where the sample is small, such as
local authority districts, are therefore subject to a margin of error , requiring the Office for
National Statistics to modify the raw district-level data to take account of the claimant count
whilst still ensuring consistency with regional and national totals.
9Figure 2 compares the claimant count with the ILO unemployment figures over the period
1979 to 2019 for Britain as a whole. Whereas in the 1980s and early 1990s the two
measures were not far apart, the gap subsequently widened with ILO unemployment
substantially exceeding claimant unemployment. In the early 2010s the gap stood at just
under one million.
From around 2016 onwards the gap between claimant and ILO unemployment began to
narrow again. This reflected the gradual introduction of Universal Credit, replacing
Jobseeker’s Allowance for most unemployed claimants. Universal Credit extends the
requirement to look for work – and therefore increases the claimant count – for example to
include the partners of unemployed claimants if they too are not in work. Universal Credit
has also added some very low-paid in-work claimants to the claimant count 5. The effect of
the transition to Universal Credit has been to boost the claimant count irrespective of the
performance of the economy and labour market.
Figure 2: Claimant and ILO unemployment, GB, 1979-2019
Sources: DWP and ONS
5
These are required to look for additional hours or better-paid work as a condition of benefit receipt.
10Impact of the pandemic
The Covid-19 pandemic complicated the measurement of unemployment, and the
consequences are only now beginning to unravel. Figure 3 looks at what happened over
this period.
In early 2020 the claimant count and ILO unemployment stood at 1.2 and 1.3 million
respectively. They then diverged – the claimant count shot up to more than 2.5 million
whereas ILO unemployment peaked at only 1.7 million. From the spring of 2021 onwards,
as the economy reopened, both measures began to fall – the claimant count more steeply
than ILO unemployment – but by the start of 2022 the claimant count remained around half a
million higher than ILO unemployment.
Figure 3: Trends in worklessness during the pandemic, GB
Sources: DWP and ONS
During the pandemic both measures were flawed:
• The claimant count overestimated unemployment because it included at least
200,000 very low-income households in work (required to look for better-paid work as
a condition of UC receipt) including some qualif ying as a result of the temporary £20
a week increase in Universal Credit. Also, for administrative convenience some UC
claims that would otherwise have closed were left open for six months.
• Conversely, the ILO measure underestimated unemployment because in the unusual
and difficult circumstances of the pandemic some people who wanted to work gave
up looking and therefore failed to qualify on the ILO criteria.
11The upshot is that the claimant count now exceeds ILO unemployment, a reversal of the
situation over the previous twenty-five years. In February 2022 the claimant count for Great
Britain as a whole stood at 1.77 million and even stripping out in-work UC claimants leaves
the total at 1.55 million 6. By comparison, ILO unemployment across GB for the three months
to January 2022 stood at 1.31 million.
During the pandemic the numbers on incapacity benefits also began to creep up steadily –
across GB as a whole from just below 2.4 million at the start of 2020 to rather more than 2.5
million by the end of 2021. This renewed upward trend sits alongside Labour Force Survey
data showing that, over the same period, economic inactivity among people aged 50 to 70
rose by almost half a million 7. Whilst the LFS data identifies ‘retirement’ as the most
frequent reason for the increase, the high incapacity claimant rate amongst the over 50s
suggests that the rise in economic inactivity among this group during the pandemic is likely
to have fed through to higher incapacity claimant numbers.
Measuring ‘real unemployment’
The ‘real level of unemployment’, as defined in this report, is the sum of two components:
• Unemployment benefit claimants, who comprise:
o Universal Credit claimants who are not in employment and required to
look for work
o Jobseeker’s Allowance claimants
• The hidden unemployed among incapacity claimants
‘Unemployment benefit claimants’ are a narrower group than those now included in the
claimant count which, as we noted, now includes some men and women in work on low
incomes who are required to look for better-paid work as a condition of benefit receipt 8. We
opt to use unemployment benefit claimants as the starting point not because the level is now
higher than ILO unemployment (though it would be odd to leave out these extra
unemployed) but because:
• All these individuals are out-of-work and required to look for work as a condition of
benefit receipt
• Unemployment benefit claimants and incapacity claimants are two mutually exclusive
groups within the benefits system, so there is no possibility of double-counting
6
Source: DWP.
7
Of fice for National Statistics (2022) Movements out of work for those aged over 50 years since the
start of the coronavirus pandemic, ONS, London.
8 A very small number of JSA claimants also claim UC and are therefore double-counted in the figures
f or unemployment benefit claimants. In August 2021 across GB as a whole they account for 7,636
claimants.
12• The number of unemployment benefit claimants in each local area is a precise
administrative count, not a survey-based estimate
For unemployment benefit claimants we use the Universal Credit figures for January 2022
plus JSA numbers for August 2021, the latest local data available at the time the calculations
here were undertaken 9.
The second component – the hidden unemployed among incapacity claimants – is more
difficult to measure. The present report and the previous reports in this series all use a
‘benchmarking’ approach. For each district, a benchmark incapacity claimant rate is
generated based on the claimant rate in fully-employed parts of southern England 10 and on
underlying differences in the extent of incapacitating ill health and disability between each
district and this fully-employed part of southern England. For each district, the benchmark is
intended to reflect what should be achievable if the local economy were operating at full
employment. Excesses over the benchmark are deemed to be a form of hidden
unemployment.
The fundamentals of this approach are tried and tested 11. Its strength is that it takes account
not only of what has been shown to be possible, in term of claimant rates, in fully -employed
parts of Britain but also adjusts for underlying differences in the extent of incapacitating ill -
health and disability.
As a guide to differences in the incidence of incapacitating ill-health we use the ratio
between the Standardised Mortality Rate (SMR) in each district 12 and the SMR in the fully-
employed part of southern England. In effect, if the SMR in a district is 20 per cent abov e
the level in fully-employed southern England we would expect the incapacity claimant rate to
be 20 per cent higher. SMRs measure the death rate in each area after adjusting for the age
structure of the local population and are widely regarded as the single most objective
measure of health. Ultimately, they provide only a proxy for variations in incapacitating ill
health or disability from place to place but they do offer a guide that is unaffected by benefit
status, which is a clear risk affecting survey-based data on self -reported health. We use the
SMRs for 2019 to avoid distortions arising from the Covid-19 pandemic.
This approach using SMRs was piloted in our 2017 report, replacing the use of data on
‘permanent sickness’ from the 1981 Census, before the surge in incapacity claimants, which
has become too historic to offer a guide 13.
9
Sources: DWP.
10
Def ined here and in earlier reports as Berkshire, Buckinghamshire, Hampshire (minus Portsmouth
and Southampton), Hertfordshire, Oxfordshire, Surrey and West Sussex.
11 In addition to the earlier reports in this series, see C Beatty and S Fothergill (2005) ‘The diversion
f rom ‘unemployment’ to ‘sickness’ across British regions and districts’, Regional Studies, vol 39, pp
837-854.
12
Source: ONS.
13 For Britain as a whole in 2017 the method based on SMRs generated an estimate of hidden
unemployment that was 35,000 higher than the previous method.
13The method deployed here to estimate hidden unemployment on incapacity benefits adjusts
for the biggest single distortion to official unemployment figures. It is nevertheless worth
underlining that the resulting figures all remain estimates subject to a residual margin of
error.
National overview
For Great Britain as a whole in early 2022 our methods point to a level of unemployment that
is substantially higher than the official figures:
Unemployment benefit claimants 1,550,000
plus Hidden unemployed on incapacity benefits 790,000
--------------
equals REAL LEVEL OF UNEMPLOYMENT 2,340,000
Our estimate is that in early 2022 the real level of unemployment across Britain stands at
just over 2.3 million. Some two-thirds are the ‘visible’ or recorded unemployed in the
claimant count. The remaining third are the ‘hidden’ unemployed on incapacity benefits.
The combined total represents an unemployment rate of 5.8 per cent of the working age
population.
We estimate that across Britain as a whole hidden unemployment on incapacity benefits
accounts for 790,000 men and women. These are the claimants who might reasonably be
expected to have been in work in a genuinely fully-employed economy.
This large number of hidden unemployed needs to be seen in the context of the headline GB
total of 2.57 million out-of-work on incapacity benefits. In effect, our figures suggest that
almost 1.8 million men and women would remain on incapacity benefits even if there were
full employment across the whole country. The hidden unemployed are a minority of
incapacity claimants (around 30 per cent) and again it is worth emphasising that there is no
suggestion here that the claims are in any way fraudulent or that the health problems or
disabilities are anything less than real.
Table 2 compares the new estimates for 2022 with the figures from our previous studies14.
Three points are worth noting.
First, at just over 2.3 million the real level of unemployment in 2022 is little changed on the
level in 2017 and still well down on the post-financial crisis figure for 2012, or indeed the
much higher level back in the 1990s.
14
Because of the revised method for estimating hidden unemployment among incapacity claimants
the pre-2017 f igures are not fully comparable with the later data.
14Table 2: The real level of unemployment, GB 1997-2022
1997 2002 2007 2012 2017 2022
Unemployment benefit claimants* 1,835,000 980,000 940,000 1,555,000 785,000 1,550,000
Additional ILO unemployed 315,000 470,000 650,000 985,000 735,000 0
Hidden on incapacity benefits 1,020,000 1,150,000 1,010,000 900,000 760,000 790,000
REAL UNEMPLOYMENT 3,180,000 2,600,000 2,600,000 3,440,000 2,280,000 2,340,000
*Claimant count 1997-2012
Sources: ONS, DWP and Sheffield Hallam estimates
Second, whereas the ‘visible’ unemployed were for many years split between those claiming
unemployment benefits and the additional unemployed meeting the ILO criteria, the wider
scope of Universal Credit means that the claimant numbers are now larger than the ILO-
based count.
Third, hidden unemployment on incapacity benefits appears to have stopped falling.
Between 2002 and 2017 the numbers fell by around 400,000 but, at 790,000, hidden
unemployment on incapacity benefits is now estimated to be around 30,000 higher than in
201715. This is nevertheless still well down on peak levels.
Regional differences
Table 3 shows the estimated real unemployment by region and nation across Great Britain.
The North East and Wales top this list, both with a rate of 7.7 per cent of the working age
population – a long way from full employment. At the other end of the spectrum the rate in
the South East of England is just 3.8 per cent. In effect, the unemployment rate in the worst-
hit regions is double the rate in the best.
It needs to be emphasised that the unemployment rates here, and subsequently in the
report, are all expressed as a percentage of the working age population. This differs from
official statistics, which use the economically active population (i.e., the employed plus the
unemployed) which is smaller. The effect is that the unemployment rates shown here and
elsewhere in the report are all lower – by around a quarter – than if they had been expressed
in relation to the economically active population. For example, in the North East and Wales
the unemployment rates expressed in relation to the economically active population are 10.2
and 9.9 per cent respectively. We use the working age population because the
‘economically active’ excludes incapacity claimants16.
15
From 2010 onwards the staged increase in the state pension age for women (from 60 to 66) and
f rom 2018 for men (from 65 to 66) will have added to incapacity numbers.
16 Data availability means that the working age population is defined here as 16-64. Following the
raising of the state pension age, 65 year olds also qualify for unemployment and incapacity benefits
and are included in the benefits data.
15Table 3: The real level of unemployment by region and country, early 2022
Unemployment Hidden on Real
benefit incapacity unemployment
% of working
claimants benefits
age
North East 74,100 54,000 128,000 7.7
Wales 67,400 83,000 150,000 7.7
North West 195,400 147,000 342,000 7.5
Scotland 122,300 102,000 224,000 6.4
West Midlands 174,600 61,000 235,000 6.4
Yorkshire & Humber 141,400 78,000 219,000 6.4
London 299,200 72,000 371,000 6.1
East Midlands 97,300 49,000 146,000 4.9
South West 92,300 63,000 155,000 4.6
East of England 119,500 38,000 157,000 4.1
South East 170,000 41,000 211,000 3.8
Great Britain 1,550,000 790,000 2,340,000 5.8
Sources: ONS, DWP and Sheffield Hallam estimates
Table 4: Share of unemployment hidden on incapacity benefits, early 2022
%
Wales 55
Scotland 46
North West 43
North East 42
South West 41
Yorkshire & Humber 36
East Midlands 34
West Midlands 26
East of England 24
South East 19
London 19
Great Britain 34
Sources: ONS, DWP and Sheffield Hallam estimates
16Table 4 makes the point that hidden unemployment is far more significant in some regions
than others. Our estimates suggest that rather more than half the total unemployment in
Wales is hidden on incapacity benefits. In Scotland, the North West, North East and South
West the proportion not far below half. By contrast, in London and the South East the
proportion estimated to be hidden on incapacity benefits is just 19 per cent.
This uneven distribution of hidden unemployment has important implications for the way
regional differences are understood because, broadly, it is the least prosperous regions that
have the highest incidence of hidden unemployment. By omitting hidden unemployment, the
official figures therefore seriously understate the differences between regions in the strength
of the local labour market.
Real unemployment at the local level
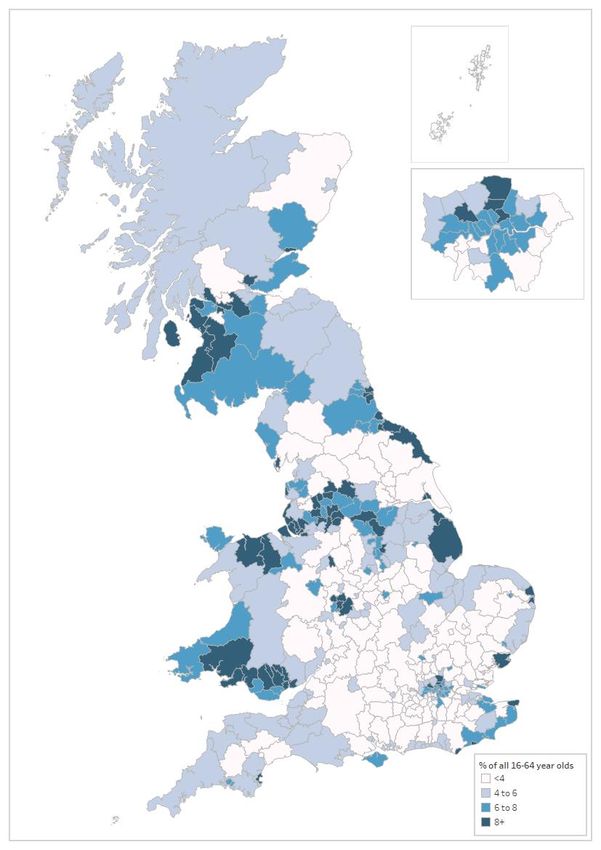
Figure 4 shows the estimated real rate of unemployment by district and unitary authority.
The figures for each authority are presented in the appendix.
The map shows how high unemployment remains a defining feature of substantial parts of
Britain. Parts of South Wales, North Wales, Central Scotland, North East England, South
and West Yorkshire, and the Liverpool, Manchester and Birmingham areas stand out as
having particularly high levels. In this respect the figures here confirm what official figures
have been showing for many years but the real unemployment data exposes the extent to
which the problem in these places is much worse than official statistics suggest.
Unemployment in these mostly older industrial areas typically remains in excess of 8 per
cent, and in some cases above 10 per cent, of the entire working age population.
In a number of districts covering seaside towns the real unemployment rate also reaches
these high levels. Several London boroughs also have high unemployment, though to a
significant extent this reflects residential segregation between ‘rich’ and ‘poor’ areas within
the capital.
On the other hand, there is little to suggest that unemployment is more than a marginal issue
in large parts of southern England outside London. Some parts of northern England, such as
much of North Yorkshire, also fall into this category. In these places, the real level of
unemployment is typically below 4 per cent and sometimes nearer 2 per cent.
Table 5 lists the local authority districts with the highest and lowest real unemployment. Of
the 50 districts with the highest rates, around 30 cover older industrial towns. Seaside towns
– including Blackpool at the top of the list – account for another eight and the bigger regional
cities for ten. Just two London boroughs (Haringey and Brent) make the list. These 50
areas could claim to be Britain’s main unemployment ‘blackspots’.
17Figure 4: Estimated real unemployment by district, early 2022
18Table 5: Estimated real unemployment: highest and lowest districts, early 2022
% of working age % of working age
TOP 50 DISTRICTS (cont)
1. Blackpool 14.7 40. Sandwell 8.9
2. Blaenau Gwent 12.2 41. St Helens 8.9
3. Knowsley 11.8 42. East Lindsey 8.9
4. Middlesbrough 11.6 43. Blackburn with Darwen 8.8
5. Hastings 11.4 44. Halton 8.8
6. North Ayrshire 10.9 45. Dundee 8.8
7. Liverpool 10.9 46. Salf ord 8.6
8. Inverclyde 10.9 47. Newport 8.5
9. Merthyr Tydfil 10.8 48. Walsall 8.5
10. Hartlepool 10.8 49. Swansea 8.4
11. West Dunbartonshire 10.7 50. Rotherham 8.4
12. Birmingham 10.6
13. Neath Port Talbot 10.5 BOTTOM 20 DISTRICTS
14. Thanet 10.5 343. Eastleigh 2.0
15. Burnley 10.4 344. West Oxfordshire 2.0
16. Great Yarmouth 10.2 345. Cotswold 2.0
17. Hull 10.1 346. Epsom & Ewell 2.0
18. Rochdale 9.9 347. Vale of White Horse 1.9
19. Glasgow 9.8 348. South Oxfordshire 1.9
20. Caerphilly 9.7 349. Uttlesford 1.9
21. Torbay 9.6 350. Fareham 1.8
22. Wolverhampton 9.6 351. Rushcliffe 1.8
23. South Tyneside 9.6 352. York 1.7
24. Hyndburn 9.5 353. Guildf ord 1.7
25. Rhondda Cynon Taf 9.4 354. Ribble Valley 1.7
26. Haringey 9.4 355. South Cambridgeshire 1.7
27. Oldham 9.3 356. Waverley 1.7
28. Redcar & Cleveland 9.3 357. Harborough 1.7
29. Sef ton 9.3 358. Mid Sussex 1.7
30. Torf aen 9.2 359. Rutland 1.7
31. Tendring 9.2 360. Wokingham 1.7
32. Bradf ord 9.1 361. Hart 1.6
33. Bolton 9.1 362. Richmondshire 1.5
34. Wirral 9.1
35. Eastbourne 9.0
36. Sunderland 9.0
37. Brent 8.9
38. East Ayrshire 8.9
39. Stoke on Trent 8.9
Source: Sheffield Hallam estimates based on ONS and DWP data
19The 20 places with the lowest real unemployment rates are a mixture of rural and suburban
districts, mainly in southern England. These districts, plus a number of others where the real
unemployment rate is in the 2-3 per cent range, can legitimately claim to be operating at or
near full employment. Richmondshire, with the lowest real unemployment of all (1.5 per
cent) is a district in North Yorkshire and coincidentally the constituency of the present
Chancellor of the Exchequer, which perhaps provides a salutary reminder that ministers’
knowledge of their constituency is not a good basis for national policymaking.
In many of the places with the highest real level of unemployment, hidden unemployment
accounts for a high proportion of the total. Table 6 lists the 20 local authorities with the
highest share. In all of these the share exceeds 50 per cent and at the top of the list, in
Neath Port Talbot, hidden unemployment falls just short of 70 per cent. Local authorities in
South Wales are particularly prominent on this list, accounting for all six top places and nine
of the top 20.
Where claimant unemployment is high, hidden unemployment is nearly always high as well.
This is consistent with the view that in difficult labour markets the men and women with
health problems or disabilities are disadvantaged in finding or retaining work and that, when
they fall out of employment, they boost the numbers claiming incapacity benefits rather than
unemployment benefits.
London is the important exception to the rule that high claimant unemployment and high
hidden unemployment go together. A number of London boroughs now have high claimant
unemployment – higher indeed than before the pandemic – but this is not matched by high
numbers of hidden unemployed on incapacity benefits. Given that the likelihood of claiming
incapacity benefits rises with age, and that London has a markedly younger workforce than
the rest of the country, the lower incapacity claimant rate in London is not entirely surprising.
The effect, however, is that much more of London’s unemployment is ‘visible’ in the claimant
unemployment figures.
Table 6: Share of unemployment hidden on incapacity benefits, early 2022, top 20 districts
% %
1. Neath Port Talbot 69 11. Scarborough 59
2. Blaenau Gwent 66 12. Torf aen 59
3. Merthyr Tydfil 63 13. Swansea 58
4. Carmarthenshire 63 14. Wirral 58
5. Caerphilly 63 15. Copeland 58
6. Rhondda Cynon Taf 63 16. Allerdale 58
7. Torbay 62 17. Knowsley 57
DDunbartonshireDunbar
8. Inverclyde 62 18. Chesterf ield 57
tonshire
9. Bridgend 60 19. Eilean Siar 57
10, Barrow in Furness 59 20. Bolsover 56
Sources: ONS, DWP and Sheffield Hallam estimates
20The scale and nature of contemporary unemployment
The evidence here shows that official statistics provide at best a partial view of the scale of
unemployment across Britain. The UK continues to hide large numbers of unemployed on
incapacity benefits and the numbers of hidden unemployed are more than enough to cast a
different light on the state of the labour market. In particular, the myth that the UK economy
is now operating at or near full employment should be dismissed.
What the data also shows is that big variations in the health of regional and local economies
are still very much with us. Based on our estimates for unitary and district local authorities,
in 2022 there are really three different Britains:
FULL EMPLOYMENT BRITAIN (below 4% real unemployment)
• 141 local authorities
• 20 million people
• Average real unemployment 2.8%
• 14% of unemployment ‘hidden’
MIDDLING BRITAIN (4-8% real unemployment)
• 158 local authorities
• 31 million people
• Average real unemployment 6.0%
• 34% of unemployment ‘hidden’
HIGH UNEMPLOYMENT BRITAIN (more than 8% real unemployment)
• 64 local authorities
• 14 million people
• Average real unemployment 9.4%
• 42% of unemployment ‘hidden’
Hidden unemployment tends to be concentrated in the weakest local labour markets. The
effect of its inclusion in the figures is therefore to widen the gap between the best and worst
areas across the country. Extensive parts of southern England outside London, and several
other places too, do indeed seem to be at or close to full employment but that is emphatically
not the case in most of the older industrial areas of the North, Midlands, Scotland and
Wales, or indeed in quite a number of seaside towns.
The high level of vacancies does not dent this assessment. Prior to the Covid-19 pandemic,
the ONS Vacancy Survey typically recorded around 800,000 a month. During the first
lockdown in 2020 this fell to not a great deal more than 300,000 a month and until well into
2021 the number of vacancies remained below the long-term norm. But by the autumn of
2021 monthly vacancies rose to around 1.2 million – a new record. Some of this recovery
will reflect posts held vacant during the pandemic but, more importantly, as the labour
market finally improved during 2021 it triggered a higher level of job turnover. More workers
began to move from employer to employer – a clear observation from quarterly Labour Force
Survey data – which in turn resulted in a higher level of vacancies as employers moved to fill
posts. The point here is that most vacancies are not ‘hard-to-fill posts’ but instead just jobs
21that have become vacant as the previous employee has moved on. In effect, vacancy data
is a better guide to labour turnover than a shortage of workers.
It is nevertheless important to be clear about the nature of the unemployment we identify.
The problem is different from what it was thirty years ago. Even allowing for distortions to
the official figures, UK unemployment is down on peak levels. For many of the workless the
problem is therefore unlikely to be that they cannot find any job at all, which was probably
the case in the era of three million claimant unemployed, but rather that they have difficulty
finding suitable work with acceptable pay and conditions that also matches their skills and
capability, and indeed that they can access if they don’t own a car. Zero-hours contracts,
shift-working and jobs that are incompatible with childcare are not realistic options for many.
In contemporary Britain there are simply not enough ‘good jobs’ to satisfy everyone in all
parts of the country. In many places it has been erosion of manufacturing industry, in
particular, that has removed a layer of jobs that once filled a key gap in the middle of the
labour market.
It is also important to be clear about the nature of hidden unemployment on incapacity
benefits. As we noted, the health problems or disabilities are not necessarily anything less
than real, nor the benefit claims in any way fraudulent. Also, the hidden unemployed on
incapacity benefits are not necessarily active jobseekers – indeed, the majority have given
up looking for work. Incapacity claimants are only too well aware of their health problems or
disabilities and are shrewd enough to know that they would be at the back of the queue for
jobs because most employers prefer to take on healthier workers who they think will be more
productive and reliable.
What we are arguing is that the hidden unemployed would have been in work in a genuinely
fully-employed economy. In this respect official statistics understate the scale of
unemployment across Britain, especially in the least prosperous parts of the country.
Furthermore, because of the sheer number of incapacity claimants – nearly 2.6 million
across Great Britain, of which we estimate that 790,000 are hidden unemployed – this major
distortion to unemployment figures cannot be ignored.
Bringing the numbers down
What then is the way to bring down these persistently high levels of unemployment? There
are three fundamental elements to a solution.
The first is to grow the national economy. A healthy rate of growth always brings down the
national level of unemployment and, because local and regional labour markets are so
interconnected, in just about all parts of the country as well. Of course, it’s easy to say ‘grow
the national economy’ but the challenge is to find ways of doing so. Here is not the place to
enter into a discussion of macroeconomic policy or industrial strategy but the point remains
that the national economy is critically important to local and regional unemployment.
22The second element is local and regional economic development – or what has recently
become known as ‘Levelling Up’. This is arguably now the key to lower unemployment
because the slack in the UK labour market is far from evenly spread around the country.
Substantial part of Britain – broadly the pale areas on the map in Figure 4 – are already at or
close to full employment so growing the national economy can’t be expected to bring down
unemployment much further in these places. It is also unrealistic to expect large numbers
from high unemployment areas to move to work in these fully-employed parts of Britain
because these places, mostly in the south, are often the ones with the highest house prices
and the greatest constraints on new housebuilding.
There is actually a lot of positive experience, accumulated over many decades, about how to
deliver successful Levelling Up. Indeed, to dismiss previous experience as a ‘failure’ is quite
misleading, even if it has too often been the case that the genuine progress that has been
made has been offset by continuing job losses from older industries. Investment in
infrastructure is important, but so too is support for business, including regional investment
aid – a tool the UK government has recently neglected despite its effectiveness over the
years. Investment in skills and in R&D have roles to play as well. In truth there never has
been a single ‘silver bullet’ that can deliver Levelling Up. The reality is that Levelling Up
requires sustained action on a broad front and different places often require different
solutions tailored to local circumstances. However, by relieving pressures on the labour and
housing markets in large parts of southern England, the more prosperous parts of the
country actually have as much to gain from Levelling Up as the places dogged by high
unemployment.
The third element in bringing down unemployment is support to help individuals engage with
the labour market. This is especially important in the context of the hidden unemployed on
incapacity benefits, whose present-day detachment from the world of work is often
considerable even though they often have many years of previous work experience.
Realistically, many incapacity claimants are unable to return to work – even our estimates
suggest that it is a minority who would probably have been in work in a genuinely fully
employed economy. In practice, the key challenge is probably to reduce the numbers
dropping out of the labour market – to stem the onflow to incapacity benefits and to facilitate
an early return to work.
This is a process that needs to involve employers at least as much as claimants themselves.
For too long, employers have been too ready to discard men and women with health
problems and/or disabilities. In the years before Brexit, for example, employers often opted
for cheaper and healthier migrant workers even when there was an untapped local surplus of
workers on incapacity benefits. Even if new jobs can be delivered in the right places,
employers’ attitudes need to change. They need to be more flexible about expectations and
requirements, and more open-minded about potential employees who may have been out of
the labour market for some while but still have skills and abilities to offer.
23APPENDIX: Estimated real level of unemployment by district and unitary authority,
early 2022
Real unemployment
% of
Unemployment Hidden on
working
benefit incapacity Number
age
claimants benefits
population
GREAT BRITAIN 1,550,000 790,000 2,340,000 5.8
ENGLAND 1,365,000 600,000 1,970,000 5.6
NORTH EAST 74,100 54,000 128,000 7.7
County Durham 12,390 12,300 24,700 7.5
Darlington 2,830 1,600 4,400 6.8
Hartlepool 3,140 3,100 6,200 10.8
Middlesbrough 5,830 4,400 10,200 11.6
Northumberland 6,730 4,300 11,100 5.8
Redcar & Cleveland 3,570 4,000 7,600 9.3
Stockton-on-Tees 5,140 3,300 8,400 6.9
Tyne and Wear
Gateshead 5,710 4,000 9,800 7.7
Newcastle upon Tyne 9,740 3,600 13,300 6.4
North Tyneside 4,800 2,500 7,300 5.7
South Tyneside 5,450 3,500 8,900 9.6
Sunderland 8,810 6,800 15,600 9.0
NORTH WEST 195,400 147,000 342,000 7.5
Blackburn with Darwen 4,980 3,300 8,200 8.8
Blackpool 6,330 6,000 12,300 14.7
Cheshire East 5,580 2,500 8,100 3.5
Cheshire West & Chester 5,750 4,100 9,800 4.7
Halton 3,220 3,800 7,000 8.8
Warrington 3,780 1,600 5,400 4.2
Cumbria
Allerdale 1,440 1,900 3,300 5.8
Barrow-in-Furness 1,350 1,900 3,200 8.0
Carlisle 1,950 2,100 4,100 6.3
Copeland 1,090 1,500 2,600 6.4
Eden 550 300 800 2.6
South Lakeland 930 400 1,400 2.3
Greater Manchester
Bolton 9,910 6,200 16,100 9.1
Bury 5,130 3,200 8,300 7.2
Manchester 22,750 9,800 32,600 8.3
Oldham 9,350 4,300 13,600 9.3
24Real unemployment
% of
Unemployment Hidden on
working
benefit incapacity Number
age
claimants benefits
population
Rochdale 8,210 5,500 13,700 9.9
Salf ord 8,980 5,900 14,900 8.6
Stockport 6,310 4,000 10,300 5.8
Tameside 6,610 4,800 11,400 8.1
Traf f ord 4,330 1,900 6,300 4.3
Wigan 8,090 6,100 14,200 6.9
Lancashire
Burnley 2,960 2,600 5,600 10.4
Chorley 1,850 900 2,800 3.8
Fylde 1,360 800 2,200 4.7
Hyndburn 2,580 2,100 4,700 9.5
Lancaster 2,870 1,500 4,400 4.7
Pendle 2,690 1,800 4,500 8.1
Preston 3,920 2,500 6,400 6.9
Ribble Valley 620 0 600 1.7
Rossendale 1,810 1,000 2,800 6.4
South Ribble 1,450 1,100 2,600 3.8
West Lancashire 2,150 1,400 3,500 5.1
Wyre 1,990 1,900 3,900 6.2
Merseyside
Knowsley 4,830 6,400 11,200 11.8
Liverpool 19,130 17,800 36,800 10.9
Sef ton 6,820 8,300 15,100 9.3
St. Helens 4,500 5,300 9,800 8.9
Wirral 7,240 10,200 17,500 9.1
YORKSHIRE AND THE
HUMBER 141,400 78,000 219,000 6.4
East Riding of Yorkshire 4,980 2,500 7,500 3.8
Kingston upon Hull 10,900 6,000 16,900 10,1
North East Lincolnshire 4,010 3,700 7,700 8.1
North Lincolnshire 3,600 2,100 5,700 5.5
York 2,440 0 2,400 1.7
North Yorkshire
Craven 550 200 800 2.4
Hambleton 960 300 1,300 2.4
Harrogate 1,800 400 2,200 2.3
Richmondshire 510 0 500 1.5
Ryedale 600 300 900 2.9
Scarborough 1,960 2,900 4,900 8.0
Selby 1,300 100 1,400 2.4
25Real unemployment
% of
Unemployment Hidden on
working
benefit incapacity Number
age
claimants benefits
population
South Yorkshire
Barnsley 5,910 6,800 12,700 8.3
Doncaster 8,980 6,100 15,100 7.8
Rotherham 7,610 5,900 13,500 8.4
Shef field 15,880 7,900 23,800 6.1
West Yorkshire
Bradf ord 22,120 8,200 30,400 9.1
Calderdale 5,300 4,200 9,500 7.3
Kirklees 11,570 6,300 17,800 6.5
Leeds 22,490 6,700 29,200 5.6
Wakef ield 7,960 7,400 15,400 7.1
EAST MIDLANDS 97,300 49,000 146,000 4.9
Derby 7,380 4,400 11,800 7.3
Leicester 11,270 4,900 16,200 6.9
Nottingham 12,000 6,000 18,000 7.6
Rutland 390 0 400 1.7
Derbyshire
Amber Valley 1,800 1,800 3,600 4.6
Bolsover 1,370 1,800 3,200 6.3
Chesterf ield 2,090 2,800 4,900 7.5
Derbyshire Dales 650 200 900 2.1
Erewash 2,120 1,600 3,700 5.3
High Peak 1,330 800 2,100 3.7
North East Derbyshire 1,460 1,500 2,900 4.9
South Derbyshire 1,430 200 1,600 2.4
Leicestershire
Blaby 1,290 100 1,400 2.3
Charnwood 2,600 300 2,900 2,4
Harborough 960 0 1,000 1.7
Hinckley & Bosworth 1,720 200 1,900 2.8
Melton 690 0 700 2.3
N W Leicestershire 1,380 400 1,800 2.8
Oadby & Wigston 870 200 1,100 3.2
Lincolnshire
Boston 1,820 700 2,500 5.9
East Lindsey 3,000 3,800 6,800 8.9
Lincoln 2,780 1,300 4,100 6.0
North Kesteven 1,400 300 1,700 2.4
South Holland 1,680 600 2,300 4.2
South Kesteven 2,420 700 3,200 3.8
West Lindsey 1,670 1,400 3,100 5.5
26Real unemployment
% of
Unemployment Hidden on
working
benefit incapacity Number
age
claimants benefits
population
Northamptonshire
North Northamptonshire 6,560 1,900 8,400 4.0
West Northamptonshire 8,220 600 8,800 3.5
Nottinghamshire
Ashf ield 3,010 2,400 5,400 6.8
Bassetlaw 2,150 1,900 4,000 5.7
Broxtowe 1,730 700 2,500 3.5
Gedling 2,100 1,100 3,200 4.4
Mansf ield 2,560 2,900 5,500 8.2
Newark & Sherwood 2,120 1,500 3,600 4.9
Rushcliffe 1,290 0 1,300 1.8
WEST MIDLANDS 174,600 61,000 235,000 6.4
Heref ordshire 2,550 1,300 3,900 3.4
Shropshire 4,860 1,600 6,400 3.4
Stoke-on-Trent 8,550 5,700 14,200 8.9
Telf ord & Wrekin 4,110 3,000 7,100 6.3
Staffordshire
Cannock Chase 1,960 1,200 3,200 5.0
East Staffordshire 2,140 700 2,900 3.9
Lichf ield 1,530 100 1,700 2.7
Newcastle-under-Lyme 2,180 1,300 3,500 4.2
South Staffordshire 1,890 100 2,000 3.0
Staf ford 2,000 800 2,800 3.3
Staf fordshire Moorlands 1,150 700 1,800 3.1
Tamworth 1,680 500 2,200 4.6
Warwickshire
North Warwickshire 1,050 200 1,200 3.1
Nuneaton & Bedworth 3,160 1,300 4,500 5.6
Rugby 1,830 0 1,800 2.7
Stratf ord-on-Avon 1,760 0 1,800 2.3
Warwick 2,130 200 2,300 2.5
West Midlands County
Birmingham 60,110 17,500 77,600 10.6
Coventry 10,970 2,100 13,100 5.1
Dudley 9,340 3,300 12,700 6.5
Sandwell 13,060 5,200 18,200 8.9
Solihull 4,390 1,600 6,000 4.6
Walsall 9,810 5,000 14,800 8.5
Wolverhampton 11,510 4,200 15,700 9.6
27Real unemployment
% of
Unemployment Hidden on
working
benefit incapacity Number
age
claimants benefits
population
Worcestershire
Bromsgrove 1,620 0 1,600 2.7
Malvern Hills 1,670 300 1,500 3.3
Redditch 1,950 500 2,500 4.7
Worcester 2,260 500 2,800 4.3
Wychavon 2,010 600 2,600 3.5
Wyre Forest 1,980 1,300 3,300 5.6
EAST 119,500 38,000 157,000 4.1
Bedf ord 4,470 1,100 5,600 5.3
Central Bedfordshire 4,260 0 4,300 2.3
Luton 8,240 2,000 10,300 7.7
Peterborough 6,170 2,700 8,800 7.1
Southend-on-Sea 5,260 2,600 7,800 7.0
Thurrock 4,230 0 4,200 3.8
Cambridgeshire
Cambridge 1,980 500 2,400 2.8
East Cambridgeshire 1,050 100 1,100 2.1
Fenland 2,260 1,300 3,500 5.9
Huntingdonshire 2,330 200 2,500 2.3
South Cambridgeshire 1,670 0 1,700 1.7
Essex
Basildon 4,260 1,900 6,100 5.3
Braintree 2,500 200 2,700 2.9
Brentwood 1,280 0 1,300 2.7
Castle Point 1,380 300 1,700 3.2
Chelmsf ord 2,880 0 2,900 2.6
Colchester 3,530 500 4,100 3.2
Epping Forest 2,590 0 2,600 3.2
Harlow 2,720 800 3,500 6.5
Maldon 1,030 100 1,100 2.9
Rochf ord 1,200 0 1,200 2.3
Tendring 3,840 3,400 7,300 9.2
Uttlesford 1,050 0 1,100 1.9
28Real unemployment
% of
Unemployment Hidden on
working
benefit incapacity Number
age
claimants benefits
population
Hertfordshire
Broxbourne 2,160 600 2,800 4.6
Dacorum 2,750 300 3,100 3.2
East Hertf ordshire 1,880 0 1,900 2.0
Hertsmere 2,030 400 2,500 3.9
North Hertf ordshire 1,990 0 2,000 2,4
St Albans 1,980 0 2,000 2.2
Stevenage 1,990 800 2,800 5.0
Three Rivers 1,300 0 1,300 2.3
Watf ord 2,210 0 2,200 3.6
Welwyn Hatf ield 2,200 100 2,300 2.8
Norfolk
Breckland 1,950 1,100 3,100 3.8
Broadland 1,500 700 2,200 2,9
Great Yarmouth 3,060 2,800 5,800 10.2
King’s Lynn & W Norfolk 2,250 2,100 4,400 5.1
North Norf olk 1,490 1,600 3,100 5.5
Norwich 3,870 3,200 7,000 7.2
South Norfolk 1,770 500 2,300 2.7
Suffolk
Babergh 1,290 200 1,500 2.8
Ipswich 4,000 1,800 5,800 6.8
Mid Suffolk 1,200 100 1,300 2.1
East Suffolk 4,140 3,200 7,300 5.3
West Suffolk 2,340 800 3,100 3.0
LONDON 299,200 72,000 371,000 6.1
Camden 7,430 4,600 12,000 6.1
Hackney 11,500 5,000 16,500 8.2
Hammersmith & Fulham 6,670 2,100 8,700 6.8
Haringey 13,020 4,300 17,300 9.4
Islington 8,360 4,100 12,400 6.6
Kensington & Chelsea 4,000 2,900 6,900 6.5
Lambeth 13,110 2,800 15,900 6.7
Lewisham 12,500 3,300 15,800 7.4
Newham 17,200 1,700 18,900 7.6
Southwark 12,030 3,400 15,400 6.6
Tower Hamlets 13,020 2,800 15,800 6.5
Wandsworth 8,190 0 8,200 3.4
Westminster 6,870 4,600 11,500 6.0
Barking & Dagenham 8,810 900 9,800 7.2
Barnet 11,530 2,900 14,400 5.7
Bexley 4,680 700 5,300 3.4
Brent 14,710 4,500 19,200 8.9
Bromley 6,320 900 7,200 3,5
29Real unemployment
% of
Unemployment Hidden on
working
benefit incapacity Number
age
claimants benefits
population
Croydon 14,390 3,600 17,700 7.1
Ealing 13,970 3,200 17,200 7.8
Enf ield 12,620 4,700 17,300 8.2
Greenwich 9,890 2,700 12,600 6.5
Harrow 6,840 1,400 8,300 5.2
Havering 6,010 100 6,200 3.8
Hillingdon 8,070 300 8,300 4.2
Hounslow 10,050 1,130 11,200 6.3
Kingston upon Thames 3,280 0 3,300 2.8
Merton 5,710 0 5,700 4.2
Redbridge 10,030 700 10,700 5.4
Richmond upon Thames 3,200 0 3,200 2,6
Sutton 3,840 700 4,600 3.5
Waltham Forest 10,990 2,200 13,200 7.1
SOUTH EAST 170,000 41,000 211,000 3.8
Bracknell Forest 1,720 0 1,700 2.2
Brighton & Hove 8,220 3,100 11,400 5.5
Isle of Wight 3,020 2,900 5,900 7.4
Medway 7,450 2,100 9,600 5.5
Milton Keynes 6,440 1,200 7,600 4.5
Portsmouth 6,360 700 7,000 4.8
Reading 4,240 0 4,200 4.0
Slough 4,980 0 5,000 5.3
Southampton 7,070 2,100 9,200 5.3
West Berkshire 2,160 0 2,200 2.2
Windsor & Maidenhead 2,250 0 2,200 2.4
Wokingham 1,780 0 1,800 1.7
Buckinghamshire 8,980 0 9,000 2.7
East Sussex
Eastbourne 2,930 2,400 5,400 9.0
Hastings 3,380 3,000 6,400 11.4
Lewes 1,950 1,200 3,100 5.3
Rother 1,770 1,400 3,200 6.3
Wealden 2,130 300 2,400 2.6
30Real unemployment
% of
Unemployment Hidden on working
benefit incapacity Number age
claimants benefits populatio
n
Hampshire
Basingstoke & Deane 2,770 0 2,800 2.5
East Hampshire 1,480 0 1,500 2.0
Eastleigh 1,640 0 1,600 2.0
Fareham 1,250 0 1,200 1.8
Gosport 1,730 800 2,500 4.8
Hart 950 0 1,000 1.6
Havant 2,660 1,700 4,400 5.9
New Forest 2,030 1,300 3,300 3.4
Rushmoor 1,850 400 2,300 3.7
Test Valley 1,420 200 1,600 2.1
Winchester 1,520 0 1,500 2.0
Kent
Ashf ord 2,700 600 3,400 4.3
Canterbury 3,090 800 3,900 3.7
Dartf ord 2,120 0 2,100 2.9
Dover 2,760 1,800 4,600 6.6
Gravesham 2,790 800 3,600 5.5
Maidstone 3,390 600 4,000 3.8
Sevenoaks 1,530 0 1,500 2.2
Folkestone & Hythe 2,980 1,800 4,800 7.2
Swale 3,680 1,700 5,400 6.0
Thanet 5,190 3,300 8,400 10.5
Tonbridge & Malling 1,780 0 1,800 2.3
Tunbridge Wells 1,980 200 2,100 2.7
Oxfordshire
Cherwell 1,980 200 2,100 2.3
Oxf ord 2,860 0 2,900 2,7
South Oxfordshire 1,630 0 1,600 1.9
Vale of White Horse 1,620 0 1,600 1.9
West Oxfordshire 1,320 0 1,300 2.0
Surrey
Elmbridge 1,700 0 1,700 2.1
Epsom & Ewell 930 0 1,000 2.0
Guildf ord 1,720 0 1,700 1.7
Mole Valley 1,030 200 1,200 2.4
Reigate & Banstead 2,090 0 2,100 2.3
Runnymede 1,350 0 1,400 2.3
Spelthorne 1,970 0 2,000 3.2
Surrey Heath 1,080 0 1,100 2.0
Tandridge 1,190 0 1,200 2.2
Waverley 1,250 0 1,300 1.7
Woking 1,440 0 1,400 2.4
31You can also read