Sustainability and finance: a sustainable company has better financial performance than a non-sustainable one?
←
→
Page content transcription
If your browser does not render page correctly, please read the page content below
Research, Society and Development, v. 10, n. 10, e516101019251, 2021
 (CC BY 4.0) | ISSN 2525-3409 | DOI: http://dx.doi.org/10.33448/rsd-v10i10.19251

Sustainability and finance: a sustainable company has better financial performance
than a non-sustainable one?
Sustentabilidade e finanças: uma empresa sustentável apresenta melhor desempenho financeiro do
que uma empresa não sustentável?
Sustentabilidad y finanzas: una empresa sustentable tiene mejor desempeño financiero que una no
sustentable?

 Received: 08/09/2021 | Reviewed: 08/14/2021 | Accept: 08/15/2021 | Published: 08/17/2021

 Caroline de Santana Harfuch
 ORCID: https://orcid.org/0000-0002-7942-1013
 Olam Risk Management Services, Brazil
 E-mail: carolineharfuch@gmail.com
 Paulo Frederico Paganini Oliveira Junior
 ORCID: https://orcid.org/0000-0003-2276-1612
 Saint Paul Escola de Negócios, Brazil
 E-mail: paulo.paganini@saintpaul.com.br
 Marcelo Bernardino Araújo
 ORCID: https://orcid.org/0000-0003-3211-6510
 Instituto Federal de Educação, Ciências e Tecnologia de São Paulo, Brazil
 E-mail: mbaraujo@ifsp.edu.br
 Marcos de Oliveira Morais
 ORCID: https://orcid.org/0000-0002-5981-4725
 Universidade Estácio de Sá, Brazil
 Universidade Santo Amaro, Brazil
 E-mail: marcostecnologia2001@gmail.com

 Abstract
 This article aims to analyze the profitability of sustainable and unsustainable companies by comparing the performance
 of ISE and Ibovespa, which respectively, will serve as indicators of the average performance of the mentioned segments,
 between 2009 and 2018. The methodological design is based on a descriptive study of the average return of the stock
 portfolios of the ISE and Ibovespa, from 2009 to 2018. Analysis procedures considered measures of mean return,
 standard deviation, and Sharpe Ratio. Based on the results of the sample, the main finding is that investing in companies
 based on the TBL assumptions is slightly more advantageous than investing in neoclassical companies, as they return
 the investor higher returns for the same amount of risk. In addition, we concluded that from the beginning of 2011 the
 performance of ISE surpassed that of Ibovespa, and in the following years, its performance was considerably higher
 than the last one. The first implication or limitation is related to the possibility to isolate and analyze companies that
 participate in both indexes, to better evaluate the performance of each follow-up. Another implication is that no scientific
 reasons were found to explain why ISE performance was found as considerably higher than Ibovespa, which can open
 another path in order to analyze this phenomenon according to risk perception of non-sustainable companies. This paper
 offers specific contributions in terms of performance when comparing ISE and Ibovespa. Furthermore, our findings
 open the discussion of firm performance when sustainable or non-sustainable, which allows bringing theoretical aspects
 related to risk acceptance.
 Keywords: Sustainable development; Sustainability; Finance.

 Resumo
 Este artigo tem como objetivo analisar a rentabilidade de empresas sustentáveis e insustentáveis por meio da
 comparação do desempenho do ISE e do Ibovespa, que respectivamente, servirão como indicadores do desempenho
 médio dos segmentos citados, entre 2009 e 2018. O desenho metodológico é baseado em um modelo descritivo estudo
 do retorno médio das carteiras de ações do ISE e Ibovespa, no período de 2009 a 2018. Os procedimentos de análise
 consideraram medidas de retorno médio, desvio padrão e Índice de Sharpe. Com base nos resultados da amostra, o
 principal achado é que investir em empresas com base nas premissas do TBL é um pouco mais vantajoso do que investir
 em empresas neoclássicas, pois elas retornam ao investidor maiores retornos pelo mesmo montante de risco. Além disso,
 concluímos que desde o início de 2011 o desempenho do ISE superou o do Ibovespa, e nos anos seguintes seu
 desempenho foi consideravelmente superior ao anterior. A primeira implicação ou limitação está relacionada à
 possibilidade de isolar e analisar empresas que participam de ambos os índices, para melhor avaliar o desempenho de

 1
Research, Society and Development, v. 10, n. 10, e516101019251, 2021
 (CC BY 4.0) | ISSN 2525-3409 | DOI: http://dx.doi.org/10.33448/rsd-v10i10.19251

 cada acompanhamento. Outra implicação é que não foram encontradas razões científicas para explicar porque o
 desempenho do ISE foi considerado consideravelmente superior ao do Ibovespa, o que pode abrir outro caminho para
 analisar esse fenômeno de acordo com a percepção de risco de empresas não sustentáveis. Este artigo oferece
 contribuições específicas em termos de desempenho na comparação do ISE e do Ibovespa. Além disso, nossos achados
 abrem a discussão sobre o desempenho da firma quando sustentável ou não sustentável, o que permite trazer aspectos
 teóricos relacionados à aceitação do risco.
 Palavras-chave: Desenvolvimento sustentável; Sustentabilidade; Finanças.

 Resumen
 Este artículo tiene como objetivo analizar la rentabilidad de empresas sostenibles e insostenibles comparando el
 desempeño de ISE e Ibovespa, que respectivamente, servirán como indicadores del desempeño promedio de los
 segmentos mencionados, entre 2009 y 2018. El diseño metodológico se basa en una descripción descriptiva estudio de
 la rentabilidad media de las carteras de valores del ISE e Ibovespa, de 2009 a 2018. Los procedimientos de análisis
 consideraron medidas de rentabilidad media, desviación estándar y Ratio de Sharpe. Con base en los resultados de la
 muestra, el hallazgo principal es que invertir en empresas basadas en los supuestos de TBL es ligeramente más ventajoso
 que invertir en empresas neoclásicas, ya que le devuelven al inversor rendimientos más altos por la misma cantidad de
 riesgo. Además, concluimos que desde principios de 2011 el desempeño de ISE superó al de Ibovespa, y en los años
 siguientes, su desempeño fue considerablemente superior al anterior. La primera implicación o limitación está
 relacionada con la posibilidad de aislar y analizar empresas que participan en ambos índices, para evaluar mejor el
 desempeño de cada seguimiento. Otra implicación es que no se encontraron razones científicas que expliquen por qué
 el desempeño de ISE fue considerablemente superior al de Ibovespa, lo que puede abrir otro camino para analizar este
 fenómeno de acuerdo con la percepción de riesgo de las empresas no sostenibles. Este trabajo ofrece contribuciones
 específicas en términos de desempeño al comparar ISE e Ibovespa. Además, nuestros hallazgos abren la discusión sobre
 el desempeño de la empresa cuando es sustentable o no sustentable, lo que permite traer aspectos teóricos relacionados
 con la aceptación del riesgo.
 Palabras clave: Desenvolvimiento sustentable; Sustentabilidad; Finanzas.

1. Introduction
 Until the mid-twentieth century, societies had as their main driver the accumulation of capital from the profit of
industrialized production (Dias and Cario, 2014). The ultimate goal of development policies at this time was, therefore, to
improve people's living standards so that they could have increased access to consumer goods (Nordhaus & Samuelson, 1993).
 However, from the 1980s onwards, the old model of financial capitalism began to be sharply questioned (Dias & Cario,
2014). Society has organized itself to demand that development policies cease to be purely materialistic and focus on meeting
the “basic needs such as education, nutrition, health, hygiene and employment for the poor, on the grounds that the benefits of
development - as thought so far - did not necessarily reach the neediest” (Charidade, 2011). This new development paradigm
had the name “Development Sustainable” first coined in the Commission report Brundtland.
 This report has highlighted the concern of meeting current needs without compromising the productive and survival
capacity of future generations (1987 cited Brüseke, 1995). The critical components of so-called sustainable development are
economic growth, environmental protection, and social equality.
 These fundamentals eventually reached the private sphere and changed the paradigm by which people value a company.
If once a successful company was the one that made the most profit, now it is the question of sustainability.
 Currently, the issue is seen under three different approaches, social, economic, and environmental is called the Triple
Bottom Line (Machado & Corrar cited Barbosa, 2007). According to exposed Machado and Corrar, the idea central to TBL is
that the success and health of a company should not be evaluated only by traditional financial measures but also for its ethics,
social responsibility, and environmental performance (MacDonald, 2003).
 The first corporate performance measurement measure for sustainability practices came in 1999 in the United States
with the publication of the Dow Jones Sustainability Index (DJSI). Following the same rationale, the Brazilian stock exchange,
in 2005, the Corporate Sustainability Index (ISE). Regarding this index, the present article examines, through a comparative
analysis with the Bovespa Index (Ibovespa), how the performance of sustainable companies is compared to that of companies

 2
Research, Society and Development, v. 10, n. 10, e516101019251, 2021
 (CC BY 4.0) | ISSN 2525-3409 | DOI: http://dx.doi.org/10.33448/rsd-v10i10.19251

not guided by these principles.
 This article aims to analyze the profitability of sustainable and unsustainable companies by comparing the performance
of ISE and Ibovespa, which respectively, will serve as indicators of the average performance of the mentioned segments, between
2009 and 2018.
 You can find ample literature relating to socially responsible investments and financial performance. Several authors
have sought to compare the performance of this type of investment with other investments considered conventional, i.e., those
that do not use social, environmental, and corporate governance indicators (Rezende, 2007).
 Their research, however, has shown conflicting results, as the authors argue that these conflicts can be attributed to
theoretical and methodological reasons such as lack of theoretical foundation, a systematic and adequate measure for corporate
social performance; methodological rigor, small size and limitations of sample composition and incompatibility between social
and financial variables (Barbosa, 2007). In 2007, Rezende et al. sought to ascertain whether ISE's return was similar to that of
the other Bovespa stock indices. However, the study conducted presented questionable results, since the sample used was too
small for the chosen statistical technique, i.e., Student's t-test. The unreliability of the conclusions of Rezende et al. motivated
this study, which has a similar objective; However, based on daily turnover indices for a more extended period, namely between
2009, 2018, and is used Sharp Ratio based on the assumption of statistical tests.

2. Bovespa Index
 The Bovespa index (Ibovespa) is the most critical indicator of the average performance of the Brazilian stock market
quotations. With a composition that seeks to approximate the original configuration of spot trading on the Bovespa, the index
aims to portray the behavior of the primary securities traded at BM&F.
 Launched by the BM&F in 1968, the Ibovespa can, for its purpose, be compared to the Dow Jones Industrial Average
(DJIA) created by Charles H. Dow in 1896. The DJIA is the first average of the behavior of the reported stock market. Initially
with 12 stocks, and now 30 shares, it seeks to provide a clear and direct view of the stock market, and by extension of the US
economy (Dow Jones, 2013).
 In terms of liquidity, the shares that make up Ibovespa's hypothetical portfolio account for about 80% of BM&F's
number of trades and spot market financial volume. As for capitalization, companies whose shares are listed on the index account
for approximately 70% of the stock market capitalization.
 The Ibovespa is calculated in real-time, considering the latest trades in the spot market with the stocks that are part of
its portfolio. Participation of each share in the portfolio is directly related to its representativeness in the spot market - in terms
of many trades and financial volume - adjusted to the sample size (BM&F BOVESPA, 2019 a). The representativeness of each
share is called the “Negotiability Index”, and is calculated by the following formula:

 = √

 Where:
 • IN = negotiability index
 • ni = number of trades with stock “i” in the spot market (standard lot)
 • N = total number of trades on the BOVESPA spot market (standard lot)
 • vi = financial value generated by business with the action “i” in the cash market (around lot - default)
 • V = total financial volume of BOVESPA spot market (standard lot)

 3
Research, Society and Development, v. 10, n. 10, e516101019251, 2021
 (CC BY 4.0) | ISSN 2525-3409 | DOI: http://dx.doi.org/10.33448/rsd-v10i10.19251

 The sum of the shares, weighted by their trade index, results in the Bovespa Index:

 Where:
 • Ibovespa t = Bovespa Index at time t
 • N = total number of shares of the theoretical portfolio
 • P = last price of share “i” at time t
 • Q = theoretical amount of the share “i” in the portfolio at time t

 For the Index to better mirror the Brazilian stock market, its portfolio is reevaluated at the end of each quarter. In
evaluations, we identify changes in the relative share of each share in the index, as well as its permanence or exclusion, and the
inclusion of new securities (BM&F BOVESPA, 2019 a).
 Besides, the Ibovespa is adjusted whenever the issuing companies in its portfolio distribute dividends. The adjustment
is made considering that the investor sold the shares at the last closing price before the commencement of ex-dividend trading
and used the proceeds to purchase the same shares without the distributed dividend (BM&F BOVESPA, 2019 a). The below,
formula used for this purpose:

 Where:
 • Qn = new quantity
 • Q0 = old quantity
 • Pc = last previous trading price at the start of trading “ex-earning”
 • Pex = ex-theoretical price, calculated based on Pc

 4
Research, Society and Development, v. 10, n. 10, e516101019251, 2021
 (CC BY 4.0) | ISSN 2525-3409 | DOI: http://dx.doi.org/10.33448/rsd-v10i10.19251

 Table 1: ISE 2018 Wallet.
 Companies
 AES Tiete CCR CPFL Engie Klabin Natura
 B2W Celesc Duratex Fibria Light Santander
 Banco do Lojas
 Cemig Ecorodovias Fleury Telefônica
 Brasil Americanas
 Itaú Lojas
 Bradesco Cielo EDP Tim
 Unibanco Renner
 Braskem Copel Eletropaulo Itaúsa MRV Weg
 Source: B3.

3. Corporate Sustainability Index
 During Financial Capitalism, investors based their investments on the financial performance of the companies in which
they proposed to invest. According to Savitz (2006), the market view that is directed only to the shareholder and to action led
the corporate environment to disregard crucial political, environmental, and cultural trends, which impacted on the organizational
performance itself.
 However, from the 1980s onwards, the realization of the real environmental impacts of productivity has increased,
driving business, shareholders, and investors to turn to a new business model. Companies had to recreate their production
strategies by focusing on both the economy and society and the environment.
 The financial market, of course, has absorbed this trend, and stock markets around the world have begun to organize to
create indices that capture more information than purely economic ones. In 1999, the United States created the first index to
measure the financial performance of leading sustainability companies, the Dow Jones Sustainability Index (DJSI). The index
takes into account the economic, social, and environmental performance of its member companies (Dow Jones, 2019).
 In Brazil, ABN AMRO created in 2001 the Ethos Fund, the first investment fund composed only of companies
recognized for developing good social, environmental, and corporate responsibility practices. Also seeking to cater to socially
responsible investors, in 2005, Brazilian Stock Exchange launched the Corporate Sustainability Index (ISE) - the fourth of its
kind in the world.
 ISE can be understood as a benchmarking tool for B3 listed companies in terms of corporate sustainability, economic
efficiency, environmental balance, social justice, and corporate governance, with the ultimate goal of identifying companies that
stand out for their performance. Commitment to social development and strategic alignment with sustainability, differentiating
companies for investors with other concerns (other than short-term financial returns), creating an investment environment
compatible with society's demands, encouraging the creation of investment funds responsible, and becoming a standard for
comparing their performances.
 The purpose of the Brazilian Stock Exchange's Corporate Sustainability Index (ISE) is to provide an adequate means of
investment compatible with economic, social, and environmental demands, and to encourage corporate ethical responsibility.
Teixeira, Nossa, and Funchal (2011) affirm that the Index has the goal of being a benchmark of firms that stands out in the
promotion of sustainable attitudes, committing Corporate Social Responsibility (CSR) and Corporate Sustainability.
 To be part of the ISE portfolio, companies must cumulatively be among B3's 200 most traded shares, have their shares
traded in at least 50% of trading sessions in the 12 months prior to the start of the revaluation process, and meet the sustainability
criteria endorsed by the ISE Council (ISE BMFV, 2019 a).
 The companies are evaluated by the Getulio Vargas Foundation's Center for Sustainability Studies (Gvces). Companies
are evaluated using a questionnaire developed by Gvces itself, based on the Triple Bottom Line (TBL) concept. Completion of
the survey is voluntary, and responses are analyzed using “cluster analysis”. Indicators of company commitment, program

 5
Research, Society and Development, v. 10, n. 10, e516101019251, 2021
 (CC BY 4.0) | ISSN 2525-3409 | DOI: http://dx.doi.org/10.33448/rsd-v10i10.19251

indicators, management targets and monitoring, the legal performance of the organization, and finally, the economic performance
of companies are evaluated (ISE BMFV, 2019 a).
 The 40 best-performing companies in the questionnaire are now part of ISE's hypothetical portfolio for one year. The
shares of these companies are weighted according to the formula below:

 Where:
 • ISE (t) = index value on day t
 • ISE (t-1): Index value on day t-1
 • n = number of shares in the theoretical index portfolio
 • Qi_(t-1): the theoretical amount of stock i available for trading on day t-1
 • Pi_t: share price i at the close of day t
 • Pi_(t-1): i share price at the close of day t-1

 Table 2 shows the evolution of the theoretical portfolio of the index:

 Table 2: ISE companies and shares.
 Number of Companies and Shares in ISE

 Ticket 2009 2010 2011 2012 2019 2014 2015 2016 2017 2018

 Companies 30 34 38 38 37 40 40 35 34 30
 Shares 38 43 47 51 51 51 51 40 38 33

 Source: B3.

4. Corporate Management Model
 The shareholder is the physical or legal individual who shares or holds corporate shares or shares. Thus, the theory of
shareholders seeks to understand the organizational and inter-organizational movement from the maximization of shareholder
wealth, where the financial manager is compelled to act in pursuit of the owners' strict interest (Brealey & Myers, 2000). In
another way, stakeholder theory seeks to analyze organizations in the light of everyone involved with it.
 The term stakeholder was first used in the field of business administration in 1963 in an internal memo from the Stanford
Research Institute (SRI). This term originally referred to as all groups without which the company would cease to exist (Freeman
& McVea, 2000, quoted by Borba, Silveira, & Yoshinaga, 2005). The groups would consist of employees, customers, suppliers,
shareholders, creditors, and society. In 1984, Freeman refined this concept and defined the term as any group or individual that
affects or is affected by the achievement of company goals (Borba, et al., 2005).
 Management based on stakeholder theory encompasses the allocation of organizational resources as well as the impacts
of such assignment on the various groups linked to an organization. These groups may be from primary stakeholders, such as
shareholders and creditors with defined rights within the organization or from secondary stakeholders such as suppliers,
 6
Research, Society and Development, v. 10, n. 10, e516101019251, 2021
 (CC BY 4.0) | ISSN 2525-3409 | DOI: http://dx.doi.org/10.33448/rsd-v10i10.19251

consumers, the local community, and other entities with formally not established rights (Wright et al., 2000).
 For Donaldson and Preston (1995), all persons or groups with legitimate interests in a given organization receive and
offer their benefits through interrelationship; in the first instance, there is no overlap of interests between groups. This interaction
set can be identified from Figure 1, which shows the interdependence between the actors:

 Figure 1: Stakeholder Model.

 Governments

 Suppliers Investors

 Trade Politicas
 FIRM
 associations groups

 Employees Customers

 Communities

 Source: Donaldson and Preston (1995).

 The stakeholder theory has a managerial character because it builds its analytical apparatus by observing the firm's
relations with the parties involved, without broadening its analysis to the institutional and political field. From this character, the
descriptive, instrumental and normative aspects emerge, as subsequent development.
 The descriptive precision of this theory lies in its ability to tangent and deepen organizational characteristics related to
the cooperation and competing interests of the parties involved. This aspect makes it possible to describe the nature of the firm,
managerial thinking of managers, and the overall interest of the corporation (Donaldson & Preston, 1995).
 Complementarily, the instrumental aspect of this theory allows the evaluation of the connection between stakeholders,
the managerial action, and the overall goals of the organization, relying on statistical methodologies. The instrumental power of
stakeholder theory stems from its ability to identify the connections, or lack thereof, between stakeholder management and the
achievement of traditional company objectives such as profit and growth (Rodrigues, 2005).
 Finally, the normative aspect makes mention of the fact that the real and legitimate interests of stakeholders in the value-
generating business for her.
 These three aspects are interconnected and interdependent, and allow further analysis of the interaction between the
firm and its stakeholders. The following discusses how these two currents are reflected in the management and performance of
an organization.

 7
Research, Society and Development, v. 10, n. 10, e516101019251, 2021
 (CC BY 4.0) | ISSN 2525-3409 | DOI: http://dx.doi.org/10.33448/rsd-v10i10.19251

5. Methodology
 This article presents a descriptive study of the average return of the stock portfolios of the ISE and Ibovespa, within the
range of 2009 to 2018. As an analysis procedure, the measures of mean return, standard deviation, and Sharpe Ratio were raised.
 One of the most critical performance indicators for most investors is the expected return on their investment over a
specific period. However, there is enormous difficulty in obtaining these expected values. Thus, an average estimate for this
return v in the evaluation of your average historical return, so that implicitly is assumed that the past will be repeated in some
way (Varga, 2011).
 In this article, we chose to use the logarithmic expression to calculate the average return of ISE and Ibovespa, according
to the formula below:

 Where:
 • r: return
 • Pt: Portfolio quote at date t
 • Pt-1: Portfolio quote at date t-1

 According to Hull (1996), share prices follow a random movement; This means that proportional changes in the share
price over a short period are usually distributed. However, so that the share price at any time in the future, has a distribution log
standard.
 Another significant investment driver is the risk that a particular asset represents to the investor. This risk can be
understood as the probability of the asset generating a lower than expected return, or as the deviation from the expected value in
the future. The following expression can calculate the standard deviation of the historical performance of an asset:

 Where:
 • Kj is the return of the asset on observation j
 • Average K is the average return on the asset
 • N is the number of observations

 The Sharpe Ratio is an indicator that allows you to assess the relationship between the return and risk of an asset. Also
known as the variability premium, the Sharpe Ratio measures the additional performance that each risk unit brings to an
investment (Nogueira & Gomes, 2012), providing an opportunity for the investor to choose the highest return asset at the same
level of risk. The risk or even the lowest risk asset is given the same return level.

 8
Research, Society and Development, v. 10, n. 10, e516101019251, 2021
 (CC BY 4.0) | ISSN 2525-3409 | DOI: http://dx.doi.org/10.33448/rsd-v10i10.19251

 In this article, the Sharp Ratio and was used as a comparison tool between ISE and Ibovespa performance. Below is the
formula used:

 Where:
 • Rp is the expected return on an investment
 • Rf is the interest rate of a risk-free asset
 • σp is the standard deviation (risk) of a portfolio
 • Rp - Rf represents the investment risk premium
 For the calculation of the Sharpe Ratio, the Selic rate was used as a risk-free asset.

6. Sustainability and Finance
 Discussions about economics and collective welfare have been present in various fields of society since ancient Greece.
However, in the last century, this debate has sharpened considerably due to what Egri and Pinfield (2012) have called concern
for the quality of the natural environment. Today, the topic is in many forms and has ranged from the establishment of global
environmental forums to formal assessments of large-scale ecological archives (Rice, 1993 cited Egri & Pinfield, 2012).
 If, until organizations saw the 1970s environmental considerations as detrimental to their performance, today, they are
part of the decision-making process, giving rise to the so-called “Corporate Environmentalism”. This phenomenon emerged as
the concepts of “Environmental Restoration” and “Sustainable Development”, which mark the process of institutionalization of
environmental causes.
 Sustainable Development can be understood as a concern to meet the needs of the present without compromising the
ability of future generations to meet their own needs (WCED, 1987).
 The Environmental Restoration, in turn, is the result of the attempt d in industrialized society to incorporate environment
to organizational processes, and combine different approaches for sustainable development. This current encompasses social,
health, and economic issues, as well as the traditional approach to the environment (Sitarz, 1993).
 Among the existing constructs in the renewed environmentalism, stand out the green economy, green industrialism, and
the regulation of environmental risks by the market and government agencies. As for the first, it can be said that it is an attempt
to relate the economic process with the physical conditions of the environment. Industrialism, on the other hand, seeks to make
companies incorporate sustainable practices to minimize the impacts of large-scale production, giving greater importance to
ecotechnologies. Finally, regulation maintains the neoclassical view that the market itself regulates environmental risks but adds
to it natural capital as a factor for decision making (Egri & Pinfield, 2012).

 9
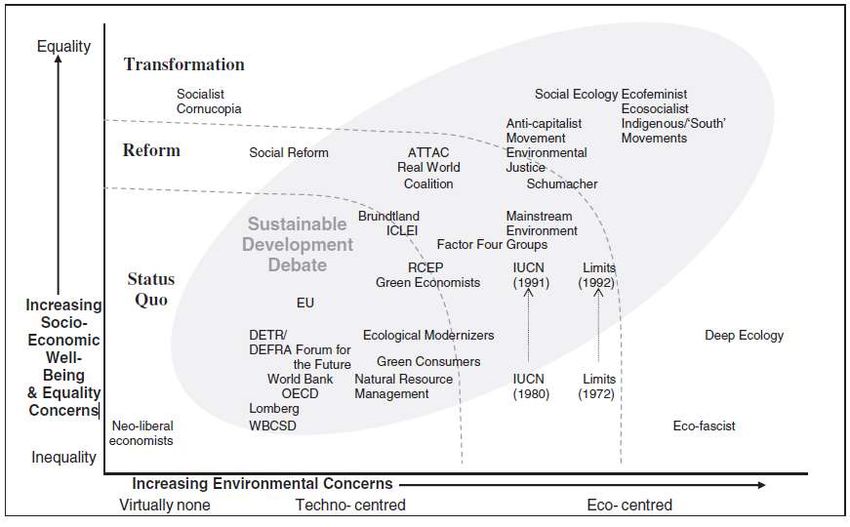
Research, Society and Development, v. 10, n. 10, e516101019251, 2021
 (CC BY 4.0) | ISSN 2525-3409 | DOI: http://dx.doi.org/10.33448/rsd-v10i10.19251

 Figure 2: Mapping visions of sustainable development.

 Source: Hopwood et al (2005).

 According to renewed environmentalism, the neoclassical economic perspective, associated with natural capital used
for decision making, enables the achievement of an efficient economy. From this logic comes what has been termed “sustainable
finance” (Borba, 2005). How climate change and scarcity of natural resources impact public policies of governments, such as
economic relations between countries and the global corporate system, thus changing as industrial relations in the private area.
Using this knowledge, companies have sought competitive advantages through natural resource economics and environmental
maintenance (Demajorovic, 2003). In a complementary manner, society also aims to allocate its resources to companies that
balance socio-environmental responsibility and financial performance.
 To capture the investments of this portion of society, some organizations adopted the corporate management model of
their finances, through which they measured stakeholder interest by weighing profitability and liquidity to maximize the market
value of shareholders' capital and optimize the benefits of their partners. Stakeholders (Ross, 2000). Regarding the adoption of
corporate sustainability policies, some authors claim to undermine the financial performance of organizations. For the followers
of this current, the remuneration of the invested capital tends to be inversely proportional to the investment in fronts of social
and environmental responsibility. This fact would lead shareholders to withdraw their finance from the company, leading to a
situation of decapitalization and reduced liquidity that, in turn, would bring financial loss to the other stakeholders of the
organization.
 The opposite current, however, argues that financial performance has a positive relationship with social and
environmental investments since the adoption of sustainable practices influences the expectations that stakeholders have
regarding the organization. These competing strands provide input for debate. From them, several study fronts emerged that seek
to explain the differences in profitability between ISE and Ibovespa. The following are the data from this study, who used the
Sharpe Ratio to buy both indexes.

 10
Research, Society and Development, v. 10, n. 10, e516101019251, 2021
 (CC BY 4.0) | ISSN 2525-3409 | DOI: http://dx.doi.org/10.33448/rsd-v10i10.19251

7. Data Presentation and Analysis
 For this paper, it was assumed that ISE's performance is equivalent to the average performance of companies that adopt
sustainable finance practices. As stated above, these companies seek to balance financial results with social and environmental
responsibility to maximize the benefit of their stakeholders. In turn, Ibovespa's performance was considered to be equivalent to
that of traditional neoclassical companies, which believe that the return on invested capital tends to be inversely proportional to
investment in fronts of social and environmental responsibility.
 The first indicator performance analyzed was the profitability, i.e., how much each index has appreciated or depreciated
between 2005 and 2012. From this point of view alone, investing in sustainable companies is slightly more beneficial than
investing in profit-oriented companies. As the table below shows, the maximum appreciation of the ISE was higher than the full
recognition of the Ibovespa; and the maximum devaluation of the former was lower than the maximum depreciation of the latter:

 Table 3: Comparative analysis of index appreciation.
 Ibovespa ISE
 Maximum 13.68% Maximum 14.49%
 Minimum -12.10% Minimum -10.36%
 Source: Authors.

 To alone compare risk and return, the results of the indices are slightly divergent. The combination of these two
variables, however, gives companies that adopt the TBL assumptions a more significant advantage. From the analysis of the
asset variability premium, it is clear that the ISE has a return increase of 5.68% for each 1% increase in risk, while Ibovespa,
under the same conditions, t increased 4.53% return.

 Table 4: Return versus risk analysis.
 Analysis Selic Ibovespa ISE
 Return -0.05% 0.03% 0.05%
 Risk 0.84% 1.93% 1.80%
 Sharp Ratio - 4.53% 5.68%
 Source: Authors.

 11
Research, Society and Development, v. 10, n. 10, e516101019251, 2021
 (CC BY 4.0) | ISSN 2525-3409 | DOI: http://dx.doi.org/10.33448/rsd-v10i10.19251

 Figure 3: ISE x Ibovespa.

 Source: BM&F Bovespa.

 Table 5: Average growth rate Ibovespa.
Year 2009 2010 2011 2012 2013 2014 2015 2016 2017 2018 Ibovespa
2009 68.588,41
2010 1 69.304,81
2011 -9 -18,1 56.754,08
2012 -3,9 -6,2 7,4 60.952,08
2013 -6,9 -9,4 -4,7 -15,5 51.507,16
2014 -6,1 -7,8 -4,1 -9,4 -2,9 50.007,41
2015 -7,4 -9 -6,5 -10,7 -8,3 -13,3 43.349,96
2016 -1,8 -2,3 1,2 -0,3 5,4 9,7 38,9 60.227,28
2017 1,4 1,4 5,1 4,6 10,4 15,2 32,8 26,9 76.402,08
2018 2,8 3 6,5 6,3 11,3 15,1 26,6 20,8 15 87.887,27
2019 3,5 3,7 6,8 6,8 11 14 22,1 17 12,3 9,6 96.353,33

 Source: B3.

 12
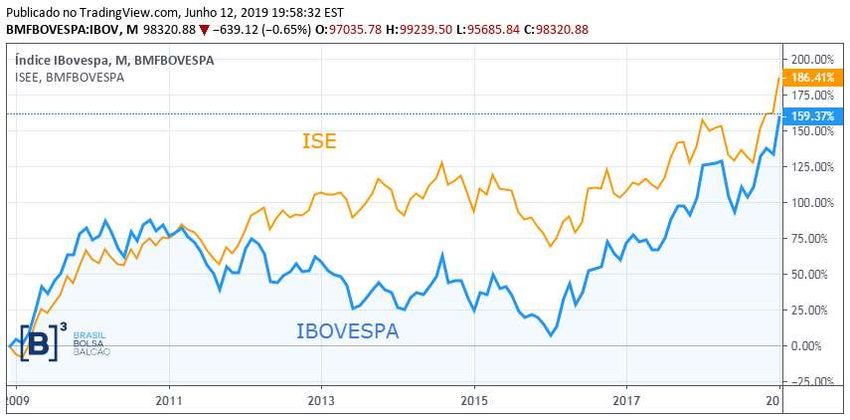
Research, Society and Development, v. 10, n. 10, e516101019251, 2021
 (CC BY 4.0) | ISSN 2525-3409 | DOI: http://dx.doi.org/10.33448/rsd-v10i10.19251

 Table 6: Average growth rate ISE.
 Year 2009 2010 2011 2012 2013 2014 2015 2016 2017 2018 ISE
 2009 1.972,04
 2010 5,8 2.087,30
 2011 1,2 -3,3 2.018,94
 2012 7,3 8 20,5 2.432,53
 2013 5,9 5,9 10,8 1,9 2.479,61
 2014 4,3 3,9 6,4 0 -1,9 2.431,59
 2015 1,2 0,3 1,2 -4,5 -7,6 -12,9 2.118,01
 2016 2,9 2,4 3,6 -0,2 -0,9 -0,4 13,8 2.410,05
 2017 4,6 4,4 5,8 3,1 3,4 5,2 15,6 17,4 2.829,50
 2018 5,2 5,1 6,4 4,2 4,6 6,3 13,6 13,6 9,9 3.108,65
 2019 4,8 4,6 5,7 3,7 4 5,2 10,3 0,8 5,3 1 3.139,54

 Source: B3.

 During the research, it was noticed new data regarding the performance of the studied indices. As the tables and graphs
below show, between 2005 and early 2011, ISE and Ibovespa behaved very similarly, which was slightly higher than most of
the time. From February 2011, however, ISE surpassed the Ibovespa, and, at the beginning of the following year, its performance
was considerably superior to that of Ibovespa.
 No mention could be found in the literature. As a possible explanation to him, however, the author highlights the
widespread relationship between sustainability and the cost of capital. Investors see unsustainable companies as riskier. This
perception leads to an increase in the price of the equity. On the other hand, banks are increasingly making credit conditional on
socio-environmental analysis, especially after the launch of the Equator Principles. This fact increases the cost of capital of third
parties. The factors exposed, combined, expose unsustainable companies to higher interest rates, and increase the weighted
average cost of capital, lowering their economic value and worsening their economic and financial performance.

8. Conclusion
 The present article seeks to expose how the concept of sustainable development has changed over the years to meet
society's aspirations, as well as to fit into its socio-economic and cultural context. It also sought to show how these principles
crossed the barriers of the private and became part of the corporate environment. This study compared the performance of
companies that adopt the sustainable finance paradigm with the performance of those who chose not to take this direction, to
assess whether or not sustainability contributions bring financial returns. Therefore, the Corporate Sustainability Index (ISE) and
the Bovespa Index (Ibovespa) were adopted as representatives of each of the mentioned segments.
 Based on the results of the sample, we can conclude that investing in companies based on the TBL assumptions is
slightly more advantageous than investing in neoclassical companies, as they return the investor higher returns for the same
amount of risk. During the preparation of the study, it can also be observed that from the beginning of 2011, the performance of
ISE surpassed that of Ibovespa, and in the following years, its performance was considerably higher than the last one. Although
no scientific explanation could be found for this fact, the authors highlight the possibility that this phenomenon is linked to the
risk perception of non-sustainable companies, which has a direct impact on their average cost of capital. For future research, we
suggest to isolate companies that concurrently participate in both indexes, to better evaluate the performance of each follow-up.

 13
Research, Society and Development, v. 10, n. 10, e516101019251, 2021
 (CC BY 4.0) | ISSN 2525-3409 | DOI: http://dx.doi.org/10.33448/rsd-v10i10.19251

References
Aktouf, O. (2004). Pós-globalização, Administração e Racionalidade Econômica. Atlas.

BM&F BOVESPA (2019a). BM&F Bovespa: A nova bolsa, http://www.bmfbovespa.com.br

BM&F BOVESPA (2019b). Índice de Sustentabilidade Empresarial (ISE), http://www.bmfbovespa.com.br/pt_br/produtos/indices/indices-de-
sustentabilidade/indice-de-sustentabilidade-empresarial-ise.htm

Borba, P. R. T. (2005). Relação entre desempenho social e corporativo e desempenho financeiro de empresas no Brasil, 135 f. Dissertação (Mestrado em
Administração) – FEA, Universidade de São Paulo.

Borba, P. R. T. et al. (2005). Crítica à Teoria dos Stakeholders como Função-Objetivo Corporativa. Caderno de Pesquisas em Administração, 12, (1), 33-42.

Brasil. Ministério do Meio Ambiente. (2019). Agenda 21. http://www.mma.gov.br

Brealey, R. A., & Myers, C. (2000). Principles of Corporate Finance. McGraw-Hill.

Brüseke, F. J. (1995). O problema do desenvolvimento sustentável. In: Cavalcanti, C. (Org.). Desenvolvimento e natureza: estudos para uma sociedade
sustentável. Cortez.

Burrell, G., & Morgan, G. (2006). Sociological paradigms and organizational analysis. Ashgate Publishing.

Cooper, R. (2006). The design experience: The role of design and designers in the 21 century. Ashgate Publishing.

Demajorovic, J. (2003). Sociedade de risco e responsabilidade socioambiental: Perspectivas para a educação corporativa, Senac.

Deschatre, G. A., & Majer, A. (2006). Aprenda a investir com sucesso em ações: Análise técnica e fundamentalista, Ciência Moderna.

Dias, T., & Cario, S.A.F. (2014). A relação entre Estado e sociedade no século XXI: A perspectiva paraeconômica como estratégia neodesenvolvimentista.
Desenvolvimento em Questão, 12, (27), 370-403.

Donaldson, T., & Preston, L.E. (1995). The stakeholder theory of the corporation: Concepts, evidence and implications. The Academy of Management Review,
20, (1), 65-91.

Dow Jones (2019). S&P Dow Jones, http://www.djaverages.com

Egri, C., & Pinfield, L. (2012). As organizações e a biosfera: Ecologia e Meio Ambiente. In: S. Clegg, C. Hardy and W. Nord (Org). Handbook de Estudos
Organizacionais. Vol. 1, Atlas.

Freeman, E. R. (1998). A stakeholder theory of the modern corporation. In: L. P. Hatman. Perspective in Business Ethics, McGraw-Hill.

Hill, C. W. L., & Jones, T. M. (1992). Stakeholder-agency Theory. Journal of Management Studies, 9, (1), 131-154.

Hopwood, B., Mellor, M., & O’Brien, G. (2005), Sustainable development: mapping different approache. Sustainable Development, 13, (1), 38-52.

ISEB3 (2019) Sustentabilidade empresária ISE. http://iseb3.com.br

Machado, M. R., Machado, M. A. V., & Corrar, L. (2012), Desempenho do Índice de Sustentabilidade Empresarial da Bolsa de Valores de São Paulo. Semead,
FEA/USP, São Paulo.

Marcovitch, J. (2012.). Certificação e sustentabilidade ambiental: Uma análise crítica. http://www.usp.br/mudarfuturo/

May, P., Lustosa, M. C., & Vinha, V. (2003). Economia do meio ambiente: Teoria e prática. Campus.

Nordhaus, W. D. & Samuelson, P. A. (2012). Economia. McGraw-Hill.

Nogueira, C. M. S., & Gomes, A. C. C. (2012). Desempenho do Índice de Sustentabilidade Empresarial sob a perspectiva do Retorno Ajustado ao Risco:
sustentabilidade gera retorno? Revista Espaço Acadêmico, 11(121), 89-96.

Nunes, J.G., Teixeira, A., Nossa, V., & Galdi, F. (2012). Análise das variáveis que influenciam a adesão das empresas ao índice BM&F Bovespa de
Sustentabilidade Empresarial. Revista de Administração e Contabilidade da Unisinos, 7, (4), 328-340.

Nunes, T. C. S., Nova, S. P. C. & Cornachione Junior, E. B. (2011). As empresas sustentáveis são realmente mais rentáveis? E o seu nível de risco é diferente
das demais?, Semead, FEA/USP, São Paulo.

Ottman, J. (1998). Green marketing: Opportunity for innovation. LLC BookSurg.

Rezende, I., Nunes, J. G. & Portela, S. S. (2008). Um estudo sobre o desempenho financeiro do índice Bovespa de Sustentabilidade Empresarial. Revista de
Educação e Pesquisa em Contabilidade, 2, (1),71-93.

Rezende, I. et al. (2007). Um estudo sobre o desempenho financeiro do Índice BOVESPA de Sustentabilidade Empresarial, XXXI EnAnpad.

Rodrigues, M. C. P. (2005). Ação social das empresas privadas: Como avaliar resultados? Editora FGV.

Ross, S. A. (2015). Administração Financeira. AMGH.

 14
Research, Society and Development, v. 10, n. 10, e516101019251, 2021
 (CC BY 4.0) | ISSN 2525-3409 | DOI: http://dx.doi.org/10.33448/rsd-v10i10.19251

Savitz, A. W. (2006). The Triple Bottom Line. Jossey-Bass.

Schnaiberg, A., & Gould, K. (1994). Environment and Society: The Enduring Conflict, St. Martin's Press.

Shankman, N. A. (1999). Reframing the debate between agency and stakeholders theory of the firm. Journal of Business Ethics, 21, (4), 319-334.

Sitarz, D. (1993). Agenda 21: The Earth summit strategy to save our planet. Boulder, Earthpress.

Smith, H. J. (2003). The shareholders vs. stakeholders debate, MIT Sloan Management Review, 44(4), 85-90.

Souza, F. S., Pereira, R. S., & Zucco, A. (2012). Análise do Índice de Sustentabilidade Empresarial: Um estudo exploratório comparativo com o IBOVESPA.
XVI Engema. FEA-USP.

Teixera, E. A., Nossa, V., & Funchal, B. (2011). O índice de sustentabilidade empresarial (ISE) e os impactos no endividamento e na percepção de risco. Revista
de Contabilidade Financeira, 22, (55), 29-44.

Varga, G. (2001). Índice de Sharpe e outros indicadores de performance aplicados a fundos de ações brasileiros. Revista de Administração Contemporânea, 5,
(3), 215-245.

WCED, World Comission on Environment and Development. (1987). Our Common Future. Oxford University Press.

Wright, P., Kroll, M., & Parnell, J. (2000). Administração Estratégica. Atlas.

 15
You can also read