Colonoscopic image synthesis with generative adversarial network for enhanced detection of sessile serrated lesions using convolutional neural ...
←
→
Page content transcription
If your browser does not render page correctly, please read the page content below
www.nature.com/scientificreports
OPEN Colonoscopic image synthesis
with generative adversarial
network for enhanced detection
of sessile serrated lesions using
convolutional neural network
Dan Yoon1,10, Hyoun‑Joong Kong2,3,4,5,10, Byeong Soo Kim1, Woo Sang Cho1,
Jung Chan Lee3,6,7, Minwoo Cho2,8, Min Hyuk Lim3, Sun Young Yang9, Seon Hee Lim9,
Jooyoung Lee9, Ji Hyun Song9, Goh Eun Chung9, Ji Min Choi9, Hae Yeon Kang9,
Jung Ho Bae9* & Sungwan Kim3,5,7*
Computer-aided detection (CADe) systems have been actively researched for polyp detection in
colonoscopy. To be an effective system, it is important to detect additional polyps that may be easily
missed by endoscopists. Sessile serrated lesions (SSLs) are a precursor to colorectal cancer with a
relatively higher miss rate, owing to their flat and subtle morphology. Colonoscopy CADe systems
could help endoscopists; however, the current systems exhibit a very low performance for detecting
SSLs. We propose a polyp detection system that reflects the morphological characteristics of SSLs
to detect unrecognized or easily missed polyps. To develop a well-trained system with imbalanced
polyp data, a generative adversarial network (GAN) was used to synthesize high-resolution whole
endoscopic images, including SSL. Quantitative and qualitative evaluations on GAN-synthesized
images ensure that synthetic images are realistic and include SSL endoscopic features. Moreover,
traditional augmentation methods were used to compare the efficacy of the GAN augmentation
method. The CADe system augmented with GAN synthesized images showed a 17.5% improvement in
sensitivity on SSLs. Consequently, we verified the potential of the GAN to synthesize high-resolution
images with endoscopic features and the proposed system was found to be effective in detecting
easily missed polyps during a colonoscopy.
Colorectal cancer (CRC) is the third most common cancer diagnosed globally1. A screening colonoscopy is the
proven modality that enables a reduction in CRC risk through early detection and removal of premalignant
colorectal polyps2. The two main types of precancerous lesions of CRC are conventional adenomas (ADs, the
precursors of 70% of all CRCs) and sessile serrated lesions (SSLs, the precursors of 15–30% of all CRCs)3. The
detection rate of premalignant polyps is the key quality indicator in a c olonoscopy4. However, the overall detec-
tion rate has varied significantly among individual endoscopists, owing to different recognition skills and the
withdrawal technique5. Additionally, risk factors leading to missed polyps, such as flat or sessile shapes, a pale
color, and small size, can affect the detection r ate6. Previous studies reported a wide variation in the adenoma
1
Interdisciplinary Program in Bioengineering, Graduate School, Seoul National University, Seoul 08826, South
Korea. 2Transdisciplinary Department of Medicine and Advanced Technology, Seoul National University Hospital,
Seoul 03080, South Korea. 3Department of Biomedical Engineering, Seoul National University College of
Medicine, Seoul 03080, South Korea. 4Medical Big Data Research Center, Seoul National University College of
Medicine, Seoul 03080, South Korea. 5Artificial Intelligence Institute, Seoul National University, Seoul 08826,
South Korea. 6Institute of Medical and Biological Engineering, Medical Research Center, Seoul National
University, Seoul 03080, South Korea. 7Institute of Bioengineering, Seoul National University, Seoul 08826, South
Korea. 8Biomedical Research Institute, Seoul National University Hospital, Seoul 03080, South Korea. 9Department
of Internal Medicine and Healthcare Research Institute, Healthcare System Gangnam Center, Seoul National
University Hospital, Seoul 06236, South Korea. 10These authors contributed equally: Dan Yoon and Hyoun-Joong
Kong. *email: newsanapd@naver.com; sungwan@snu.ac.kr
Scientific Reports | (2022) 12:261 | https://doi.org/10.1038/s41598-021-04247-y 1
Vol.:(0123456789)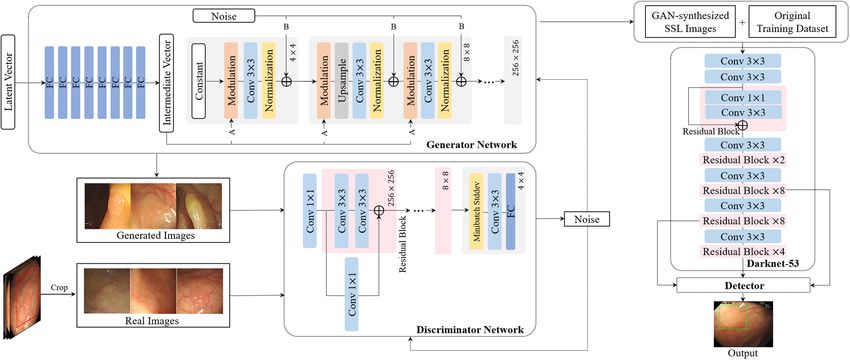
www.nature.com/scientificreports/
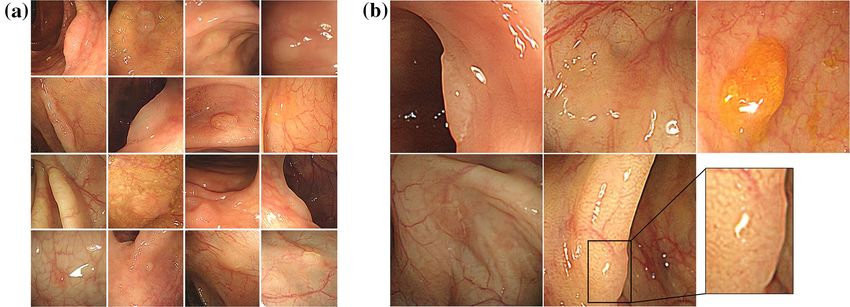
Figure 1. Generated SSL images by StyleGAN2. (a) Representative synthetic images with high-quality SSL
features, and (b) endoscopic features of SSLs discovered in GAN-synthesized SSL images including an indistinct
border, flat and irregular shape, mucous cap, a cloud-like surface without vessels, and a dark spot inside the
crypts.
detection rate (9.4–32.7%) and SSL detection rate (0.6–11%) across endoscopists, and the overall polyp miss rate
is approximately 22%5,7,8. The variation of the detection rate and the high polyp miss rate significantly affect the
efficacy of colonoscopies for CRC p revention9.
Artificial intelligence technology based on deep learning is being applied in various medical fields, and
research is being actively conducted to develop computer-aided detection (CADe) systems for colonoscopies to
overcome the limitation of the variance of human s kills10–12. Color, texture, and shape-based features have been
used to detect polyps, and polyp detection systems using convolutional neural networks (CNNs) have shown
promising results in recent s tudies11–14. A meta-analysis that included five randomized control trials reported
that CADe groups exhibited a 44% increase (36.6% vs. 25.2%) in the adenoma detection rate (ADR) and a 70%
increase (58% vs. 36%) in the number of ADs per colonoscopy (APCs) when compared with the control groups15.
These well-trained CADe systems demonstrated high performance for adenoma detection15–17. However, the
fidelity of CADe systems for SSL detection is still lacking, owing to the very low SSL detection performance when
compared with the clinical benchmark for the SSL detection rate (> 5%)15,18. SSLs are a high-risk precursor for
CRC; however, they can be easily missed even by experienced endoscopists, owing to their subtle morphology
with indistinct border, pale color, and flat or sessile shape19–24. Large individual variations in the SSL detection
rate have also been observed in clinical experts who have been extensively trained to detect S SLs25. Therefore,
systems specializing in SSL detection must be developed to improve detection performance by detecting addi-
tional CRC precursors that may not be visually r ecognized26.
Training data composition is important for a colonoscopy CADe system because colon polyp datasets col-
lected from clinical practice are typically imbalanced27,28. Prevalence studies indicate that ADs are approximately
eight times more prevalent than SSLs, and each type of polyp exhibits unique endoscopic f eatures29. These data
imbalance problems can introduce a bias in the training process, thereby decreasing the performance of the
CADe system30. To address these problems, traditional augmentation methods have been explored to expand
minor types of data, including flipping, rotation, scaling, and c ropping31,32. Recently, generative adversarial
networks (GANs) have led active research on medical data synthesis and have been considered for various
applications33–35. However, in the field of endoscopy, it is difficult to generate whole synthetic images because
endoscopy does not have a formal protocol and s tructure36. To overcome this problem, studies have employed
GANs to generate endoscopic images that include polyps by synthesizing a normal mucosa background and a
lesion patch37,38. They showed improved detection performance on gastric cancers and colorectal polyps. Nev-
ertheless, these synthesized images have relatively low quality when compared with actual endoscopic images,
and they may not reflect an actual endoscopic environment including polyp features such as color and texture.
In the present study, a style-based GAN (StyleGAN) method was adopted to decrease the type imbalance by
synthesizing high-resolution endoscopic images, almost indistinguishable from real images and including fea-
tures of SSLs, proven through a visual Turing test. Then, a polyp detection system contributing to the detection
of easily missed polyps was developed based on the validated GAN-synthesized images.
Results
SSL image synthesis with GAN. In Fig. 1, the synthesized SSL images exhibited global consistency and
realistic mucosa features, including texture, color, folds, and blood vessels. Most importantly, the SSLs in the
synthesized images depicted the real endoscopic features of SSLs, including sessile or flat morphology, a pale
color, disrupted vascular pattern, altered fold contour, indistinct borders with mucus capping, and a rim of bub-
bles or debris (Fig. 1b). Those features and the quality of synthesized images were identified in the assessment by
clinical experts. Additionally, we identified that SSL images with combined features of two or more polyp images
Scientific Reports | (2022) 12:261 | https://doi.org/10.1038/s41598-021-04247-y 2
Vol:.(1234567890)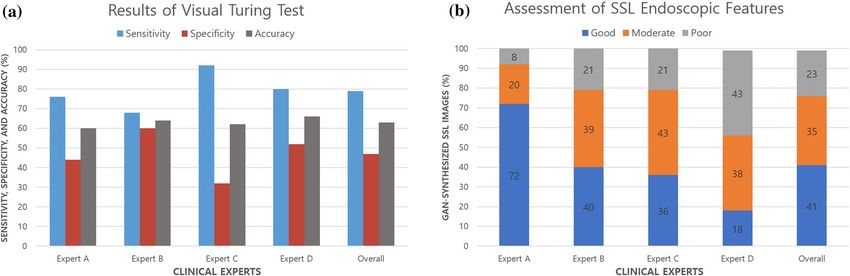
www.nature.com/scientificreports/

                                 Figure 2.  Visualization of SSL augmented images with t-SNE. (a) t-SNE of SSL images between original dataset
                                 (blue) and GAN augmented dataset (orange), (b) t-SNE of SSL images between original dataset (blue) and
                                 traditional augmentation dataset (orange).

                                 present in the GAN training datasets were synthesized (Supplementary Fig. S1). These images can provide more
                                 information about the real data distribution. To evaluate the quality of images synthesized with the GAN, we
                                 conducted t-SNE visualization and assessments by clinical experts.

                                 Fréchet inception distance (FID) score computation. While training StyleGAN2 on the SSL images, we quanti-
                                 fied the quality of the synthesized images using an FID score. The FID score was initially 426.0625, while the final
                                 FID score was 42.1885 (Supplementary Fig. S2).

                                 Visualization of t‑SNE. We used t-SNE visualization to further analyze the synthesized images. The t-SNE
                                 algorithm for dimensionality reduction enables the embedding of high-dimensional data into a 2D space. We
                                 used t-SNE on a random selection of 200 SSL real images from the original dataset and 200 SSL synthetic images
                                 generated by the GAN. As presented in Fig. 2a, the synthetic SSL data group is not separated from the original
                                 data distribution, which means that the synthetic images reflected a real distribution. Moreover, it may be helpful
                                 to provide more features about the real distribution uncovered by the original dataset. However, we confirmed a
                                 discrete distribution between the real images in the original dataset and the traditionally augmented images in
                                 Fig. 2b. New features extracted from the traditional augmentation dataset may provide additional information;
                                 however, they may not be helpful to approximate the real distribution.

                                 Quality assessment with clinical experts. We evaluated the image quality of synthetic SSL images with four
                                 experts. The prevalence of the samples was blinded to the participating experts. In the first assessment, a visual
                                 Turing test was conducted to differentiate between the real and synthetic colonoscopy images; we tested a total
                                 of 50 colonoscopy images, which consisted of 25 real and 25 synthetic SSL images that were randomly selected
                                 from the real images and GAN-synthesized images. The real images were evaluated as positive, and the synthetic
                                 images as negative. All experts showed low performance in identifying whether the lesions shown were true
                                 or synthetic. The overall accuracy was 63% (ranging between 60 and 66%), and the sensitivity and specificity
                                 for real images was 79% (ranging between 68 and 92%) and 47% (ranging between 32 and 60%), respectively
                                 (Fig. 3a, Supplementary Table S1). In the second assessment, a micro assessment of synthetic SSL images was
                                 performed according to the characteristic endoscopic features of SSLs, including the indistinct border, pale
                                 color, and mucus cap. From the 2400 synthetic SSL images, 120 images were randomly selected for the micro
                                 assessment. The image quality was rated in three grades (good, moderate, and poor), representatively shown in
                                 Supplementary Fig. S3. The experts judged that 76% (above moderate) of the synthetic SSL images reflected the
                                 endoscopic characteristics well (Fig. 3b).

                                 Performance comparison. Performance comparison on polyp detection. To illustrate the validity of the
                                 SSL augmentation techniques to improve the detection of premalignant polyps, such as AD and SSL, we evalu-
                                 ated the performance of the augmentation models with the validation dataset, which was composed of 1106
                                 polyp images with 1141 polyps and 1000 normal mucosa images without any polyps. Each polyp image can
                                 contain more than one polyp; therefore, the metrics were evaluated per polyp. We implemented the detection
                                 models on the whole validation dataset to check the improvement in performance depending on the augmenta-
                                 tion techniques and the ratio of the augmented SSLs. To address the imbalance in the organizational ratio of
                                 AD, hyperplastic polyps (HP), and SSL within dataset (11:7:1), we augmented SSL images by 1200/1800/2400
                                 corresponding to HP, the average of HP and AD, and AD. As can be observed in Table 1, the models trained on
                                 the augmented dataset with two augmentation methods achieved relatively higher performance when compared
                                 with the original model. Although the GAN augmentation (GAN-aug) models showed slightly less positive
                                 predictive value (PPV) than the traditional augmentation (T-aug) models, they achieved better performance

Scientific Reports |   (2022) 12:261 |                https://doi.org/10.1038/s41598-021-04247-y                                                   3

                                                                                                                                              Vol.:(0123456789)
www.nature.com/scientificreports/
Figure 3. Results of quality assessment with clinical experts. (a) Results of a visual Turing test by four experts
to differentiate between real and GAN-synthesized SSL colonoscopy images in 1 s, (b) Assessment of SSL
endoscopic features in 120 representative samples synthesized by the GAN.
than other models for the average precision (AP) and F1-score, which indicates the overall performance of the
detection model. To compare all the augmented models, we focused on AP, which is the representative metric
of object detection. Supplementary Fig. S4 shows the variation in the performance (AP) on polyp detection
according to the proportion of augmented SSL images in the training dataset in comparison with the original
dataset, original + 1200 (aug1), original + 1800 (aug2), and original + 2400 (aug3) augmented datasets. Com-
pared with the performance of the original model, both augmentation methods exhibited a highly improved
performance. However, it can be confirmed that data augmentation over a particular proportion causes perfor-
mance degradation. Through the augmentation methods, we identified that 1800 SSL image generation leads to
the best performance in each method. In Table 1, the detection model with the GAN-aug2 dataset achieved the
best performance, except for the specificity and PPV. SSL is a polyp type that has inconspicuous features; thus,
the increase in SSL images can lead to high sensitivity and low specificity. The ROCs of each of the best models
in the original, T-aug, and GAN-aug datasets are shown in Supplementary Fig. S5. In addition, public datasets
were evaluated to compare the performance of our model with that of models developed in other s tudies31,39,40.
A CNN-based approach CUMED of the MICCAI 2015 challenge on polyp detection39 and two optimal models
using a faster R-CNN proposed by Shin et al.31 were compared on ETIS-LaribPolypDB41. A model based on
YOLOv2 proposed by Lee et al.40 was computed on CVC-ClinicDB42. As shown in Supplementary Table S2, the
GAN-aug2 model achieved the highest sensitivity value on both datasets: 89.4% on ETIS-LaribPolypDB and
91.0% on CVC-ClinicDB. The detected polyp images obtained using our SSL images, ETIS-LaribPolypDB, and
CVC-ClinicDB are shown in Supplementary Fig. S6.
Performance comparison on histological polyp type. To identify the performance improvement in AD and SSL
detection, we separated polyps in the validation dataset into three histological types: AD, HP, and SSL. The
polyps included in the validation dataset comprised 620 AD, 438 HP, and 63 SSLs. To accurately evaluate the
effectiveness of the detection system for SSLs, we collected 130 additional SSL images for the temporal validation
dataset between March 2020 and October 2020 from the same institution.
We evaluated three models on the type-separated polyp validation dataset, original model, T-aug2 model, and
GAN-aug2 model. Two augmented models were selected because they are representative of the whole validation
dataset in each augmentation method. Compared with the original model, polyp detection sensitivity for each of
the three types increased for the GAN-aug2 model. Notably, the GAN-aug2 model exhibited a 19.1% sensitivity
improvement when compared with the original model on SSL images (Supplementary Table S3).
Because the number of SSLs in the validation dataset was small to assure the effectiveness of the GAN aug-
mentation, we validated with the SSL temporal dataset, which included 130 images with 133 SSLs. As shown in
Table 2, by evaluating all models in the SSL temporal validation dataset, we obtained similar results to the aug-
mented models with 1800 SSL images, which showed high performance when compared with the other models.
In addition, GAN augmentation methods also exhibited better performance than the traditional augmentation
methods in this case. As a result, we can confirm that the GAN is validated for use in augmentation methods.
Furthermore, its performance changed according to the identified augmentation ratio, and we could identify
the importance of augmentation considering the distribution of the data.
Discussion
In this paper, we aimed to generate synthetic SSL images using a GAN for data augmentation to address the
data imbalance issue that commonly exists in medical image analysis. As observed in Table 3, the distribution
of the polyp histology classes is imbalanced, especially for SSLs, which are a high-risk precursor of CRC but are
easily missed during a colonoscopy23,24. To improve the performance of the polyp detection system on easily
missed polyps, data augmentation with GAN-synthesized SSL images was applied. In previous studies, there were
some trials to synthesize endoscopy images using a G AN37,38,43,44. For domain adaptation and 3D reconstruction
Scientific Reports | (2022) 12:261 | https://doi.org/10.1038/s41598-021-04247-y 4
Vol:.(1234567890)Scientific Reports |
Evaluation on validation dataset (1141 polyps and 1000 negative images) (95% CI)
(2022) 12:261 |
Model Sensitivity Specificity PPV NPV F1 score AP ACC AUROC
Original 0.9053 (0.8883−0.9223) 0.9200 (0.9032−0.9368) 0.9417 (0.9281−0.9553) 0.8949 (0.8759−0.9138) 0.9231 (0.9076−0.9387) 0.8909 (0.8728−0.9090) 0.9122 (0.9001−0.9243) 0.90 (0.8884−0.9140)
0.9299 (0.9151−0.9447) 0.9040 (0.8857−0.9223) 0.9654 (0.9548−0.9760) 0.9234 (0.9066−0.9399) 0.9473 (0.9343−0.9603) 0.9280 (0.9139−0.9430) 0.9178 (0.9060−0.9295) 0.93 (0.9194−0.9411)
www.nature.com/scientificreports/
T-aug1
T-aug2 0.9377 (0.9237−0.9517) 0.9060 (0.8891−0.9229) 0.9665 (0.9560−0.9769) 0.9273 (0.9122−0.9423) 0.9518 (0.9394−0.9642) 0.9341 (0.9191−0.9345) 0.9229 (0.9115−0.9342) 0.94 (0.9310−0.9511)
T-aug3 0.9343 (0.9199−0.9486) 0.9100 (0.8922−0.9276) 0.9673 (0.9569−0.9738) 0.9239 (0.9127−0.9351) 0.9505 (0.9379−0.9630) 0.9275 (0.9125−0.9423) 0.9229 (0.9116−0.9343) 0.93 (0.9216−0.9431)
GAN-aug1 0.9413 (0.9277−0.9549) 0.9030 (0.8847−0.9216) 0.9606 (0.9493−0.9719) 0.9290 (0.9131−0.9449) 0.9509 (0.9385−0.9634) 0.9341 (0.9197−0.9485) 0.9234 (0.9120−0.9347) 0.94 (0.9346−0.9542)
GAN-aug2 0.9544 (0.9371−0.9717) 0.9010 (0.8838−0.9177) 0.9511 (0.9386−0.9636) 0.9415 (0.9279−0.9551) 0.9527 (0.9403−0.9650) 0.9450 (0.9318−0.9582) 0.9295 (0.9186−0.9404) 0.96 (0.9547−0.9709)
GAN-aug3 0.9448 (0.9316−0.9581) 0.8910 (0.8717−0.9003) 0.9506 (0.9380−0.9632) 0.9340 (0.9235−0.9444) 0.9477 (0.9383−0.9570) 0.9377 (0.9238−0.9517) 0.9197 (0.9081−0.9313) 0.95 (0.9425−0.9609)
Table 1. Performance of original, traditional augmentation (T-aug), and GAN augmentation (GAN-aug) models for the validation dataset including polyp (n = 1141) and negative images (n
= 1000). Augmented datasets, which add augmented images 1200/1800/2400 to the original dataset, are each labelled aug1, aug2, and aug3. All models are evaluated with sensitivity, specificity,
positive predictive value (PPV), negative predictive value (NPV), F1 score, and average precision (AP), accuracy (ACC), and area under the receiver operating characteristic curve (AUROC).
https://doi.org/10.1038/s41598-021-04247-y
5
Vol.:(0123456789)www.nature.com/scientificreports/
Evaluation on SSL temporal validation dataset (95% CI)
Types SSL (n=133)
Model Sensitivity PPV AP
Original 0.8421 (0.7802–0.9041) 0.9333 (0.8909–0.9757) 0.8224 (0.7574–0.8875)
T-aug1 0.9023 (0.8518–0.9528) 0.9677 (0.9378–0.9987) 0.8981 (0.8467–0.9495)
T-aug2 0. 9098 (0.8611–0.9585) 0.9603 (0.9271–0.9834) 0.9003 (0.8494–0.9512)
T-aug3 0.8864 (0.8325–0.9403) 0.9669 (0.9365–0.9973) 0.8821 (0.8273–0.9369)
GAN-aug1 0.9242 (0.8774–0.9580) 0.9385 (0.8977–0.9793) 0.9178 (0.8711–0.9645)
GAN-aug2 0.9398 (0.8994–0.9802) 0.9398 (0.8994–0.9802) 0.9302 (0.8869–0.9735)
GAN-aug3 0.9167 (0.8697–0.9637) 0.9528 (0.9168–0.9888) 0.9107 (0.8622–0.9592)
Table 2. Sensitivity, positive predictive value (PPV), and average precision (AP) of original model, traditional
augmentation models, and GAN augmentation models for sessile serrated lesion (SSL) temporal validation
dataset (n = 133).
through endoscopy images, GAN techniques were used to synthesize intermediate data of the network, which is
operated to translate original endoscopy images to another domain43,44. Although GAN synthesis studies have
also been conducted for detection problems, the methods were bounded to integrate normal mucosa background
images and polyp lesion patches37,38. These synthesized images through the randomized combinations of lesion
patches and normal mucosa have relatively low quality when compared with the actual endoscopic images, and
they may not reflect the endoscopic locational information about histological features, such as color, shape of
folds according to thickness, and vessel distributions45–47. Additionally, only deterministic polyps are generated
including limited variations in polyp features in terms of color and t exture38. To improve detection performance
on easily missed polyps, augmented data must contain subtle features of SSLs that are difficult to detect. In our
study, StyleGAN2 exhibited the synthesized high-resolution whole endoscopic images including the GAN mixed-
style images, which showed the combined features of two or more SSL images. The quality of the synthesized
polyp images was evaluated by four expert endoscopists to verify the reality and endoscopic features of the SSLs.
The annotation of the synthetic images was checked twice by the operators. The result proved that it is possible
to generate high-resolution endoscopy images using a GAN with only polyp images as the input. Moreover, with
one histological type, a GAN can generate polyps, including the endoscopic features of each type, such as texture,
color, folds, and blood vessels ensuring the reliability of data synthesis with lesion features in the medical domain.
Through the use of these synthetic images, we can achieve high performance, especially on SSLs. Com-
pared with a traditional augmentation method, GAN-aug models exhibited high detection performance overall
(Tables 1, 2, and Supplementary Table S3). This revealed that the GAN augmentation technique can be more effec-
tive in augmenting endoscopy datasets for detection than traditional augmentation methods. Our results showed
that the synthesized polyp images have meaningful features and can be helpful in solving the data imbalance
problem in developing detection systems. Moreover, we could identify the reason for the relatively low perfor-
mance of T-aug models when compared with GAN-aug models through data distribution visualized using t-SNE.
In Fig. 2, the augmented images from the GAN are distributed in the same space with real data; however, they
may fill in the distributions by adding data points that are not covered by the original dataset. Considering the
augmentation number in the training dataset, it is important to consider the ratio of the augmented data accord-
ing to the composition. We identified that additional augmented data does not lead to improved performance.
As shown in Tables 1 and 2, aug2, which augmented the data with 1800 synthetic SSL images, exhibits the best
performance. The reason why aug3 does not exhibit an improved performance when compared with aug2 may
be that the distribution of 2400 augmented data differs from the actual data distribution. When the generator
learns to map a small subset of the possible realistic modes, partial mode collapse occurs48. Data augmentation
over a certain value with partial mode collapse could distort the data distribution49,50.
To develop an effective CADe system, high detection performance for premalignant polyps that are hard to
detect, such as SSLs, is the key factor. Zhou et al.51 reported an 84.10% sensitivity to SSL frames with a system that
achieved an overall sensitivity of 94.07% and 0.98 AUC in a study by Wang et al.11. In particular, we could identify
a definite difference in detecting SSL polyps between the original model, T-aug model, and GAN-aug model (Sup-
plementary Table S3, Table 2). The GAN-aug2 model achieved a sensitivity of 95.24% and an AP of 0.9338 in the
SSL images included in the validation dataset. Additionally, in the SSL temporal validation dataset, we achieved
93.98% sensitivity and 0.9302 AP using the GAN-aug2 model. When performing external validation using public
datasets, the GAN-aug2 model also showed the best performance in terms of sensitivity compared with models
of other s tudies31,39,40. Using synthesized polyp images with the GAN resulted in a high detection performance
for SSLs and was proved to significantly improve the overall polyp detection performance. GAN-synthesized
images may approximate the data distribution, which helps the algorithm to be trained in the desired direction.
As a part of future research, we are planning to develop the system with a multi-center dataset and conduct
simultaneous video tests to identify the ability of the polyp detection system in comparison with clinical experts.
Furthermore, we will synthesize other polyp types, AD and HP, to confirm the effect of augmentation ratio of each
type on the detection performance, and thus develop the classification study on polyp type diagnosis using the
GAN-synthesized methods. These results can be extended to multi-class detection studies that simultaneously
conduct polyp detection and diagnosis. In addition to the GAN augmentation technique, an advanced CADe
Scientific Reports | (2022) 12:261 | https://doi.org/10.1038/s41598-021-04247-y 6
Vol:.(1234567890)www.nature.com/scientificreports/
Figure 4. Procedure to develop automatic polyp detection system with SSL augmentation using GAN. In the
generator network, “A” means a learned affine transform and “B” operates the noise broadcast.
system can be developed by improving the resolution of endoscopy with real-time image super-resolution and
training various parts of polyps through deep neural network correlation learning mechanism52,53.
In conclusion, we proposed an enhanced polyp detection system, which demonstrated higher detection per-
formance, especially on SSLs, which are easily missed during a colonoscopy. Moreover, we verified the capacity of
GAN in detection problems and confirmed that GAN-synthesized images are realistic and reflect the endoscopic
features of polyps. These features can provide additional information and ensure a comprehensive distribution
of the non-augmented dataset, which helps the model to achieve the intended direction of training. Further-
more, the endoscopic features of polyp types in GAN-synthesized images could be utilized for histological type
diagnosis problems.
Methods
In this section, we describe the dataset used in developing the polyp detection system, and explain the method
for generating synthetic SSL images using GAN and traditional augmentation methods. The quality of the
generated SSL images was evaluated using both quantitative and qualitative techniques. To identify the effect
of data augmentation depending on the proportion between imbalanced types, SSL minor type augmentations
were conducted three times (with an increase in the major type, middle type, and average between those). Then,
the performance analysis of the polyp detection models trained with original data, GAN augmentations, and
traditional augmentations could be conducted (Fig. 4). The study protocol adhered to the ethical guidelines of
the 1975 Declaration of Helsinki and its subsequent revisions, and was approved by Seoul National University
Hospital Institutional Review Board (number H-2001-083-1095). A study protocol was designed in consideration
of the use of retrospective data of the previous study (number H-1505-019-670), and informed consent from the
patients was waived by Seoul National University Hospital Institutional Review Board.
Dataset. We developed a polyp detection system using 5503 white-light colonoscopy images with polyps
from colonoscopy examinations undertaken at the Seoul National University Hospital, Healthcare System
Gangnam Center between October 2015 and February 2020. The endoscopic images for the development of
the colonoscopy AI system were collected from the retrospective and prospective databases. Retrospective data
was collected from the previous study’s database, and informed consent from the patients was w aived54. Pro-
spective data was collected under written informed consent. All colonoscopies were performed using high-
definition colonoscopes (EVIS LUCERA CV260SL/CV290SL, Olympus Medical Systems Co., Ltd., Japan) by
nine endoscopists. Polyp images were randomly split in a ratio of 8:2 to compose the training and validation
datasets (both images included different sets of polyps). To evaluate negative performance, we used 1000 normal
mucosa colonoscopy images with no polyps. In addition, because the number of SSLs in the validation dataset
was less than 100, we collected another 130 SSL images in the same process between March and October 2020 for
temporal validation. The organizational ratios within the dataset show that ADs, HPs, and SSLs have a ratio of
approximately 11:7:1, and SSLs constitute a very small proportion (Table 3). To address this imbalance, we aug-
mented the minor type SSL images by 1200/1800/2400 images corresponding to HP, the average of HP and AD,
and AD. Additionally, for external validation, ETIS-LaribPolypDB41 and CVC-ClinicDB42 were used to evaluate
the models. ETIS-LaribPolypDB is composed of 196 images with 208 polyps, and CVC-ClinicDB includes 612
images containing 646 polyps. Details of all the datasets are provided in Supplementary Fig. S7.
Scientific Reports | (2022) 12:261 | https://doi.org/10.1038/s41598-021-04247-y 7
Vol.:(0123456789)www.nature.com/scientificreports/
Training dataset Validation dataset Temporal validation dataset
The number of images 4397 1106 130
The number of polyps 4423 1141 133
Polyp characteristics, the number of polyps (%)
Histology
AD 2528 (57%) 620 (56%) –
SSL 222 (5%) 63 (5%) 133 (100%)
HP 1585 (36%) 438 (37%) –
Others 88 (2%) 20 (2%) –
Table 3. Polyp characteristics for the training, validation, and SSL temporal validation datasets. Each image
can contain more than one polyp. AD adenoma, SSL sessile serrated lesion, HP hyperplastic polyp.
Synthetic SSL image generation. We used two strategies to generate SSL synthetic data: a traditional
augmentation technique involving geometric transformations, and synthesized images through a GAN model,
which learned using SSL images from the training dataset. In each of the two augmentation methods, three
datasets were randomly sampled to a ratio of 1200/1800/2400 depending on the type imbalance. The number of
augmented SSL images was determined by the proportional difference between the major (AD), middle (HP),
and minor (SSL) types. Datasets to which 1200 synthetic SSL images were added to match the ratio with that of
the middle type (HP) are called aug1. Similarly, the other two datasets are called aug2 (1800 images) and aug3
(2400 images), respectively. For performance comparison, we used the same environment and the same hyper-
parameters.
Traditional augmentation method. Data augmentation including geometric transformations, such as rotat-
ing, flipping, cropping, and scaling has been traditionally conducted to enlarge the minor type of the training
dataset31,32. We implemented augmentation techniques on all 222 SSL images in the detector training dataset.
Each image was flipped vertically. Then, original non-flipped images and flipped images were rotated three times
at random angles θ1 = [0◦ , . . . , 120◦ ], θ2 = [120◦ , . . . , 240◦ ], θ3 = [240◦ , . . . , 360◦ ]. Subsequently, the rotated
images were randomly cropped to a size of 256 × 256 pixels twice. Consequently, each image was augmented 12
times ((1 + 1flip ) × 3rotation × 2crop ); 186 images were removed because they could not be cropped while includ-
ing the whole polyp region. Then, we sampled the 1200/1800/2400 augmented images randomly to create three
traditional augmented datasets, T-aug1, T-aug2, and T-aug3.
Image augmentation with GAN. The style-based generator architecture (StyleGAN2) has a hierarchical gen-
erator with a skip connection, and it normalizes the convolution weights using estimated statistics instead of
normalizing them with actual statistics55. It is a promising model for the generation of medical images, owing to
its capacity to synthesize high-resolution images with a realistic level of details56. The aim of training StyleGAN2
was to synthesize SSL colonoscopy images for improving the CADe performance in polyp detection. The data-
set is composed of SSL images, included in the polyp detection training datasets. To train StyleGAN2, 203 SSL
images were cropped to a size of 256 × 256 pixels that included the polyp region; the remaining 19 SSL images
were excluded because they could not be cropped to include the polyp. Adam optimizer was used to train Style-
GAN2 with momentum parameters β1 = 0 and β2 = 0.99 at a learning rate of 2 × 10⁻³.The main loss function
was a non-saturating logistic loss with R1 regularization. The training phase required approximately 5625 ticks
for a total of 45,000 iterations (54 days) with a batch size of 16 on an NVIDIA GeForce RTX 2080 Ti GPU× 2
(32 GB RAM). StyleGAN2 proposed an FID score to quantify the quality of the synthesized images every 10
ticks. The generated image resolution was adjusted to 256 × 256 pixels. To verify the differences between the
basic image generation model, the image-to-image translation model, and StyleGAN2, we additionally trained
DCGAN and CycleGAN on SSL images with the same resolution. After the loss converged, the synthesis results
of the three GAN models were compared. As shown in Supplementary Fig. S8, the images synthesized using
StyleGAN2 could be confirmed to have the highest resolution and most realistic lesion characteristics. Differ-
ences depending on the network type are discussed in the Supplementary Information (Description of the GAN
models used).
For quantitative evaluation of the quality of the generated images, we measured the differences between two
distributions in the high-dimensional feature space of an Inceptionv3 classifier with F ID57. If the activations on
the real and synthesized data are N(m, C) and N(mw , Cw ) respectively, FID is defined as
1
�m − mw �22 + Tr(C + Cw − 2(CCw ) 2 ) (1)
FID was computed with all images in the training dataset and 50,000 random images generated at every 10 ticks.
All generated images were annotated with the expected SSL region; those that could not be annotated were dis-
carded. Randomly sampled 1200/1800/2400 synthetic SSL images were added to the original training dataset to
compose the GAN-aug1, GAN-aug2, and GAN-aug3 datasets.
Scientific Reports | (2022) 12:261 | https://doi.org/10.1038/s41598-021-04247-y 8
Vol:.(1234567890)www.nature.com/scientificreports/
Assessment of GAN‑synthesized images. We used quantitative and qualitative techniques to analyze the results
and demonstrate the quality of the synthetic images generated by the GAN58,59. In the qualitative evaluation, two
methods were applied: (i) t-SNE visualization and (ii) quality assessment by clinical experts. Clinical experts in
the quality assessment process were board-certified gastroenterologists with colonoscopy experience ranging
from 5 to 20 years, and their annual volume of procedures was over 500. Written informed consent was obtained
from all participating physicians.
First, the t-SNE algorithm for dimensionality reduction enabled the embedding of high-dimensional data
into a 2D space. It represented the similarities between the data points by iteratively comparing the probability
distributions of different data points in both high- and low-dimensional s paces60. By applying t-SNE, the dis-
tribution of real/synthetic images can be visually analyzed33,61. We randomly selected 200 images each from the
real-SSL original dataset, traditionally augmented images, and GAN-synthesized images. Then, all images were
resized to 224 × 224 pixels. We set a perplexity of 30 for 1000 iterations.
Second, the synthesized images were evaluated by clinical e xperts33,37,43. Four clinical experts evaluated the
visual quality of the SSL samples generated by the GANs. Two test modules were developed using a PowerPoint
presentation, and the quality of the evaluation was assessed in two steps: Test 1—visual Turing test: differentiation
of a polyp image between a real and GAN-synthesized image within 1 s; Test 2—micro assessment of synthetic
SSL image quality (corresponding SSL endoscopic features) in 10% representative SSL synthetic images. Through
this process, we aimed to answer the following: (1) Is the appearance of the synthesized lesions realistic? (2) Do
the synthesized lesions sufficiently include the characteristic endoscopic features of SSLs? All images used in the
tests had a size of 256 × 256 pixels, and the prevalence of the samples was blinded.
Training polyp detection model. To develop the real-time polyp detection system, we applied one-stage
detection algorithms with high inference speed. Three representative one-stage object detection models, Reti-
naNet, single shot detector (SSD), and YOLOv3 were trained on the original training dataset with the same
environment for performance comparison (Supplementary Table S4). Considering frame per second (FPS) and
overall metrics, subsequent experiments were conducted using YOLOv3. Additionally, we confirmed the per-
formance of YOLOv3 according to the backbones used as the feature extractor. Darknet-53 was compared with
Inceptionv3, ResNet50, and AlexNet. As YOLOv3 performs detection at three scales, three inputs should be pro-
vided to the front model of YOLOv3 in 52 × 52 × 256, 26 × 26 × 512, 13 × 13 × 1024. We placed the outputs
from three layers of each model into the front model of YOLOv3 and trained it on the original training dataset
with the same parameter settings. As shown in Supplementary Table S5, Darknet-53 achieved a higher perfor-
mance overall compared to other backbone networks.
Through transfer learning, faster loss convergence can be achieved by initializing the current model with the
learned weights of a pre-trained model62,63. In this study, a pre-trained Darknet-53 model was used to customize
the YOLOv3 detection model. The backbone classifier is the Darknet-53 network, and features were extracted in
three different scales for the detection of objects of various sizes64 as shown in Supplementary Fig. S9. It uses the
sum-squared error between the predictions/ground truth and binary cross-entropy in class prediction as a loss.
2
S
B
obj
coord Iij (2 − wi × hi )[(xi − x̂i )2 + (yi − yˆi )2 ]
i=0 j=0
2
S
B
obj
+ coord Iij (2 − wi × hi )[(wi − ŵi )2 + (hi ĥi )2 ]
i=0 j=0
S2
B
obj
+ obj Iij [Ĉi log(Ci ) + (1 − Ĉi )log(1 − Ci )] (2)
i=0 j=0
2
S
B
noobj
+ noobj Iij [Ĉi log(Ci ) + (1 − Ĉi )log(1 − Ci )]
i=0 j=0
2
S
obj
+ class Iij [p̂i (c)log(pi (c)) + (1 − p̂i (c))log(1 − pi (c))]
i=0 c∈classes
where xi , yi is the centroid location of an anchor box, wi , hi are the width/height of the anchor; Ci is the object-
ness, which is the same as the confidence score; and pi (c) is the classification loss. When an object exists in
obj noobj
the boxj of celli, Iij is 1; otherwise, it is 0. If the boxj in celli has no object, the value of Iij is 1; otherwise, it
is 0. The size of the feature map is described as S , and B is the number of anchor boxes. Lambda coefficients,
2
coord , obj , noobj , and class are the weight parameters for localization, objects, no-object, and classes that were
initially set to 1, 5, 1, and 1, respectively, by default. An increase in the lambda coefficients affects the focused
part of the loss. Specifically, and increment in coord , obj , noobj , and class affects the intersection over union
(IoU), sensitivity, specificity, and confidence score, respectively. We set the lambda coefficients as 1, 9, 2, and 1
based on experimental trials. The model was initialized with ImageNet weights and then fine-tuned to learn the
endoscopic features of polyps.
We trained YOLOv3 with a pre-trained Darknet-53 model with a batch size of 8, and the learning rate for
the Adam optimizer was 1 × 10⁻⁷ , which was selected from the range [1 × 10⁻⁴ 1 × 10⁻⁸]. The network input
size was set to 416 × 416 such that input images were all resized to 416 × 416, and nine anchors, which were
Scientific Reports | (2022) 12:261 | https://doi.org/10.1038/s41598-021-04247-y 9
Vol.:(0123456789)www.nature.com/scientificreports/
obtained by clustering the dimensions using K-means for each dataset, were used. Anchors that overlapped the
ground truth object by less than the IoU threshold value (0.5) were ignored. The non-maximum suppression
threshold value was set to 0.2, and the confidence score was selected as 0.5. More details can be found in the
Supplementary Information (Description of training detection algorithm).
The original training dataset is composed of 4397 WL polyp images. All images were added twice to include
one with a full monitor image and one that is cropped to involve only the endoscopic view. Additionally, we
composed augmentation training datasets with traditional geometric transformation methods and GAN. SSL
augmented images were added in 1200/1800/2400 to the original training dataset so that the proportion of SSL in
the dataset corresponded to the HP, the average of HP and AD, and AD. To compare the detection performance
according to the augmentation methods and augmented ratio of the minor type, we trained the polyp detec-
tion model using the same hyperparameters as the original and augmented datasets: (i) original model trained
without augmented images; (ii) T-aug1, T-aug2, and T-aug3 models trained with original + 1200/1800/2400
traditionally augmented SSL images; and (iii) GAN-aug1, GAN-aug2, and GAN-aug3 models trained with
original + 1200/1800/2400 synthetic SSL images generated by StyleGAN2. We evaluated these models using the
original validation dataset and SSL temporal validation dataset, including 130 SSL images with confidence score
and IoU thresholds both at 0.5.
Statistical analysis. In polyp images, the polyp detection box with an IoU higher than 0.5 was evaluated as
true-positive (TP) and that lower than 0.5 was evaluated as false-positive (FP). If the system could not detect the
polyp box in the polyp images, those images are evaluated as false-negative (FN). To evaluate the instances of a
true-negative (TN) result, we composed 1000 negative images with no polyp. Using the TP, FP, FN, and TN indi-
cators, we calculated the sensitivity (= recall), specificity, PPV (= precision), negative predictive value (NPV), AP,
F1-score, and the area under the receiver operating characteristic (AUROC).
Data avaliability
The datasets generated during and/or analyzed during the current study are available from the corresponding
author on reasonable request.
Received: 29 July 2021; Accepted: 20 December 2021
References
1. Arnold, M. et al. Global patterns and trends in colorectal cancer incidence and mortality. Gut 66, 683–691 (2017).
2. Loberg, M. et al. Long-term colorectal-cancer mortality after adenoma removal. N. Engl. J. Med. 28, 799–807 (2014).
3. Leggett, B. & Whitehall, V. Role of the serrated pathway in colorectal cancer pathogenesis. Gastroenterology 138, 2088–2100 (2010).
4. Kaminski, M. F. et al. Performance measures for lower gastrointestinal endoscopy: A European Society of Gastrointestinal Endos-
copy (ESGE) quality improvement initiative. Endoscopy 49, 378–397 (2017).
5. Hetzel, J. T. et al. Variation in the detection of serrated polyps in an average risk colorectal cancer screening cohort. Am. J. Gas‑
troenterol. 105, 2656–2664 (2010).
6. Kim, N. H. et al. Miss rate of colorectal neoplastic polyps and risk factors for missed polyps in consecutive colonoscopies. Intest.
Res. 15, 411–418 (2017).
7. Anderson, J. C., Butterly, L. F., Goodrich, M., Robinson, C. M. & Weiss, J. E. Differences in detection rates of adenomas and serrated
polyps in screening versus surveillance colonoscopies, based on the New Hampshire colonoscopy registry. Clin. Gastroenterol.
Hepatol. 11, 1308–1312 (2013).
8. van Rijn, J. C. et al. Polyp miss rate determined by tandem colonoscopy: A systematic review. Am. J. Gastroenterol. 101, 343–350
(2006).
9. Kaminski, M. F. et al. Increased rate of adenoma detection associates with reduced risk of colorectal cancer and death. Gastroen‑
terology 153, 98–105 (2017).
10. Kudo, S. et al. Artificial intelligence and colonoscopy: Current status and future perspectives. Dig. Endosc. 31, 363–371 (2019).
11. Wang, P. et al. Development and validation of a deep-learning algorithm for the detection of polyps during colonoscopy. Nat.
Biomed. Eng. 2, 741–748 (2018).
12. Qadir, H. A. et al. Improving automatic polyp detection using CNN by exploiting temporal dependency in colonoscopy video.
IEEE J. Biomed. Health Inform. 24, 180–193 (2020).
13. Karkanis, S. A., Iakovidis, D. K., Maroulis, D. E., Karras, D. A. & Tzivras, M. Computer-aided tumor detection in endoscopic video
using color wavelet features. IEEE Trans. Inf. Technol. Biomed. 7, 141–152 (2003).
14. Tajbakhsh, N., Gurudu, S. R. & Liang, J. Automated polyp detection in colonoscopy videos using shape and context information.
IEEE Trans. Med. Imaging 35, 630–644 (2016).
15. Hassan, C. et al. Performance of artificial intelligence for colonoscopy regarding adenoma and polyp detection: A meta-analysis.
Gastrointest. Endosc. 93, 77–85 (2021).
16. Wang, P. et al. Effect of a deep-learning computer-aided detection system on adenoma detection during colonoscopy (CADe-DB
trial): A double-blind randomized study. Lancet Gastroenterol. Hepatol. 5, 343–351 (2020).
17. Su, J. et al. Impact of a real-time automatic quality control system on colorectal polyp and adenoma detection: A prospective
randomized controlled study (with videos). Gastrointest. Endosc. 91, 415–424 (2020).
18. Abdeljawad, K. et al. Sessile serrated polyp prevalence determined by a colonoscopist with a high lesion detection rate and an
experienced pathologist. Gastrointest. Endosc. 81, 517–524 (2015).
19. Burgess, N. G., Tutticci, N. J., Pellise, M. & Bourke, M. J. Sessile serrated adenomas/polyps with cytologic dysplasia: A triple threat
for interval cancer. Gastrointest. Endosc. 80, 307–310 (2014).
20. Kaminski, M. F. et al. Quality indicators for colonoscopy and the risk of interval cancer. N. Engl. J. Med. 362, 1795–1803 (2010).
21. Pohl, H. et al. Incomplete polyp resection during colonoscopy-results of the complete adenoma resection (CARE) study. Gastro‑
enterology 144, 74–80 (2013).
22. Rashtak, S. et al. Sessile serrated polyps and colon cancer prevention. Cancer Prev. Res. 10, 270–278 (2017).
23. Limketkai, B. N., Lam-Himlin, D., Arnold, M. A. & Arnold, C. A. The cutting edge of serrated polyps: A practical guide to approach-
ing and managing serrated colon polyps. Gastrointest. Endosc. 77, 360–375 (2013).
24. Fan, C. et al. Management of serrated polyps of the colon. Curr. Treat Options Gastroenterol. 16, 182–202 (2018).
Scientific Reports | (2022) 12:261 | https://doi.org/10.1038/s41598-021-04247-y 10
Vol:.(1234567890)www.nature.com/scientificreports/
25. Lee, J. et al. Impact of comprehensive optical diagnosis training using Workgroup serrAted polypS and Polyposis classification on
detection of adenoma and sessile serrated lesion. Dig. Endosc. Epub ahead of print (2021). https://doi.org/10.1111/den.14046
26. Hassan, C. et al. Artificial intelligence for non-polypoid colorectal neoplasms. Dig. Endosc. 33, 285–289 (2021).
27. Johnson, J. M. & Khoshgoftaar, T. M. Survey on deep learning with class imbalance. J. Big Data 6, 1–54 (2019).
28. Turner, K. O., Genta, R. M. & Sonnenberg, A. Lesions of all types exist in colon polyps of all sizes. Am. J. Gastroenterol. 113, 303–306
(2018).
29. IJspeert, J. E. G. et al. Prevalence, distribution and risk of sessile serrated adenomas/polyps at a center with a high adenoma detec-
tion rate and experience pathologists. Endoscopy 48, 740–746 (2016).
30. Leevy, J. L. et al. A survey on addressing high-class imbalance in big data. J. Big Data 5, 1–30 (2018).
31. Shin, Y., Qadir, H. A., Aabakken, L., Bergsland, J. & Balasingham, I. Automatic colon polyp detection using region based deep
CNN and post learning approaches. IEEE Access. 6, 40950–40962 (2018).
32. Gibson, E. et al. NiftyNet: A deep-learning platform for medical imaging. Comput. Methods Prog. Biomed. 158, 113–122 (2018).
33. Frid-Adar, M. et al. GAN-based synthetic medical image augmentation for increased CNN performance in liver lesion classifica-
tion. Neurocomputing 321, 321–331 (2018).
34. Wang, Q. et al. WGAN-based synthetic minority over-sampling technique: Improving semantic fine-grained classification for lung
nodules in CT images. IEEE Access 7, 18450–18463 (2019).
35. Alnujaim, I. & Kim, Y. Augmentation of Doppler radar data using generative adversarial network for human motion analysis.
Health Inform. Res. 25, 344 (2019).
36. Choi, J. et al. Convolutional neural network technology in endoscopy in endoscopic imaging: Artificial intelligence for endoscopy.
Clin. Endosc. 53, 117–126 (2020).
37. Kanayama, T. et al. Gastric cancer detection from endoscopic images using synthesis by GAN. In Conf. MICCAI, 530–538 (2019).
38. Shin, Y. H., Qadir, H. A. & Balasingham, I. Abnormal colon polyp image synthesis using conditional adversarial networks for
improved detection performance. IEEE Access 6, 56007–56017 (2018).
39. Bernal, J. et al. Comparative validation of polyp detection methods in video colonoscopy: Results from the MICCAI 2015 endo-
scopic vision challenge. IEEE Trans. Med. Imaging 36, 1231–1249 (2017).
40. Lee, J. Y. et al. Real-time detection of colon polyps during colonoscopy using deep learning: Systematic validation with four inde-
pendent datasets. Sci. Rep. 10, 8379 (2020).
41. Silva, J. et al. Toward embedded detection of polyps in WCE images for early diagnosis of colorectal cancer. Int. J. Comput. Assist.
Radiol. Surg. 9, 283–293 (2014).
42. Bernal, J. et al. WM-DOVA maps for accurate polyp highlighting in colonoscopy: Validation vs. saliency maps from physicians.
Comput. Med. Imaging Graph 43, 99–111 (2015).
43. Mahmood, F., Chen, R. & Durr, N. J. Unsupervised reverse domain adaptation for synthetic medical images via adversarial train-
ing. IEEE Trans. Med. Imaging 37, 2572–2581 (2018).
44. Mathew, S., Nadeem, S., Kumari, S. & Kaufman, A. Augmenting colonoscopy using extended and directional CycleGAN for lossy
image translation. In Proc. IEEE/CVF Conf. Comput. Vis. Pattern Recog. (CVPR), 4696–4705 (2020).
45. Patel, K. & Hoffman, N. E. The anatomical distribution of colorectal polyps at colonoscopy. J. Clin. Gastroenterol. 33, 222–225
(2001).
46. Cerilli, L. A. & Greenson, J. K. The differential diagnosis of colitis in endoscopic biopsy specimens: A review article. Arch. Pathol.
Lab. Med. 136, 854–864 (2012).
47. Rossini, F. P. The normal colon in Atlas of colonoscopy (ed Rossini, F. P.) 46-55 https://doi.org/10.1007/978-1-4615-9650-9_12/
(Springer, 1975).
48. Goodfellow, I. NIPS 2016 tutorial: generative adversarial networks. Preprint at https://arxiv.org/abs/1701.00160 (2016).
49. Bowles, C. et al. GAN augmentation: augmenting training data using generative adversarial networks. Preprint at arXiv:1810.
10863 (2018).
50. Richardson, E. & Weiss, Y. On GANs and GMMs. In Proc. Neural Information Processing Systems (NIPS), 5852-5863 (2018).
51. Zhou, G. et al. Computer aided detection for laterally spreading tumors and sessile serrated adenomas during colonoscopy. PLoS
ONE 15, e0231880 (2020).
52. Liu, X. et al. Self-attention negative feedback network for real-time image super-resolution. J. King Saud. Univ. Comput. Inf. Sci.
Published online July 29 (2021). https://doi.org/10.1016/j.jksuci.2021.07.014
53. Woźniak, M., Siłka, J. & Wieczorek, M. Deep neural network correlation learning mechanism for CT brain tumor detection. Neural
Comput. Appl. Published online March 16 (2021). https://doi.org/10.1007/s00521-021-05841-x
54. Bae, J. H. et al. Improved real-time optical diagnosis of colorectal polyps following a comprehensive training program. Clin.
Gastroenterol. Hepatol. 17, 2479–2488 (2019).
55. Karras, T. et al. Analyzing and improving the image quality of stylegan. In Proc. IEEE/CVF Conf. Comput. Vis. Pattern Recog.
(CVPR), 8110–8119 (2020).
56. Wu, X. et al. Urine red blood cells generation using StyleGAN2 network. In Conf. CAIH, 244–248 (2020).
57. Heusel, M. et al. GANs trained by a two time-scale update rule converge to a local Nash equilibrium. In Proc. Neural Information
Processing Systems (NIPS), 6626-6637 (2017).
58. Kang, H., Park, J. S., Cho, K. & Kang, D. Y. Visual and quantitative evaluation of amyloid brain PET image synthesis with generative
adversarial network. Appl. Sci. 10, 2628 (2020).
59. Ganesan, P. et al. Assessment of data augmentation strategies toward performance improvement of abnormality classification in
chest radiographs. In Conf. IEEE EMBC, 841-844 (2019).
60. van der Maaten, L. & Hinton, G. Visualizing data using T-SNE. J. Mach. Learn. Res. 9, 2579–2605 (2008).
61. Han, C. et al. Synthesizing diverse lung nodules wherever massively: 3D multi-conditional GAN-based CT image augmentation
for object detection. In Conf. 3DV, 729–737 (2019).
62. Rajaraman, S. et al. Visualization and interpretation of convolutional neural network predictions in detecting pneumonia in
pediatric chest radiographs. Appl. Sci. 8, 1715 (2018).
63. Jang, J.-H. et al. Effectiveness of transfer learning for deep learning-based electrocardiogram analysis. Health Inform. Res. 27, 19–28
(2021).
64. Redmon, J & Farhadi, A. YOLOv3: an incremental improvement, Preprint at arXiv:1804.02767 (2018).
Acknowledgements
This work was supported by the Ministry of Science and ICT (MSIT), Korea, under the Information Technology
Research Center (ITRC) support program (IITP-2021-2018-0-01833) supervised by the Institute for Information
& Communications Technology Planning & Evaluation (IITP).
Author contributions
D.Y. and H.-J.K. made equal contributions to the design of the study, experiments, data analysis, and draft of the
manuscript. D.Y., B.S.K., and W.S.C. performed research and experiments. J.C.L. helped draft the manuscript.
Scientific Reports | (2022) 12:261 | https://doi.org/10.1038/s41598-021-04247-y 11
Vol.:(0123456789)You can also read