RAZER INC. INVESTOR PRESENTATION | 1H2021 EARNINGS - Investor Relations
←
→
Page content transcription
If your browser does not render page correctly, please read the page content below

RAZER INC. INVESTOR PRESENTATION | 1H2021 EARNINGS
AGENDA
   1          1H2021 HIGHLIGHTS

            Min-Liang Tan – Co-founder and CEO

   2          1H2021 RAZER FINTECH

            Limeng Lee – CSO

  3           1H2021 FINANCIAL PERFORMANCE

             Chong Neng Tan – CFO

  4           #GoGreenWithRazer

            Min-Liang Tan – Co-founder and CEO

  5           FY2021 OUTLOOK

            Min-Liang Tan – Co-founder and CEO

© 2021 RAZER INC. ALL RIGHTS RESERVED.           2
LEGAL DISCLAIMER
          Potential investors and shareholders (the “Potential Investors and Shareholders”) of Razer Inc. (the “Company”) are reminded that information contained in
          this Presentation comprises extracts of operational data and financial information of the Company and its subsidiaries (the “Group”) for the six months ended
          30 June 2021 (“1H2021”).

          The information included is solely for the use in this Presentation and certain information has not been independently verified. This Presentation has been
          prepared for informational use only and has not been prepared for the sale or solicitation in securities of the Company. No representations or warranties,
          expressed or implied, are made as to, and no reliance should be placed on, the fairness, accuracy, completeness or correctness of the information or opinions
          presented or contained in this Presentation. Potential Investors and Shareholders should refer to the 1H2021 results announcement for the results of the
          Company which are published in accordance with the Rules Governing the Listing of Securities on The Stock Exchange of Hong Kong Limited.

          The performance and the results of operations of the Group contained within this Presentation are historical in nature, and past performance is no guarantee
          of the future results of the Group. Any forward-looking statements and opinions contained within this Presentation are based on current assumptions, plans,
          estimates and projections, which are subject to change and which involve risks and uncertainties. Actual results may differ materially from expectations
          discussed in such forward-looking statements and opinions. The Group, the directors, employees and agents of the Group assume (a) no obligation to correct
          or update the forward-looking statements or opinions contained in this Presentation; and (b) no liability in the event that any of the forward-looking
          statements or opinions do not materialize or turn out to be incorrect.

          Potential Investors and Shareholders should exercise caution when investing in or dealing in the securities of the Company.

          While no price-sensitive information has been included in this Presentation, Potential Investors and Shareholders are reminded not to deal, or cause a third
          party to deal, in any securities of the Company if they are in possession of such information.

© 2021 RAZER INC. ALL RIGHTS RESERVED.                                                                                                                                    3
1H2021 HIGHLIGHTS

© 2021 RAZER INC. ALL RIGHTS RESERVED.                       4

1H2021: KEY HIGHLIGHTS
          Record high revenue of US$752.0M with 68.0% YoY growth, driven by robust demand,
          market share leadership for the Hardware business, and ongoing growth in the Services
          segment

          Gross profit margin improved to 27.1%, as compared to 22.0% for the same period in 2020,
          primarily due to improving margins in the Hardware segment

          Adjusted EBITDA Profit of US$59.5M, with 1,759.4% year-on-year growth from US$3.2M for
          the same period last year

          Net Profit of US$31.3M, as compared to a Net Loss of US$17.7M for the same period in 2020,
          driven by exceptional revenue growth, gross margin expansion, and productivity improvement

© 2021 RAZER INC. ALL RIGHTS RESERVED.                                                                 5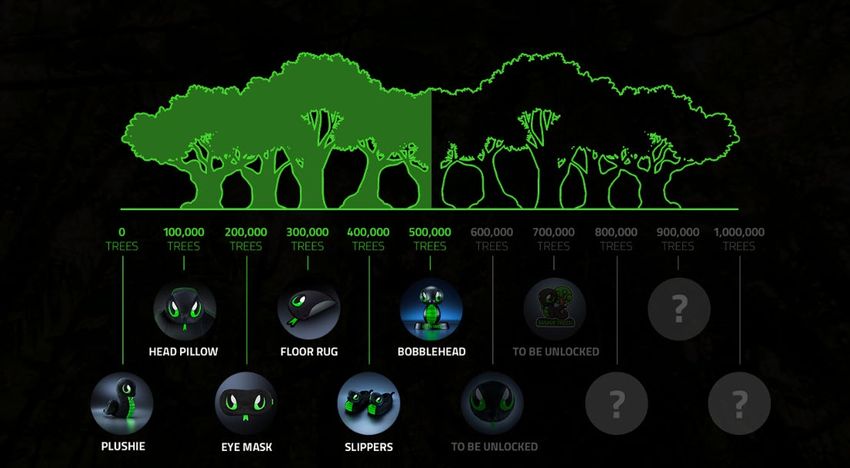
RECORD HIGH REVENUE

                                           NET REVENUE

                                          CAGR
          (US$ M)

                                         +40.0%

© 2021 RAZER INC. ALL RIGHTS RESERVED.                   6
SIGNIFICANT INCREASE IN NET PROFIT

                                         PROFIT / (LOSS) FOR THE PERIOD

          (US$ M)

© 2021 RAZER INC. ALL RIGHTS RESERVED.                                    7
THE RAZER ECOSYSTEM:
                       AND HOW IT GREW IN 1H2021

© 2021 RAZER INC. ALL RIGHTS RESERVED.             8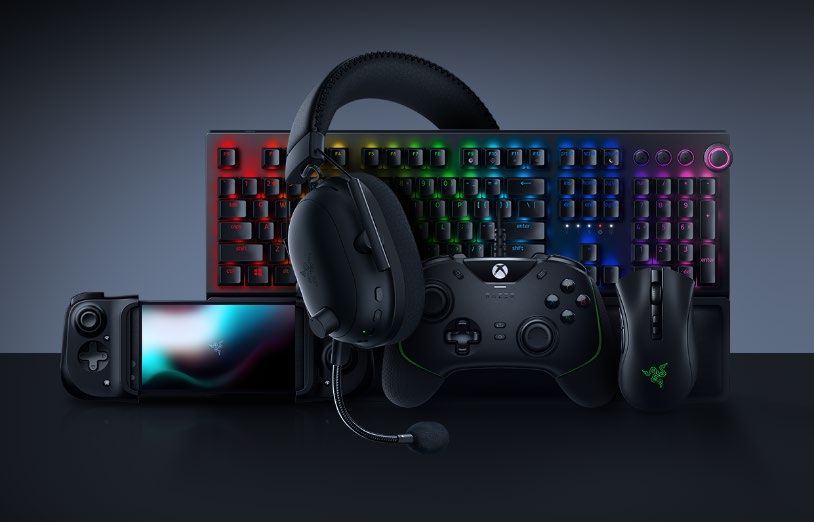
THE WORLD’S LARGEST INTEGRATED GAMER ECOSYSTEM
                   ONE OF THE WORLD’S LARGEST
                   GAMER SOFTWARE PLATFORMS           ~150M  TOTAL
                                                             USERS
                   Enhance user experience via access
                   to integrated gamer platform        50.0% YoY
                                                             GROWTH

                   GLOBAL LEADER IN                        PAYMENT SERVICES FOR GAMERS,
                   GAMING HARDWARE                         YOUTH, MILLENNIALS AND GEN Z

      Global Market Leader in Gaming             Monetization for games and digital payments
      Peripherals and Premium Gaming             enablement
      Laptops

      US$677.3M                                  US$72.8M
       IN 1H2021                                 IN 1H2021

      77.0% YoY
            GROWTH                               13.8% YoY
                                                       GROWTH

© 2021 RAZER INC. ALL RIGHTS RESERVED.                                                         9
THE RAZER ECOSYSTEM:
                                              HARDWARE

© 2021 RAZER INC. ALL RIGHTS RESERVED.                          10
EXPONENTIAL REVENUE GROWTH FOR HARDWARE
NET REVENUE
+77.0%
(US$ M)
YoY
© 2021 RAZER INC. ALL RIGHTS RESERVED. 11THE RAZER ECOSYSTEM:
SOFTWARE
© 2021 RAZER INC. ALL RIGHTS RESERVED. 12ACCELERATION IN USER BASE EXPANSION
BOOSTED BY INCREASED GAMING, ESPORTS AND LIVESTREAMING ACTIVITIES
TOTAL USERS
+50.0%
YoY ~150M MAU
~123M +51.4%
YoY
~100M
1H2021
~80M
Dec 19 Jun 20 Dec 20 Jun 21
© 2021 RAZER INC. ALL RIGHTS RESERVED. 13COMPREHENSIVE FIRST PARTY GAMER PROFILE DATA
ACROSS DIFFERENT GAMES
PURCHASE DEMOGRAPHICS
HISTORY (AGE, GENDER)
GAME PURCHASE GEOLOCATION
PROPENSITY
RAZER ID
PREFERRED
GAME TITLES PLATFORMS & GAME
SOURCES
GAME GENRES HARDWARE OWNERSHIP
& POPULARITY & PURCHASE BEHAVIOR
HOURS PLAYED
BY GAME LINKED DEVICES
© 2021 RAZER INC. ALL RIGHTS RESERVED. 14THE RAZER ECOSYSTEM:
SERVICES
© 2021 RAZER INC. ALL RIGHTS RESERVED. 15SERVICES
PAYMENT SERVICES FOR GAMERS, YOUTH, MILLENNIALS AND GEN Z
GLOBAL GAME PAYMENT SERVICE EMERGING MARKETS FINTECH
© 2021 RAZER INC. ALL RIGHTS RESERVED. 16STRONG GROWTH OF SERVICES BUSINESS
DRIVEN BY GROWTH IN RAZER GOLD USAGE AND RAZER FINTECH B2B ACTIVITY
SERVICES NET REVENUE
+13.8%
(US$ M)
GPM
YoY
41.9%
1H2021
© 2021 RAZER INC. ALL RIGHTS RESERVED. 171H2021 RAZER GOLD © 2021 RAZER INC. ALL RIGHTS RESERVED. 18
RAZER GOLD BUSINESS MODEL

                                                                         CONTENT PARTNERS
                         USER                  RAZER GOLD
            •   User purchases Razer       •   User spends Razer Gold   Razer Gold:
                Gold via online/ offline       in game / digital        • Retains take rate (revenue) and pays cost
                channels                       entertainment               of payment channels (COGs) i.e. credit card
                                                                           fees, offline channel fees
                                                                        • Pays out remainder to content partners

© 2021 RAZER INC. ALL RIGHTS RESERVED.                                                                                   19
RAZER GOLD: THE ONLY UNIVERSAL GAME CREDIT IN THE WORLD
CHANNELS
Channel Support Marketing Support Big Data Analytics
5.6 million end user channels
Access to Razer’s Social media channels Sharpen targeting accuracy
150+ MILLION
worldwide Online and retail advertising Boost activity
Complete online and offline RazerStores Cultivate engagement
payment coverage Userbase Razer Central Push notifications
Transact in 20 local currencies Influencer marketing
EDM
CONTENT
Single virtual credit with access to
42,000+ digital content Exclusive
Razer-branded
in game items &
Razer products Razer Silver loyalty
giveaways rewards program
TPV GREW BY 13.8% YoY IN 1H2021
© 2021 RAZER INC. ALL RIGHTS RESERVED. 201H2021 RAZER FINTECH © 2021 RAZER INC. ALL RIGHTS RESERVED. 21
RAZER FINTECH IS THE LEADING B2B DIGITAL PAYMENT
          PROVIDER IN SOUTHEAST ASIA
                     Blue-Chip Merchant Base                                                  Extensive Payment Options

                                                           Online Payment Gateway
                                                         Cash, Internet Banking, Card,
                                                            E-wallet Enablement

                                                                Reloads Platform
                                                      Digital Pins, Bill Payments, E-wallet
                                                       Acceptance for Offline Merchants

                Powering payments for over 60,000       Supporting marketplaces and           Single and easy integration that
                  merchants with over 1 million     e-commerce sites with innovative and      connects payment channels to
                       offline touchpoints              alternative payment options              over 110 payment options
© 2021 RAZER INC. ALL RIGHTS RESERVED.                                                                                           22
RAZER FINTECH BUSINESS MODEL
USERS ACQUIRING BANKS, GLOBAL
SCHEMES & E-WALLETS
User makes online purchase
Online Payments Transaction
ONLINE MERCHANTS processing
Razer processes the Payments made to
payment and pays out Payment gateway providing Cash, Internet Razer Fintech less
to merchants and Banking, Card, E-wallet enablement channel cost
retains take rate
USERS TELCOS, DIGITAL CONTENT
PROVIDERS & BILLERS
User makes reload at retail point
Offline Payments
OFFLINE MERCHANTS
Merchants integrated Razer Fintech
with Razer platform Widest portfolio of Mobile Reloads, acquires content
can pull the content Billers, Games and Entertainment and from digital
inventory at a margin Productivity Tools content content providers
* Razer Fintech is a leading business-to-business payment solution provider that focuses on powering offline-to-online payments for blue-chip merchants
© 2021 RAZER INC. ALL RIGHTS RESERVED. 23ROBUST GROWTH CONTINUED IN 1H2021
DRIVEN BY NEW MERCHANTS ONBOARDING AND SURGES IN ONLINE SHOPPING
RAZER FINTECH TPV
+79.5%
(US$ M)
YoY 3,191
1,774
828
1H2019 1H2020 1H2021
© 2021 RAZER INC. ALL RIGHTS RESERVED. 24SIGNIFICANT PROGRESS IN 1H2021
79.5% YoY growth to 88.6% YoY growth to Strengthened
TPV US$3.2B in 1H2021 over 60,000 merchants core infrastructure
driven mainly by e-commerce coming from the retail, expanded business footprint and
marketplace purchases, food F&B industries, and secured additional licenses across SEA
deliveries and e-wallet top-ups professional/commercial services
© 2021 RAZER INC. ALL RIGHTS RESERVED. 25MASSIVE DIGITAL PAYMENTS GROWTH IN SEA
FUELED BY THE PROPELLING INTERNET ECONOMY
INTERNET ECONOMY (GROSS MERCHANDISE VALUE) DIGITAL PAYMENTS (GROSS TRANSACTION VALUE)
(US$ BN) (US$ BN)
194% +94%
309
35
1,200
60
42
105
17
172
620
14
11
62
2020 2025F 2020 2025F
e-Commerce Transport & Food Online Travel Online Media
Source: Google-Temasek eConomy SEA 2020
© 2021 RAZER INC. ALL RIGHTS RESERVED. 261H2021
FINANCIAL PERFORMANCE
© 2021 RAZER INC. ALL RIGHTS RESERVED. 27NET REVENUE
RECORD HIGH REVENUE DRIVEN BY MARKET SHARE LEADERSHIP ACROSS THE REGIONS
REVENUE BY SEGMENT
+68.0%
(US$ M)
YoY
* Hardware includes Peripherals and Systems
© 2021 RAZER INC. ALL RIGHTS RESERVED. 28GROSS PROFIT
GROSS PROFIT DOLLAR MORE THAN DOUBLED
GROSS PROFIT
(US$ M)
GPM
27.1%
GPM
GPM 22.0%
21.2%
1H2021 GPM improvement:
• Driven by increased contribution of the higher margin Hardware products
• Robust operation structure negated logistics cost risks
© 2021 RAZER INC. ALL RIGHTS RESERVED. 29OPERATING EXPENSES
OPEX AS % OF NET REVENUE IMPROVED BY 400BPS
OPERATING EXPENSES
(US$ M)
© 2021 RAZER INC. ALL RIGHTS RESERVED. 30SIGNIFICANT INCREASE IN NET PROFIT
BEAT EXPECTATIONS ON EXCEPTIONAL REVENUE GROWTH AND PROFITABILITY
(US$ M) 1H2020 1H2021 Change
• Revenue +68.0% to US$752.0M, driven by
Revenue 447.5 752.0 68.0% robust demand, market share leadership for
Gross profit 98.5 203.6 106.7% the Hardware business, and ongoing growth
in the Services segment
% of revenue 22.0% 27.1% 510bps
Operating expenses 115.5 163.6 41.7% • Gross profit margin increased 510 bps to
% of revenue 25.8% 21.8% (400bps) 27.1% driven by improving margins in
Hardware
Adjusted EBITDA* 3.2 59.5 1,759.4%
• Net profit of US$31.3M, driven by exceptional
% of revenue 0.7% 7.9% 720bps
revenue growth, gross margin expansion, and
Profit / (loss) for the period (17.7) 31.3 N.A productivity improvement. Net profit margin
% of revenue -3.9% 4.2% 810bps improved 810 bps to 4.2%
*Adjusted EBITDA as profit / (loss) from operations added back with depreciation and amortisation, share-based compensation expense, restructuring expense, and merger and acquisitions expense.
© 2021 RAZER INC. ALL RIGHTS RESERVED. 31WORKING CAPITAL AND CASH CONVERSION CYCLE
BEST IN CLASS WORKING CAPITAL MANAGEMENT
WORKING CAPITAL CYCLE
(Days)
DAYS INVENTORY OUTSTANDING1 DAYS SALES OUTSTANDING2
69 71
45 44 50 49
Jun-19 Jun-20 Jun-21 Jun-19 Jun-20 Jun-21
DAYS PAYABLES OUTSTANDING3 CASH CONVERSION CYCLE4
187
166 166
(52)
(72) (67)
Jun-19 Jun-20 Jun-21 Jun-19 Jun-20 Jun-21
Notes: 1 Days inventory outstanding equals the average of the opening and closing inventory balances divided by the cost of sales for the period and multiplied by the number of days in the period.
2 Days sales outstanding equals the average of trade receivables divided by the total revenue for the period and multiplied by the number of days in the period.
3 Days payables outstanding equals the average of payables divided by the total cost of sales for the period and multiplied by the number of days in the period.
4 Cash conversion cycle for a period equals days inventory outstanding plus days sales outstanding less days payables outstanding.
© 2021 RAZER INC. ALL RIGHTS RESERVED. 32UPDATES ON
GOJULYGREEN
6, 2021
WITH RAZER
OUR QUEST CONTINUES TO BUILD
A SUSTAINABLE FUTURE FOR
GENERATIONS TO COME
© 2021 RAZER INC. ALL RIGHTS RESERVED. 3310-YEAR ROADMAP TOWARDS SUSTAINABILITY
FY2021 FY2025 FY2030
GREEN ORGANIZATION GREEN ORGANIZATION GREEN ORGANIZATION
SAY NO TO 100% POWERED 100% CARBON NEUTRAL
SINGLE-USE PLASTICS BY RENEWABLE ENERGY
GREEN PRODUCTS GREEN PRODUCTS GREEN PRODUCTS
GREEN PACKAGING 100% PRODUCTS ARE MADE OF 100% RECYCLED
RECYCLABLE WITH RAZER & RECYCLABLE MATERIALS
© 2021 RAZER INC. ALL RIGHTS RESERVED. 3410-YEAR GREEN ROADMAP
INITIATIVES ACROSS FOUR STRATEGIC PILLARS
TO REALIZE RAZER’S GREEN VISION UNTIL 2030:
GREEN GREEN GREEN GREEN
ORGANIZATION PRODUCTS COMMUNITY INVESTMENTS
Change starts from within. Turning our forte in designing Harnessing the collective power of Develop an environment and
Focus on making our offices a products that are both our staff and the community to sustainability business vertical with a
greener place and our staff phenomenal to our fans and contribute and support the global focus on the youth, millennials and
greener people to reduce our responsible to the environment green movement Gen Z and aims to play its part by
global carbon footprint supporting and investing in
environment and sustainability
startups
© 2021 RAZER INC. ALL RIGHTS RESERVED. 35‘Green’ gear to inspire Limited-edition apparel line
greener lifestyle amongst global made from 100% recycled marine
gaming community plastic
© 2021 RAZER INC. ALL RIGHTS RESERVED. 36GREEN
O V E R COMMUNITY
500,000 TREES
HAVE BEEN SAVED
© 2021 RAZER INC. ALL RIGHTS RESERVED. 37INVEST FOR GROWTH © 2021 RAZER INC. ALL RIGHTS RESERVED. 38
THE OPPORTUNITY

          THE LARGE AND GROWING GAMER AND YOUTH TAM

         US$219B
         GLOBAL GAMES MARKET
                                                                                          ~3B
                                                                                      ACTIVE GAMERS IN 2021
                                                                                                                                                                      577M
                                                                                                                                                         GLOBAL ESPORTS AUDIENCE IN 2024
         REVENUE IN 2024

          GAMERS = YOUTH AND MILLENNIALS

         71%                                                                        17B HRS
                                                                                    OF TWITCH CONTENT WAS
                                                                                                                                                                      90%
         OF MILLENNIALS ARE                                                                                                                                      WILL PREFER TO PURCHASE
         GAMERS                                                                     CONSUMED IN 2020 & YT HAS                                                    FROM AUTHENTIC BRANDS
                                                                                    200M+ DAILY GAMING USERS                                                       THAT SPEAK TO THEM

          Source: Newzoo, DFC Intelligence, Stackla, App Annie Market Research , Google Growth in the Video Gaming Ecosystem: The new role of games as media (2020)

© 2021 RAZER INC. ALL RIGHTS RESERVED.                                                                                                                                                     39
RAZER ECOSYSTEM: HARDWARE
Achievements:
• Market leading position for gaming Peripherals across the U.S., Europe, and
Asia-Pacific
• Market leading position in the premium gaming laptop segment in the U.S.,
while growing market share in new markets outside of the U.S.
• Further expanded into new growth categories such as console gaming and
gaming chairs
Investment Areas:
• Investments in R&D for existing gaming Peripherals categories
• Continued mid-term category expansion in new growth categories such as
console gaming and gaming chairs
• Expanding into new Hardware categories
© 2021 RAZER INC. ALL RIGHTS RESERVED. 40RAZER ECOSYSTEM: SOFTWARE
Achievements:
• One of the largest integrated gamer software platforms in the world
• 55.4% 3-year CAGR growth in total user accounts to ~150M
RAZER SYNAPSE • 37.0% 3-year CAGR growth in MAU
IOT PLATFORM
Investment Areas:
• Develop new software to increase user acquisition, engagement and
retention
• Explore new monetization initiatives
RAZER CHROMA ™ RGB
UNIVERSAL RGB LIGHTING SYSTEM
• Deepen big data analytics capabilities to drive user acquisition and
nurture user activity
RAZER CORTEX
GAME LAUNCHER
© 2021 RAZER INC. ALL RIGHTS RESERVED. 41RAZER ECOSYSTEM: RAZER GOLD
Achievements:
• Unique global position as a universal game credit across thousands of games
• 47.0% CAGR in TPV since inception in 2017
• 175.9% CAGR in content partner adoption since inception in 2017
• 77.6% CAGR in channel acceptance since inception in 2017
Investment Areas:
• Expand into new regions internationally
• Deepen penetration in high growth regions such as LATAM, Middle East and
SEA
• Enhance core infrastructure and recruit talent to improve user experience,
acquire new users and drive usage/ spending per user
© 2021 RAZER INC. ALL RIGHTS RESERVED. 42RAZER ECOSYSTEM: RAZER FINTECH
Achievements:
• The leading B2B digital payments facilitator in SEA
• 63.7% CAGR in TPV since inception in 2018 with 1H2021 TPV at US$3.2B
• 157.4% CAGR in merchant adoption since inception in 2018
Investment Areas:
• Continued geographical expansion across SEA
• Scale TPV aggressively with expanded merchant base
• Enhance service capabilities for existing customers
• M&A and investments
© 2021 RAZER INC. ALL RIGHTS RESERVED. 43OUTLOOK © 2021 RAZER INC. ALL RIGHTS RESERVED. 44
FY2021 OUTLOOK: ON TRACK TO DELIVER GROWTH,
          OPERATIONAL ENHANCEMENTS AND AMP UP INVESTMENT
                                         Strong Revenue Growth:
                                         • New Hardware product introductions
                                         • Growth of Software user base
                                         • Continue scaling Services business

                                         Continue Operational Enhancements:
                                         • Track record of cost discipline
                                         • Improvement of Hardware margins
                                         • Expansion of higher-margin Hardware and Services as part of the revenue mix

                                         Amp Up Investment For Growth:
                                         • Reinvesting profits in high potential areas such as Razer Gold and Razer Fintech
                                         • Such investments will involve additional spending in operating expenses as we scale our
                                           Services business
                                         • Step-up investments in new growth opportunities in the Razer ecosystem

© 2021 RAZER INC. ALL RIGHTS RESERVED.                                                                                               45
Q&A © 2021 RAZER INC. ALL RIGHTS RESERVED. 46
APPENDIX

© 2021 RAZER INC. ALL RIGHTS RESERVED.              47
KEY P&L DATA
           US$ M                                                       FY2018                    FY2019                    FY2020                                 1H2020    1H2021

           Revenue                                                       712.4                    820.8                    1,214.6                                447.5     752.0

           Gross Profit                                                  170.1                     168.1                     271.0                                 98.5     203.6

           Operating Expenses                                           (269.7)                   (263.9)                   (278.0)                               (115.5)   (163.6)

           Profit / (Loss) for the period                                (97.9)                    (83.5)                      0.8                                 (17.7)    31.3

           Adjusted EBITDA*                                              (46.9)                    (29.4)                     44.6                                 3.2       59.5

            *Adjusted items exclude share-based compensation, restructuring expense, merger and acquisition expense and impairment of goodwill and other assets

© 2021 RAZER INC. ALL RIGHTS RESERVED.                                                                                                                                                48
KEY BALANCE SHEET DATA
US$ M Dec 2018 Dec 2019 Dec 2020 Jun 2020 Jun 2021
Cash and bank balance 615.2 528.3 621.8 585.9 517.0
Debts 0.0 0.0 0.0 0.0 0.0
Net Cash 615.2 528.3 621.8 585.9 517.0
Inventories 68.5 74.8 124.9 94.9 178.7
Trade Receivables 144.9 158.4 223.4 191.7 182.9
Trade Payables 269.6 301.3 469.8 420.3 517.5
Net Working Capital (56.2) (68.1) (121.5) (133.8) (155.9)
© 2021 RAZER INC. ALL RIGHTS RESERVED. 49You can also read