Genie Energy Ltd Investor Presentation - (NYSE: GNE) - Public Technologies
←
→
Page content transcription
If your browser does not render page correctly, please read the page content below

Genie Energy Ltd
       (NYSE: GNE)

  Investor Presentation
         March 2022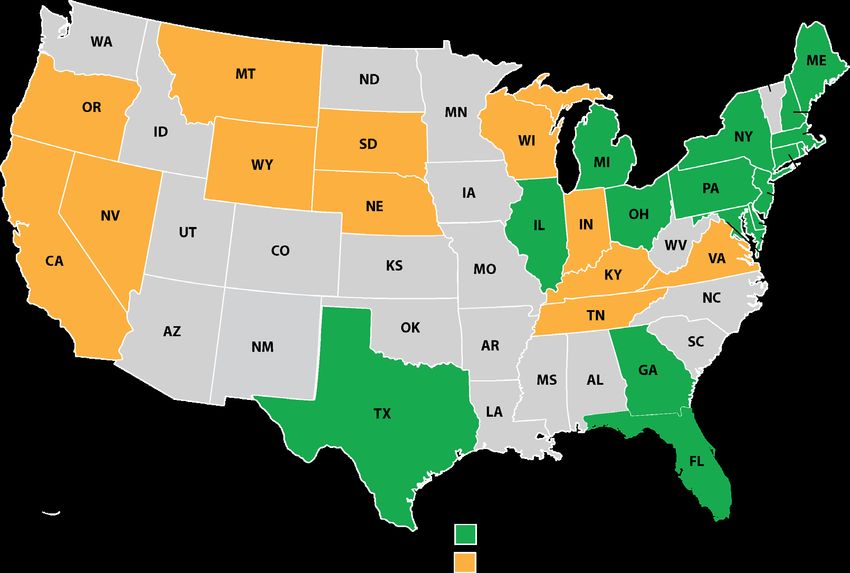
Safe Harbor Statement
This presentation contains forward-looking statements. Statements that are not historical facts are forward-looking statements
and such forward-looking statements are statements made pursuant to the Safe Harbor Provisions of the Private Securities
Litigation Reform Act of 1995. Examples of forward-looking statements include:
        •   statements about Genie’s and its divisions’ future performance;
        •   projections of Genie’s and its divisions’ results of operations or financial condition; and
        •   statements regarding Genie’s plans, objectives or goals, including those relating to its strategies, initiatives,
            competition, acquisitions, dispositions and/or its products and offerings.
Words such as "believe," "anticipate," "plan," "expect," "intend," "target," "estimate," "project," "predict," "forecast," "guideline,"
"aim," "will," "should," “likely,” "continue" and similar expressions are intended to identify forward-looking statements but are
not the exclusive means of identifying such statements. Readers are cautioned not to place undue reliance on these forward-
looking statements and all such forward-looking statements are qualified in their entirety by reference to the following
cautionary statements.
Forward-looking statements are based on Genie’s current expectations, estimates and assumptions and because forward-
looking statements address future results, events and conditions, they, by their very nature, involve inherent risks and
uncertainties, many of which are unforeseeable and beyond the Genie’s control. Such known and unknown risks, uncertainties
and other factors may cause Genie’s actual results, performance or other achievements to differ materially from the anticipated
results, performance or achievements expressed, projected or implied by these forward-looking statements.
These factors include those discussed under the headings "Risk Factors" and “Management’s Discussion and Analysis of
Financial Condition and Results of Operations in Genie’s periodic filings made with the Securities and Exchange Commission.
Genie cautions that such factors are not exhaustive and that other risks and uncertainties may cause actual results to differ
materially from those in forward-looking statements.
Forward-looking statements speak only as of the date they are made and are statements of Genie’s current expectations
concerning future results, events and conditions and Genie is under no obligation to update any of the forward-looking
statements, whether as a result of new information, future events or otherwise.
                                                                                                                                          2
The Foundation
             Largest shareholder group has a consistent track record of building
                   businesses & creating significant value for shareholders
                      Company                     Market Value         Most Recent
                                                   @9/14/09            Market Value*
            Genie Energy (NYSE: GNE)             10/28/11 (Spin-off)       $179M

                 IDT Corp (NYSE: IDT)                   $53M                $868M

          IDW Media (NYSE American: IDW)          9/14/09 (Spin-off)        $28M

     Straight Path Communications (NYSE: STRP)    7/31/13 (Spin-off)       $2,164M
                                                                       (sold to VZ 2/18)
              Rafael Holdings (NYSE: RFL)         3/26/18 (Spin-off)        $50M

            Zedge (NYSE American: ZDGE)            6/1/16 (Spin-off)        $89M

                         Total                         $53M              $3,378M
                                                                                           3
* Based on Yahoo market value as of 3/17/22
Genie Energy Highlights

       HQ                                            Newark, NJ                           Fiscal 2021 Pro-forma *

       Key Management and Board Members:
       CEO                       Michael Stein
                                                                                     $360M 32.5%
                                                                                          Revenue                    GM
       CFO                       Avi Goldin

                                                                                                    $51M
       Chairman                  Howard Jonas
       Lead Independent Dir.     Wesley Perry
                                                                                                    Adj. EBITDA
       Employees                                     ~150
       Tickers (NYSE)                                GNE, GNEPRA                                    ~4.4%
                                                                                                    Dividend Yield
                                                                                                      (3/17/22)
                                                                                                                          4
* Pro-forma excl. impact of Texas Winter Storm Uri, UK, Japan, & GOGAS operations as of
12/31/21. Please see reconciliations in Appendix
Genie Energy Operating Structure
 Genie is a leading retail energy provider (REP) to select deregulated
markets within the US & Scandinavia & provides solar solutions in the US

                               Genie Energy Ltd.
                                       NYSE:
                                    GNE, GNEPRA

                  Genie Retail Energy            Genie Retail Energy
                        (GRE)                    International (GREI)

                                   Genie Renewables

                                                                           5
Investment Thesis

        Proven cash generation from GRE through
   diverse commodity & economic market environments

            Core GRE/GREI profit growth +
        emerging growth optionality in renewables

 Portfolio management drives enhanced FCF for growth
  investments & shareholder value creation strategies

Strong, debt-free balance sheet provides strategic flexibility
                                                                 6
Genie’s 2022+ Growth Strategy

Expand current retail operations to spur organic growth

          Identify new markets for expansion

             Introduce new products into
         existing, successful marketing channels

              Develop vertically integrated
         solar & renewables solutions businesses

                                                          7
GENIE RETAIL
  ENERGY
    (GRE)
GRE: US Market Opportunity & Dynamics
                 Competition                     Role of Utilities
         Incumbent utility & other REPs    Distribution & Billing (most markets)

        28
Deregulated markets
 (State by state regulatory
         structure)

                                                                                   9
GRE Value Creation
Customer Acquisition Model                   Risk Management                          Customer Retention
 Multiple sales channels to residential      Hedging strategies reduce                  Superior customer service

         & small commercial                   commodity volatility risk
                                                                                        Customer rewards program

    Diverse portfolio of products         In purchase of receivable markets
 highlighted by green energy (carbon       - utilities assume bad debt risk
  offsets), variable & fixed rate plans
                                            Geographic diversity reduces      Attractive Financial
 Deep data analysis to identify market
  opportunities & optimize offerings
                                             weather & regulatory risks
                                                                                   Returns
                                                                               Attractive margin & cash flow cycle

                                                                               Targeted payback period tailored to
                                                                                    product & customer type
                                                                                                                     10
GENIE RENEWABLES
Genie Renewables at a Glance

100 kW – 3 mW                   5 mW+                     Today’s Offering:
     Commercial Solar          Community Solar
    Target Project Size
                                                    C&I & community solar project
                                                            development
  Customers make decisions based on
        relationships & price
                                                        Proprietary solar panels
                                                         (made in US/overseas)
      Best in class companies fund
           their own projects
                                                      Commercial energy advisory
     Government subsidies helping
                                                 Community solar subscriber acquisition
    2-4 strong regional market players +
           some small local players
 More competition in community solar space                                            12
Genie Renewables – US Market Dynamics
>43% >600K Commercial customers increasingly
financing conversion costs
Solar as a % of TAM for Solar
new grid capacity on commercial facilities Chinese supply constraints present
(2020) opportunities
145gW 1% Increasing government incentives for
Potential Solar Capacity Penetration for Solar community solar
on commercial facilities
Favorable Regulatory Environment
• Federal ITC (investment tax credit) proposals could open additional opportunities
• Increase ITC from 26% to 30%
• Potential transition from tax credit to cash back (eliminates need for tax liability)
• Still needed for depreciation 13
• Community solar guarantees customers L-T savings over utilityGenie Renewables – Growth Strategy
Expansion to adjacent markets
Increasing sales force & growing distribution relationships
Own & operate community solar projects
Leverage vertical integration to develop community solar projects
Improve solar development project close rate
Provide financing options incl. L-T cash flow financing
Strong balance sheet & access to capital markets provides lower cost of capital vs competition
14GENIE RETAIL ENERGY
INTERNATIONAL
(GREI)GREI’s Businesses
16GREI’s Market Opportunity
2.5M 7.0M 0.5M
2.7M 4.7M
1.5M 2.5M
17GREI at a Glance
Market Dynamics Core Products
~70 >50%* Finland: Variable, Fixed, Bundle, & Premium Electricity
Active Suppliers Est. share of Top 3
Sweden: Variable, Fixed Electricity
100%
Monthly Payment Plans Upsell Opportunities
Green/Eco energy
Low Barriers to Entry Energy Solutions (Solar Solutions) Bundles (e.g. fresh
Light to medium market regulation ground coffee; HBO subscription)
Consolidation underway
18
*Internal EstimateGREI Growth Strategy
Invest for profitable meter growth in existing markets
Organic & acquired meter acquisition strategies
Improve profitability by market as businesses mature
Reduce churn - customer service investment in technology/human capital
Economies of scale - create operating leverage & 3rd party margin leverage
Exploit adjacencies – geographic, customer and product
5 potential new countries identified that would not require significant new infrastructure
Existing markets (e.g. business customers, gas shipping services, etc.)
Products - deep green products, digital solutions (e.g. asset finance, energy optimization, L-T customer
contracts, etc.)
19FINANCIAL SUMMARY
Genie Energy Pro-forma Consolidated Financials*
                          $m
                        $400                                                                                              35%
                                                  Revenue          Adj. EBITDA          Gross Margin

                        $350
                                                                                                                          33%
                        $300

                        $250
                                                                                                                          31%

                        $200

                                                                                                                          29%
                        $150

                        $100
                                                                                                                          27%
                          $50

                           $0                                                                                             25%
                                        2018                  2019                  2020                  2021
                                                                                                                                       21
* Pro-forma excluding the impact of Texas Winter Storm Uri, UK, Japan & GoGas operations a/o 12/31/21. Please see reconciliations in
Appendix
GRE Pro-forma Financial Highlights*
$m
$350 35%
Revenue Adj. EBITDA Gross Margin
$300
33%
$250
31%
$200
$150
29%
$100
27%
$50
$0 25%
2018 2019 2020 2021 22
* Pro-forma excluding the impact of Texas Winter Storm Uri on operations a/o 12/31/21. Please see reconciliations in AppendixGenie Renewables Financial Highlights*
$m
$35 40%
Revenue
2020
Large, low margin order skewed revenue Adj. EBITDA 35%
and gross margin Gross Margin
$25 30%
2021
Refocused the business to focus on 25%
margin improvements
$15 20%
2022
Moving up the solar value chain;
Growing sales force; 15%
Using balance sheet to compete for deals.
$5 10%
~$15M **
2018 2019 2020 2021
5%
2022 Expected -$5 0%
Solar Revenue
23
* Please see reconciliations in Appendix **Assumes current backlog of signed contracts are fully installed during 2022GREI Pro-forma Financial Highlights*
$m
Revenue Adj. EBITDA Gross Margin
$45 40%
$40
35%
$35
30%
$30
25%
$25
$20 20%
$15
15%
$10
10%
$5
5%
$0
-$5 0%
2019 2020 2021
24
* Pro-forma excl. impact of UK & Japan operations as of 12/31/21. Please see reconciliations in AppendixGenie Energy Summary
Proven cash generation from GRE through diverse commodity
& economic market environments
Core GRE/GREI profit growth +
emerging growth optionality in renewables
Portfolio management drives enhanced FCF for growth investment
& shareholder value creation strategies
Strong, debt-free balance sheet provides strategic flexibility
25T H A N K YO U !
Michael Stein Avi Goldin
Chief Executive Officer Chief Financial Officer
IR Contact:
Brian Siegel
Managing Director, Hayden IR
(346) 396-8696
brian@haydenir.comReconciliation of Non-GAAP Financial Measures In addition to disclosing financial results that are determined in accordance with generally accepted accounting principles in the United States of America (GAAP), Genie Energy disclosed for the fourth quarter and full year 2021, as well as for the third quarter 2020, Adjusted EBITDA on a consolidated basis and for its Genie Retail Energy segment. Adjusted EBITDA is a non-GAAP measure. Generally, a non-GAAP financial measure is a numerical measure of a company’s performance, financial position, or cash flows that either excludes or includes amounts that are not normally excluded or included in the most directly comparable measure calculated and presented in accordance with GAAP. Genie Energy’s measure of consolidated Adjusted EBITDA starts with net income and adds back interest, taxes, depreciation, amortization, stock-based compensation and impairment of assets and subtracts out equity in the net loss of equity method investees, net. Genie Energy’s measure of segment level Adjusted EBITDA starts with income (loss) from operations, and adds back depreciation, amortization, stock-based compensation and subtracts out impairment of assets and equity in the net loss of equity method investees, net. Adjusted EBITDA should be considered in addition to, not as a substitute for, or superior to, revenue, gross profit, income from operations, cash flow from operating activities, net income, basic and diluted earnings per share or other measures of liquidity and financial performance prepared in accordance with GAAP. In addition, Genie Energy’s measurement of Adjusted EBITDA may not be comparable to similarly titled measures reported by other companies. Management believes that Genie Energy’s measure of Adjusted EBITDA provides useful information to both management and investors by excluding certain expenses that may not be indicative of Genie Energy’s core operating results. Management uses Adjusted EBITDA, among other measures, as a relevant indicator of core operational strengths in its financial and operational decision-making. Management also uses Adjusted EBITDA to evaluate operating performance in relation to Genie Energy’s competitors. Disclosure of this non-GAAP financial measure may be useful to investors in evaluating performance and allows for greater transparency to the underlying supplemental information used by management in its financial and operational decision-making. In addition, Genie Energy has historically reported Adjusted EBITDA and believes it is commonly used by readers of financial information in assessing performance. Therefore, the inclusion of comparative numbers provides consistency in financial reporting at this time. Management refers to Adjusted EBITDA as well as the GAAP measures revenue, gross profit, income (loss) from operations and net income (loss), on a consolidated level to facilitate internal and external comparisons to Genie Energy's historical operating results, in making operating decisions, for budget and planning purposes, and to form the basis upon which management is compensated. Although depreciation and amortization are considered operating costs under GAAP, they primarily represent the non-cash current period allocation of costs associated with long-lived assets acquired or constructed in prior periods. Genie Energy’s operating results exclusive of depreciation and amortization are therefore useful indicators of its current performance. Stock-based compensation recognized by Genie Energy and other companies may not be comparable because of the various valuation methodologies, subjective assumptions and the variety of types of awards that are permitted under GAAP. Stock-based compensation is excluded from Genie Energy’s calculation of Adjusted EBITDA because management believes this allows investors to make more meaningful comparisons of the operating results of Genie Energy’s core business with the results of other companies. However, stock-based compensation will continue to be a significant expense for Genie Energy for the foreseeable future and an important part of employees’ compensation that impacts their performance. Impairment of goodwill is a component of (loss) income from operations that is excluded from the calculation of Adjusted EBITDA. The impairment of goodwill is primarily dictated by events and circumstances outside the control of management that trigger an impairment analysis. While there may be similar charges in other periods, the nature and magnitude of these charges can fluctuate markedly and do not reflect the performance of Genie Energy's continuing operations. Following are the reconciliations of Adjusted EBITDA on a consolidated basis to its most directly comparable GAAP measure. Adjusted EBITDA is reconciled to net income for Genie Energy on a consolidated basis and for the Genie Retail Energy (GRE) segment. 27
*Pro-forma Financials
                                                                      Genie Consolidated
                           $ (000's)                      2018                2019           2020              2021
                           Revenue
                             GRE                           $274,440             $286,610      $304,450          $311,830
                             Lumo                                ---             $15,190       $18,500           $40,460
                             Other                           $5,690              $12,090       $25,210            $7,510
                           Total Revenue                   $280,140             $313,890      $348,160          $359,800

                           COGS
                            GRE                            $199,260             $205,990      $216,140        $210,950**
                            Lumo                                 ---             $14,620       $14,930           $27,230
                            Other                            $4,500              $10,140       $23,000            $4,730
                           Total COGS                      $203,750             $230,750      $254,070          $242,910

                           Gross Profit                     $76,380              $83,140       $94,100          $116,890
                           Gross Margin                       27.3%                26.5%         27.0%             32.5%

                           SG&A                            $58,140*              $65,330       $61,820            $66,560

                           Pro-Forma EBITDA                $23,460*              $20,310       $32,880         $51,260**
                           * Excludes the Polar Vortex Legal Settlement (($1.7mm) in 2018)
                           ** Excludes by by the Texas Winter Event ($10mm)
                                                                                                                                         28
*** Pro-forma excluding the impact of Texas Winter Storm Uri, GoGas, UK & Japan operations a/o 12/31/21. Please see reconciliations in
Appendix
*Pro-forma Financials
Genie Retail Energy
$ (000's) 2018 2019 2020 2021
Revenue
Electricity $227,880 $246,690 $270,890 $273,020
Gas $46,560 $39,930 $33,560 $38,810
Total Revenue $274,440 $286,610 $304,450 $311,830
COGS
Electricity $166,950 $180,160 $197,040 $188,480**
Gas $32,300 $25,820 $19,100 $22,470
Total COGS $199,260 $205,990 $216,140 $210,950
Gross Profit $75,180 $80,620 $88,310 $100,880
Gross Margin 27.4% 28.1% 29.0% 32.4%
SG&A $47,590* $52,870 $49,210 $54,530
Pro-Forma EBITDA $29,300* $28,340 $37,440 $46,000**
* Excludes the Polar Vortex Legal Settlement (($1.7mm) in 2018)
** Excludes by by the Texas Winter Event ($10mm)
29
* Pro-forma excluding the impact of Texas Winter Storm Uri a/o 12/31/21. Please see reconciliations in Appendix*Pro-forma Financials
Lumo Energy
$ (000's) 2019 2020 2021
Revenue
Finland $15,190 $17,800 $36,770
Sweden --- $700 $3,680
Total Revenue $15,190 $18,500 $40,460
COGS
Finland $14,620 $14,280 $26,550
Sweden --- $650 $680
Total COGS $14,620 $14,930 $27,230
Gross Profit $570 $3,570 $13,220
Gross Margin 3.8% 19.3% 32.7%
SG&A $2,070 $2,600 $3,220
Pro-Forma EBITDA ($1,480) $810 $9,960
30
* Please see reconciliations in AppendixReconciliation Tables
Slide 4 - Genie Energy Highlights
2021
Consolidated revenue (as reported) $363,730
Less
Revenue of Genie Japan + Orbit Energy (UK) $3,930
Pro-forma consolidated revenue $359,800
Consolidated gross profit (as reported) $104,860
Less
Gross (loss) profit of Genie Japan and Orbit Energy (UK) ($2,020)
Gross (loss) profit from Winter Storm Uri ($10,000)
Pro-forma consolidated gross profit $116,880
Pro forma consolidated gross profit margin 32.5%
Consolidated Adjusted EBITDA (as reported) $37,740
Less
Adjusted EBITDA of Genie Japan + Orbit Energy (UK) ($3,360)
Gross profit (loss) from Winter Storm Uri ($10,000)
Adjusted EBITDA of GOGAS ($160)
Pro forma consolidated Adjusted EBITDA $51,260 31Reconciliation Tables
Slides 11,28 - GRE Financial Highlights
2018 2019 2020 2021
GRE revenue (as reported) $274,950 $286,610 $304,450 $311,830
GRE gross profit (as reported) $75,690 $80,620 $88,310 $90,880
Less
Gross profit (loss) from Winter Storm Uri --- --- --- ($10,000)
Pro-forma GRE gross profit $75,690 $80,620 $88,310 $100,880
Pro-forma GRE gross profit margin 27.5% 28.1% 29.0% 32.4%
GRE Adjusted EBITDA (as reported) $31,090 $28,340 $37,440 $36,000
Less
Impact of polar vortex legal settlement $1,700
Gross (loss) profit from Winter Storm Uri ($10,000)
Pro forma GRE Adjusted EBITDA $29,390 $28,340 $37,440 $46,000
32Reconciliation Tables
Slides 24,29 - Lumo Financial Highlights
2019 2020 2021
GREI revenue (as reported) $16,590 $49,650 $44,390
Less
Revenue of Genie Japan and Orbit Energy (UK) $1,400 $31,150 $3,930
Pro forma GREI revenue $15,190 $18,500 $40,460
GREI gross profit (as reported) $330 $7,160 $11,200
Less
Gross (loss) profit of Genie Japan and Orbit Energy (UK) ($240) $3,590 ($2,020)
Pro-forma GREI gross profit $570 $3,570 $13,220
Pro-forma GREI gross profit margin 3.8% 19.3% 32.7%
GREI Adjusted EBITDA (as reported) ($10,700) ($6,320) $5,780
Less
Adjusted EBITDA of Genie Japan and Orbit Energy (UK) ($8,960) ($6,840) ($3,360)
Non-Lumo SG&A ($260) ($290) ($820)
Pro forma Lumo Adjusted EBITDA ($1,480) $810 $9,960
33Reconciliation Tables
Slides 21,27 - Genie Energy Financials - Consolidated
2018 2019 2020 2021
Consolidated revenue (as reported) $280,310 $315,290 $379,310 $363,730
Less
Revenue of Genie Japan + Orbit Energy (UK) --- $1,400 $31,150 $3,930
Revenue of GOGAS $170 --- --- ---
Pro forma consolidated revenue $280,140 $313,890 $348,160 $359,800
Consolidated gross profit (as reported) $76,550 $82,900 $97,680 $104,860
Less
Gross profit (loss) of Genie Japan + Orbit Energy (UK) --- ($240) $3,590 ($2,020)
Gross (loss) profit from Winter Storm Uri --- --- --- ($10,000)
Gross profit of GOGAS $170 --- --- ---
Pro-forma consolidated gross profit $76,380 $83,140 $94,100 $116,890
Pro forma consolidated gross profit margin 27.3% 26.5% 27.0% 32.5%
Consolidated Adjusted EBITDA (as reported) $17,870 $10,090 $23,970 $37,740
Less
Adjusted EBITDA of Genie Japan + Orbit Energy (UK) --- ($8,960) ($6,800) ($3,360)
Gross (loss) profit from Winter Storm Uri --- --- --- ($10,000)
Impact of polar vortex legal settlement (SG&A) ($1,700) --- --- ---
Adjusted EBITDA of GOGAS ($3,890) ($1,260) ($2,120) ($160)
Pro forma consolidated Adjusted EBITDA $23,460 $20,310 $32,880 $51,260
34You can also read