DEUTSCHE BANK MEDIA, INTERNET & TELECOM CONFERENCE - ELLIOT JORDAN, CFO March 8, 2021
←
→
Page content transcription
If your browser does not render page correctly, please read the page content below

DEUTSCHE BANK MEDIA, INTERNET &
     TELECOM CONFERENCE
           ELLIOT JORDAN, CFO
              March 8, 2021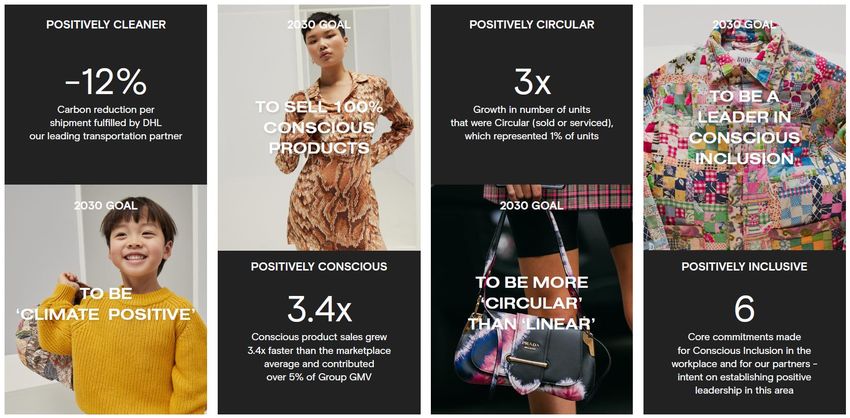
2

                                                                                                         IMPORTANT NOTICE
This presentation and the accompanying oral presentation contain forward-looking statements within the meaning of the Private Securities Litigation Reform Act of 1995. All statements contained in this presentation and the accompanying oral presentation that do not
relate to matters of historical fact should be considered forward-looking statements, including, without limitation, statements regarding Luxury New Retail, our operations in China and the anticipated future launch of new categories, any further transactions and any
related benefits, future opportunities and anticipated business levels, future financial or operating performance, planned activities and objectives, anticipated growth resulting therefrom, market opportunities, strategies, competition and other expectations, the anticipated
impact of the COVID-19 pandemic on us and the broader luxury industry, our strategic initiatives, our environmental, sustainability, responsible sourcing, social and inclusion and diversity goals, future growth of the luxury industry, the acceleration of the online
penetration of the luxury industry, our expected future performance and profitability in 2021, as well as statements that include the words “expect,” “intend,” “plan,” “believe,” “project,” “forecast,” “estimate,” “may,” “should,” “anticipate,” “will,” “could,” “aim,” “continue”
and similar statements of a future or forward-looking nature. These forward-looking statements are based on management’s current expectations. These statements are neither promises nor guarantees, but involve known and unknown risks, uncertainties and other
important factors that may cause actual results, performance or achievements to be materially different from any future results, performance or achievements expressed or implied by the forward-looking statements, including, but not limited to: purchasers of luxury
products may not choose to shop online in sufficient numbers; our ability to generate sufficient revenue to be profitable or to generate positive cash flow on a sustained basis; the volatility and difficulty in predicting the luxury fashion industry, in particular in light of the
COVID-19 pandemic and its impact on consumer spending patterns; our reliance on a limited number of retailers and brands for the supply of products on our Marketplace; our reliance on retailers and brands to anticipate, identify and respond quickly to new and
changing fashion trends, consumer preferences and other factors; our reliance on retailers and brands to make products available to our consumers on our Marketplace and to set their own prices for such products; fluctuations in foreign exchange rates; our reliance on
information technologies and our ability to adapt to technological developments; our ability to acquire or retain consumers and to promote and sustain the Farfetch brand; our ability or the ability of third-parties to protect our sites, networks and systems against security
breaches, or otherwise to protect our confidential information; our ability to successfully launch and monetize new and innovative technology; our acquisition and integration of other companies or technologies, for example, Stadium Goods and New Guards, could divert
management’s attention and otherwise disrupt our operations and harm our operating results; we may be unsuccessful in integrating any acquired businesses or realizing any anticipated benefits of such acquisitions; our dependence on highly skilled personnel,
including our senior management, data scientists and technology professionals, and our ability to hire, retain and motivate qualified personnel; the effect of the COVID-19 pandemic on our business and results of operations, as well as on the luxury fashion industry and
consumer spending more broadly; our ability to successfully implement our business plan during a global economic downturn caused by the COVID-19 pandemic; the increased focus on social, environmental and sustainability matters could increase our costs, harm
our reputation and adversely affect our financial results, our ability to implement our environmental, sustainability, responsible sourcing, social and inclusion and diversity goals; the impact of general economic factors, natural disasters or other unexpected events; Mr.
Neves has considerable influence over important corporate matters due to his ownership of us, and our dual-class voting structure will limit your ability to influence corporate matters, including a change of control; and the other important factors discussed under the
caption “Risk Factors” in our Annual Report on Form 20-F filed with the U.S. Securities and Exchange Commission (“SEC”) for the fiscal year ended December 31, 2020, as such factors may be updated from time to time in our other filings with the SEC, which are
accessible on the SEC’s website at www.sec.gov and on our website at http://farfetchinvestors.com.
In addition, we operate in a very competitive and rapidly changing environment. New risks emerge from time to time. It is not possible for our management to predict all risks, nor can we assess the impact of all factors on our business or the extent to which any factor,
or combination of factors, may cause actual results to differ materially from those contained in any forward-looking statements that we may make. In light of these risks, uncertainties and assumptions, the forward-looking events and circumstances discussed in this
presentation and the accompanying oral presentation are inherently uncertain and may not occur, and actual results could differ materially and adversely from those anticipated or implied in the forward-looking statements. Accordingly, you should not rely upon forward-
looking statements as predictions of future events. In addition, the forward-looking statements made in this presentation and the accompanying oral presentation relate only to events or information as of the date on which the statements are made in this presentation
and the accompanying oral presentation. Except as required by law, we undertake no obligation to update or revise publicly any forward-looking statements, whether as a result of new information, future events or otherwise, after the date on which the statements are
made or to reflect the occurrence of unanticipated events. Unless otherwise indicated, information contained in this presentation concerning our industry, competitive position and the markets in which we operate is based on information from independent industry and
research organizations, other third-party sources and management estimates. Management estimates are derived from publicly available information released by independent industry analysts and other third-party sources, as well as data from our internal research,
and are based on assumptions made by us upon reviewing such data, and our experience in, and knowledge of, such industry and markets, which we believe to be reasonable. In addition, projections, assumptions and estimates of the future performance of the
industry in which we operate and our future performance are necessarily subject to uncertainty and risk due to a variety of factors, including those described above. These and other factors could cause results to differ materially from those expressed in the estimates
made by independent parties and by us. All subsequent written and oral forward-looking statements attributable to Farfetch, New Guards, their respective Boards of Directors or any person acting on behalf of any of them are expressly qualified in their entirety by this
notice.
This presentation and the accompanying oral presentation include certain financial measures not presented in accordance with International Financial Reporting Standards (“IFRS”) including but not limited to, Adjusted EBITDA, Adjusted EBITDA Margin, Adjusted EPS,
Adjusted Revenue, Digital Platform Order Contribution and Digital Platform Order Contribution Margin. These financial measures are not measures of financial performance in accordance with IFRS and may exclude items that are significant to understanding and
assessing the Company’s financial results. Therefore, these measures should not be considered in isolation or as an alternative to loss after tax, revenue, gross profit or other measures of profitability, liquidity or performance under IFRS. You should be aware that the
Company’s presentation of these measures may not be comparable to similarly-titled measures used by other companies, which may be defined and calculated differently. Reconciliations of these non-IFRS measures to the most directly comparable IFRS measure are
provided in the Appendix, as applicable.
Certain figures in this presentation may not recalculate exactly due to rounding. This is because percentages and/or figures contained herein are calculated based on actual numbers and not the rounded numbers presented.

                                                                                                                                                                                                                                                                                       2
Farfetch exists for the love
 of fashion. We believe in
empowering individuality.
  Our mission is to be the
global platform for luxury,
  connecting the creators,
 curators and consumers.

44

                1       Marketplaces                                         2     Luxury New Retail and                              3   Brand Platform
                                                                                    Enterprise Solutions
                                                                                                      Store of the
                                                                                 FPS
                                                                                                        Future

                                                                                        PLATFORM

E-concessions       Photography    Product                  Inventory        Payments    Fulfilment      Customer     Media      Design   Production   Wholesale        Brand
                                              Marketing
                                  Catalogue                Management                                     Service    Solutions                         Distribution   Development

                                                          Digital Platform                                                                    Brand Platform
5

          RESILIENT GROWING INDUSTRY WITH STRONG TAILWIND TOWARDS
                                   ONLINE
                                                                                         Personal Luxury Goods Market ($bn)

                    2%                           3%                           4%            5%            6%            7%             9%           10%           12%           23%                                                      >30%

 %    – Online share as % of total market

                                                                                                                                                                                                                                         437
                                                                                                                                                                                                                           378
                                                                                                                                                                  332                                        343
                                                                                                         290                          300           310                                       307
                                                                                                                       288
                                                               245           251           259                                                                                  256
                                                220
      188                         197
                    174

     2008A        2009A         2010A         2011A         2012A          2013A         2014A         2015A         2016A         2017A          2018A         2019A         2020E         2021F         2022F          2023F         2025F

Source: Bain & Company and Altagamma: “The Future of Luxury: A Look Into Tomorrow to Understand Today (November 2018)”, Bain Altagamma “Luxury Goods Worldwide Market Study, Spring 2020” (May 2020) and Bain Altagamma “Luxury Goods Worldwide
Market Monitor” (November 2020). Data converted from EUR to USD at an exchange rate of 1.182 (Nov 2020). Bain estimates a TAM in 2021F of €240bn- €260bn; in 2022F of €260bn- €290bn; in 2023F of €280bn- €320bn, and in 2025F of €330bn- €370bn
6

                                                                   ATTRACTIVE INDUSTRY DYNAMICS
                Large and Resilient TAM                                   Luxury Purchases Online                                          Generational Shift                                    Emerging Market Growth
                Global Market for Personal Luxury                                  % Online Penetration                             Millennial and Gen Z Share in Global                             Share of Chinese Consumers
                            Goods                                                                                                       Personal Luxury Goods Sales                                in Personal Luxury Goods Sales

           2019                  $332bn                               2019                   12%                                  2019                    44%                              2019                33%

                    2020E:       $258bn                                         2020E: 23%                                                  2020E: 57%                                                 2020E: ~28%

                       ~5%                                                        ~23%                                                        ~13%                                                     ~11%
                       CAGR                                                       CAGR                                                        CAGR                                                     CAGR

          2025F                 $437bn                               2025F                 >30%                                 2025F                    70%                              2025F               48%

Source: Bain Altagamma “Luxury Goods Worldwide Market Monitor” (November 2020). Data converted from EUR to USD at an exchange rate of 1.182 (Nov 2020). Bain estimates a TAM in 2025F of €300bn- €370bn.
7

                  KEY AREAS OF STRATEGIC FOCUS

                UNRIVALLED
                  GLOBAL                    FARFETCH
                CUSTOMER                     BRAND
                EXPERIENCE

STRENGTHENING                LUXURY NEW
  OUR LUXURY                 RETAIL (LNR)              CHINA
 PARTNERSHIPS                 PLATFORM
2020 RESULTS

9

                              Q4’20 – DRIVING GMV, REVENUE AND GROSS PROFIT GROWTH
USDm

                                                       GMV                                                                         REVENUE 2                                                                      GROSS PROFIT
                                                                                                         Adjusted Revenue 1                                                                              46.1%      Gross Profit Margin %          46.1%

                                                                          $1,057
           Group

                                    $740
                                                                                                                                                             $465
                                                                                                                      $338                                                                                                                       $249
                                                                                                                                                                                                          $176

                                    Q4 19                                  Q4 20                                     Q4 19                                   Q4 20                                       Q4 19                                  Q4 20

                                                                                                         Digital Platform Services                                                                       54.6%      Gross Profit Margin %4         54.4%
           Digital Platform

                                                                                                         Revenue
                                                                            $939
                                    $629
                                                                                                                                                               $347
                                                                                                                       $226                                                                               $124                                   $189

                                    Q4 19                                  Q4 20                                       Q4 19                                  Q4 20                                      Q4 19                                  Q4 20

                                                                                                           Brand Platform                                                                                46.8%       Gross Profit Margin %         49.9%
           Brand Platform3

                                                                                                           Revenue

                                     $102                                   $104                                                                               $104
                                                                                                                       $102
                                                                                                                                                                                                                                                  $52
                                                                                                                                                                                                           $48

                                    Q4 19                                  Q4 20                                      Q4 19                                  Q4 20                                       Q4 20                                  Q4 20

                                                                  First-ever quarter of positive Adjusted EBITDA in Q4 2020
1 Non-IFRS financial measures, please refer to reconciliations to IFRS measures in the Appendix. 2 Group Revenue refers to Adjusted Revenue, Digital Platform Revenue refers to Digital Platform Services Revenue and Brand Platform refers to Brand Platform
Revenue. 3 Brand Platform GMV, Revenue and Gross Profit. 4 Digital Platform Gross Profit Margin means Digital Platform Gross Profit calculated as a percentage of Digital Platform Services Revenue. We provide fulfilment services to Marketplace consumers
and receive revenue from the provision of these services, which is primarily a pass-through cost with no economic benefit to us. Therefore, we calculate our Digital Platform Gross Profit Margin, including Digital Platform third-party and first-party gross profit
margin, excluding Digital Platform Fulfilment Revenue.
10

                              FY’20 – DRIVING GMV, REVENUE AND GROSS PROFIT GROWTH
USDm

                                                      GMV                                                                         REVENUE 2                                                                    GROSS PROFIT
                                                                                                        Adjusted Revenue 1                                                                             45.0%      Gross Profit Margin %         46.1%

                                                                         $3,187
           Group

                                   $2,140
                                                                                                                                                          $1,461
                                                                                                                     $893                                                                                                                     $771
                                                                                                                                                                                                        $460

                                   FY 19                                  FY 20                                     FY 19                                  FY 20                                       FY 19                                  FY 20

                                                                                                        Digital Platform Services                                                                      53.0%      Gross Profit Margin %4        54.2%
           Digital Platform

                                                                                                        Revenue
                                                                         $2,759
                                   $1,948
                                                                                                                                                           $1,033
                                                                                                                      $701                                                                                                                    $560
                                                                                                                                                                                                        $372

                                   FY 19                                  FY 20                                      FY 19                                  FY 20                                      FY 19                                  FY 20

                                                                                                         Brand Platform                                                                                            Gross Profit Margin %        48.9%
           Brand Platform3

                                                                                                         Revenue
                                                                           $390                                                                             $390
                                New Guards                                                                           New Guards                                                                      New Guards
                                 acquired in                                                                          acquired in                                                                     acquired in                              $191
                                August 2019                                                                          August 2019                                                                     August 2019

                                                                          FY 20                                                                             FY 20                                                                             FY 20

                                                             $1.6bn Cash and Cash Equivalents as of December 31, 2020
1 Non-IFRS financial measures, please refer to reconciliations to IFRS measures in the Appendix. 2 Group Revenue refers to Adjusted Revenue, Digital Platform Revenue refers to Digital Platform Services Revenue and Brand Platform refers to Brand Platform
Revenue. 3 Reported Brand Platform GMV, Revenue and Gross Profit. 4 Digital Platform Gross Profit Margin means Digital Platform Gross Profit calculated as a percentage of Digital Platform Services Revenue. We provide fulfilment services to Marketplace
consumers and receive revenue from the provision of these services, which is primarily a pass-through cost with no economic benefit to us. Therefore, we calculate our Digital Platform Gross Profit Margin, including Digital Platform third-party and first-party
gross profit margin, excluding Digital Platform Fulfilment Revenue.
LOOKING TO 2021
12

         LEVERS TO DRIVE LONG-TERM PROFITABILITY

                                                                  SCALE FIXED COST BASE
 GROW GMV AHEAD OF              DRIVE IMPROVED UNIT
                                                                     AND CAPITALIZE ON
THE OVERALL INDUSTRY                ECONOMICS
                                                                    INVESTMENTS MADE

             Continuing to target Adjusted EBITDA profitability for FY 2021
13
FY 2021 GUIDANCE
2020 Actuals 2021 Guidance
Digital Platform GMV
Growth
42% 30-35%
Digital Platform Order
Contribution Margin 35% 35-37%
Operating costs as a %
of Adj Revenue1 (42)% (38)-(40)%
Adj. EBITDA Margin2 (3)% 1-2%
1 Operating costs include general and administrative, and technology expenses
2 Non-IFRS financial measure, please refer to reconciliations to IFRS measures in the Appendix14
2021 STRATEGIC INITIATIVES
UNRIVALLED
STRENGTHENING LUXURY NEW
GLOBAL FARFETCH
OUR LUXURY RETAIL (LNR) CHINA
CUSTOMER BRAND
PARTNERSHIPS PLATFORM
EXPERIENCE
1,300+ partners - 3,500 Private Client e-concessions as a Full-funnel marketing Continuing to drive our
brands across multiple service approach localized operations
categories: Retention and ACCESS
loyalty program Browns Brook St. store New brand campaign Launch of Tmall Luxury
• Clothing in London going live in April 2021 Pavilion storefront
• Shoes Customer journey and
• Bags personalization Addition of two Chanel ‘Only on Farfetch’ – Learning and
• Accessories boutiques in Paris New Guards, other optimization across full
• Kids 360k SKUs brand exclusives and China offering
• Homeware Alibaba and Richemont unique content
• Watches & Fine
Launching Beauty (in strategic partnership
Jewelry 2022)15
FARFETCH STOREFRONT NOW LIVE ON TMALL LUXURY PAVILION
Launch of Tmall Storefront Launch Campaign
Full launch on March 1st, 2021 Integrated campaign across different channels to generate
awareness including, within Tmall, media, social channels,
Providing access to ~779 million active consumers in offline events, and collaborations with celebrities and
Alibaba’s China retail marketplace to: KOLs
~3,500 BRANDS1
90% OF WHICH ARE NEW TO TMALL
FROM 50+ COUNTRIES2
1 Represents the number of brands listed on the Farfetch Tmall Storefront at 01 March 2021.
2 Represents Farfetch physical supply as at 31 December 2020 (i.e. where the product is shipped from).16
TMALL – FARFETCH SHOPPING EXPERIENCE
Luxury Farfetch
Tmall Store
Pavilion Storefront
Find Luxury Click
Pavilion in Farfetch
category tab button17
ENVIRONMENTAL, SOCIAL AND GOVERNANCE
In 2020 we launched our ambitious 2030 goals
Note: comparative metrics refer to FY2020 vs FY201918
- GLOBAL PLATFORM FOR LUXURY FASHION
✔ The world’s only truly global marketplace for luxury at scale with powerful network effects
✔ Digital Platform GMV with growth ahead of the industry
✔ Resilient business model – Operational throughout the COVID-19 crisis
✔ Well positioned to capitalize on long-term structural trends
Luxury New Retail initiative with Alibaba and Richemont to accelerate digitization of the luxury
✔
industry
✔ Brand Platform leading the New Luxury Paradigm with unique original content
✔ Well capitalized as we continue to focus on delivering full year Adjusted EBITDA profitabilityAPPENDIX
21

                                                     Q4’20 RECONCILIATION OF NON-IFRS MEASURES

      USDm                                                                         Q4'19                  Q4'20                                                                         DEFINITIONS
      Loss after tax                                                          $     (110)         $      (2,281)
      Net finance (income)/expense                                                   (16)                     15•       Adjusted EBITDA, Adjusted EBITDA Margin, Adjusted EPS, Adjusted Revenue, Digital Platform
      Income tax benefit                                                                -                   (16)        Order Contribution and Digital Platform Order Contribution Margin are supplemental measures of
      Depreciation and amortization                                                    50                     60        our performance that are not required by, or presented in accordance with, IFRS. These metrics
      Share based payments1                                                            42                    121        are not measurements of our financial performance under IFRS and should not be considered as
      Losses on items held at fair value and                                                                            an alternative to loss after tax, revenue or any other performance measure derived in accordance
                                                                                        11                 2,057        with IFRS.
      remeasurements2
      Other items3                                                                       6                     17
      Impairment losses on tangible assets                                               -                      1•      Adjusted EBITDA means income/(loss) after taxes before net finance expense/(income), income
      Impairment losses on intangible assets                                             -                     36       tax expense/(benefit) and depreciation and amortization, further adjusted for share based
      Share of results of associates                                                     -                       -      compensation expense, share of results of associates and items outside the normal scope of our
      Adjusted EBITDA                                                         $       (18)        $            10       ordinary activities (including other items, within selling, general and administrative expenses,
      Revenue                                                                 $                                         losses/(gains) on items held at fair value and remeasurements through profit and loss, and
                                                                                     382          $        540
                                                                                                                        impairment losses on tangible assets). Adjusted EBITDA provides a basis for comparison of our
      Loss after tax margin                                                        (29)%                (422)%
                                                                                                                        business operations between current, past and future periods by excluding items that we do not
      Adjusted Revenue                                                        $      338          $        465          believe are indicative of our core operating performance.
       Adjusted EBITDA Margin                                                       (5)%                    2%

                                                                                                                  •     We caution investors that amounts presented in accordance with our definitions of Adjusted
      USDm                                                                         Q4'19                  Q4'20
                                                                                                                        EBITDA, Adjusted EBITDA Margin, Adjusted EPS, Adjusted Revenue, Digital Platform Order
      Revenue                                                                 $     382           $        540          Contribution and Digital Platform Order Contribution Margin may not be comparable to similar
      Less: Digital Platform Fulfilment Revenue                                     (44)                   (75)         measures disclosed by other companies, because not all companies and analysts calculate such
      Adjusted Revenue                                                        $     338           $        465          measures in the same manner.

1 Represents share based payment expense.
2 Represents (gains)/losses from fair value revaluations of embedded derivative liabilities associated with convertible senior notes, as well as remeasurements of the Chalhoub put option liability and the CuriosityChina call option liability..
3 Represents Other Items, which are outside the normal scope of our ordinary activities or non-cash items.
22
Q4’20 RECONCILIATION OF NON-IFRS MEASURES (CONT’D)
DEFINITIONS
USDm Q4'19 Q4'20 • Digital Platform Order Contribution is defined as Digital Platform Gross Profit less demand
Digital Platform Gross Profit $ 124 $ 189 generation expense. Digital Platform Order Contribution is not a measurement of our financial
Less: Demand generation expense (51) (67) performance under IFRS and does not purport to be an alternative to gross profit or loss after
Digital Platform Order Contribution $ 72 $ 122 tax derived in accordance with IFRS.
Digital Platform Services Revenue $ 226 $ 347
Digital Platform Gross Profit Margin 55% 54% • We believe that Digital Platform Order Contribution is a useful measure in evaluating our
Digital Platform Order Contribution Margin 32% 35% operating performance because it takes into account demand generation expense and is used
by management to analyze the operating performance of our digital platform for the periods
presented. We also believe that Digital Platform Order Contribution is a useful measure in
USD per share Q4'19 Q4'20
evaluating our operating performance within our industry because it permits the evaluation of
our platform productivity, efficiency and performance.
Earnings per share $ (0.34) $ (6.53)
1
Share based payments 0.12 0.35
Amortization of acquired intangible assets 0.09 0.09
• Adjusted EPS means earnings per share further adjusted for share based payments,
Losses on items held at fair value and
amortization of acquired intangible assets, items outside the normal scope of our ordinary
2 activities (including other items, within selling, general and administrative expenses,
remeasurements 0.03 5.88
3 losses/(gains) on items held at fair value and remeasurements through profit and loss, and
Other items 0.02 0.05
impairment losses on tangible assets) and the related tax effects of these adjustments.
Impairment losses on tangible assets - - Adjusted EPS provides a basis for comparison of our business operations between current,
Impairment losses on intangible assets 0.10 past and future periods by excluding items that we do not believe are indicative of our core
Share of results of associates - - operating performance. Adjusted EPS may not be comparable to other similarly titled metrics of
Adjusted EPS $ (0.08) $ (0.06) other companies.
1 Represents share based payment expense on a per share basis.
2 Represents (gains)/losses from fair value revaluations of embedded derivative liabilities associated with convertible senior notes, as well as remeasurements of the Chalhoub put option liability and the CuriosityChina call option liability on a per share basis.
3 Represents Other Items, which are outside the normal scope of our ordinary activities or non-cash items on a per share basis.23
FY’20 RECONCILIATION OF NON-IFRS MEASURES
USDm FY'19 FY'20
Loss after tax $ (374) $ (3,333) USDm FY'19 FY'20
Net finance (income)/expense Digital Platform Gross Profit $ 372 $ 560
(15) 84
Income tax expense/(benefit) Less: Demand generation expense (151) (199)
1 (14)
Depreciation and amortization 114 217 Digital Platform Order Contribution $ 221 $ 361
1 Digital Platform Services Revenue $ 701 $ 1,033
Share based payments 158 292
(Gains)/Losses on items held at fair value and Digital Platform Gross Profit Margin 53% 54%
(22) 2,644 Digital Platform Order Contribution Margin 32% 35%
remeasurements2
Other items3 16 24
Impairment losses on tangible assets - 3
Impairment losses on intangible assets - 36 USD per share FY'19 FY'20
Share of results of associates - - Earnings per share $ (1.21) $ (9.75)
Adjusted EBITDA $ (121) $ (47) Share based payments4 0.50 0.85
Revenue $ 1,021 1,674 Amortization of acquired intangible assets 0.17 0.36
Loss after tax margin (37)% (199)% (Gains)/losses on items held at fair value and
5
Adjusted Revenue $ 893 $ 1,461 remeasurements (0.07) 7.69
6
Adjusted EBITDA Margin (14)% (3)% Other items 0.05 0.07
Impairment losses on tangible assets - 0.01
USDm FY'19 FY'20 Impairment losses on intangible assets - 0.11
Revenue $ 1,021 $ 1,674 Share of results of associates - -
Less: Digital Platform Fulfilment Revenue (128) (213) Adjusted EPS $ (0.56) $ (0.66)
Adjusted Revenue $ 893 $ 1,461
1 Represents share based payment expense.
2 Represents (gains)/losses from fair value revaluations of embedded derivative liabilities associated with convertible senior notes, as well as remeasurements of the Chalhoub put option liability and the CuriosityChina call option liability.
3 Represents Other Items, which are outside the normal scope of our ordinary activities or non-cash items.
4 Represents share based payment expense on a per share basis.
5 Represents (gains)/losses from fair value revaluations of embedded derivative liabilities associated with convertible senior notes, as well as remeasurements of the Chalhoub put option liability and the CuriosityChina call option liability. on a per share basis.
6 Represents Other Items, which are outside the normal scope of our ordinary activities or non-cash items on a per share basis.You can also read