Does phasing-out Russian gas require new gas infrastructure? - Briefing note
←
→
Page content transcription
If your browser does not render page correctly, please read the page content below
Does phasing-out Russian gas require new
  gas infrastructure?

  Briefing note

This study has been conducted by Artelys and received funding from the European Climate Foundation
Does phasing-out Russian gas require new gas
                                       infrastructure?

                                    TABLE OF CONTENTS
1 BRIEFING                                                                                         3

1.1 CONTEXT                                                                                        3
1.2 OBJECTIVE OF THE ANALYSIS                                                                      3
1.3 KEY FINDINGS                                                                                   4
 1.3.1 THE FIT-FOR-55 PACKAGE IS ON THE RIGHT TRACK, BUT IS NOT SUFFICIENT                         4
 1.3.2 ADDITIONAL EUROPEAN CLEAN ENERGY INVESTMENTS PROVIDE THE BEST PATH FORWARD TO ENSURE FULL
 SECURITY OF SUPPLY FOR A RUSSIAN GAS PHASE-OUT                                                    8

BIBLIOGRAPHY                                                                                   13

2 ANNEX                                                                                        14

2.1 FIT-FOR-55 SCENARIO                                                                        14
2.2 METHODOLOGY TO ESTABLISH THE SOLUTIONS RUNS                                                15
2.3 ARTELYS CRYSTAL SUPER GRID OVERVIEW                                                        16

                                                                                                       2/17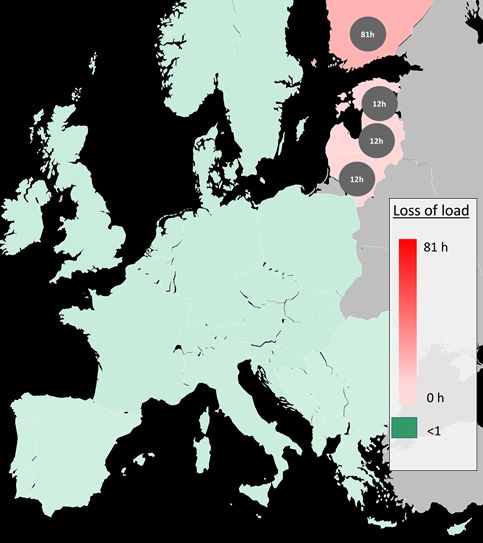
Does phasing-out Russian gas require new gas
                                         infrastructure?

1 Briefing
1.1 Context
The war in Ukraine has driven demands to reduce imports of Russian gas as soon as possible, while at
the same time replenishing European storage assets ahead of next winter, including via demand
destruction if required. However, it also requires us to think where to allocate capital to reduce
dependency in a structural way especially in light of the European Union’s climate targets.

LNG is being considered as a viable alternative to importing natural gas from Russia. Since the end of
2021, the TTF/JKM spread has resulted in the LNG armada to redirect towards European ports, where
consumers were offering prices that were higher than those offered by their Asian counterparts.

On top of increasing the utilisation rate of existing LNG terminals, the idea of building additional
regasification capacities in Europe is gaining momentum.

The European Commission has announced the REPowerEU plan (due 18 May 2022) to make Europe
independent from Russian fossil fuels before 2030, and reduce EU demand for Russian gas by two
thirds before the end of the year. This plan is likely to include initiatives in the following areas:

    •    Diversification of gas supplies, via higher LNG and piped imports,
    •    Larger volumes of biomethane and renewable hydrogen production, and imports,
    •    Faster reduction of the use of fossil fuels in buildings, industry and power system, through
         energy efficiency, increased renewables deployment and electrification.

Furthermore, the US and the EU have announced the establishment of a Task Force to reduce Europe’s
dependency on Russian gas. As a consequence, the US will increase LNG exports volumes to the EU
(+15 bcm in 2022, +50 bcm/year until 2030), and the EU will work on accelerating regulatory
procedures for approval of LNG import infrastructure.

Finally, on top of the PCI list, several Member States have announced their ambition to invest in new
LNG terminals and pipelines as a way to guarantee their security of gas supply in case of complete
phase-out from Russian gas. In particular, countries such as Germany, France, Italy, Greece, Poland,
Estonia and the Netherlands have set out plans to invest in floating and stationary LNG import
capacities. Proposed and revived projects since the beginning of the crisis would have a total capacity
of at least 70-80 bcm of LNG imports per year, including at least six new FSRUs (Global Energy Monitor,
2022).

1.2 Objective of the analysis
This briefing note assesses the feasibility of a complete phase-out from Russian gas by 2025 (along the
lines of the approach laid about the REPowerEU plan, but 2 years earlier) under the European Union’s
Fit for 55 policy pathway, and provides insights on what additional investments would need to be made
in the next 3-year investment cycle to ensure Europe security of supply, both for gas and for electricity.

                                                                                                             3/17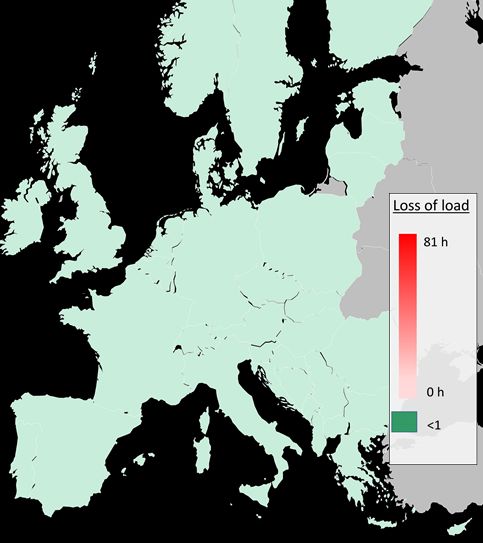
Does phasing-out Russian gas require new gas
infrastructure?
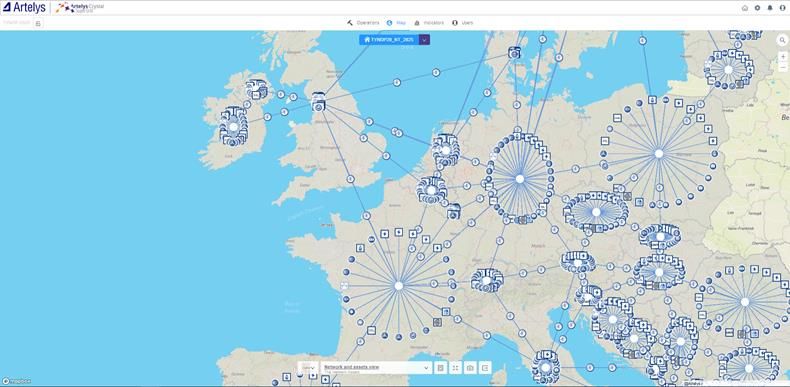
The analysis is based on the energy system optimisation model Artelys Crystal Super Grid1, which
covers in high granularity the entire European gas and electricity systems. Each Member State and
relevant neighbouring countries are represented (one node per country). Artelys Crystal Super Grid
performs the joint hourly dispatch simulation (over the duration of an entire year) and optimisation of
investments in a large number of technologies. The result consists of the hourly utilisation for gas and
electricity of all national generation, storage, sector coupling and cross-border capacities (including
demand side response assets for electricity), as well as of the set of investment decisions that are
economically relevant.
In this briefing, we compare two investment strategies for the upcoming investment cycle. Both allow
Europe to keep meeting its energy demand. One strategy is based on investing in regasification
capacity to increase the ability to import LNG beyond the current capabilities, and a second strategy is
based on additional investments in energy efficiency measures, electrification, renewables and
flexibility solutions. While the two strategies are designed to ensure security of supply, they strongly
differ in terms of costs, CO2 emissions, and exposure to price movements on global LNG markets.
1.3 Key findings
1.3.1 The Fit-for-55 package is on the right track, but is not sufficient
The Fit-for-55 package2 of policy measures currently being negotiated by the Council and European
Parliament foresees a major acceleration of the deployment of renewables, and significant new efforts
to reduce the European gas demand through energy efficiency measures and electrification.
Approximately 135 GW of wind capacity and 124 GW of solar capacity are added in 2025 compared to
2019 EU27 levels. On the gas side, demand is reduced by 17% between 2019 and 2025 (Figure 1). In
2019, total European gas supply reached 520 bcm for a consumption of 483 bcm (the difference
between supply and consumption accounts for exports and storage). In 2025, Fit-for-55 measures
allow gas consumption to reach 403 bcm3.
1
Additional details available in 2.3
2
The Fit-for-55 is a package of proposals to make the EU's climate, energy, land use, transport and taxation
policies fit for reducing net greenhouse gas emissions by at least 55% by 2030, compared to 1990 levels.
3
In 2025, LNG volumes are reduced to close to zero as they are among the most expensive gas supply sources,
and are reduced first.
4/17Does phasing-out Russian gas require new gas
infrastructure?
500 Russia
102
Norway
400
107 80
Africa
300 27
bcm
53
Azerbaijan
109
200 108
LNG
Indigenous
100 173
152
Consumption
0
2019 Baseline
Figure 1 – European gas supply mix (EU27+UK, NO, CH and Balkans).
BP Statistical Review of World Energy (2019 data), TYNDP 2018 and Fit-for-55 (2025 data4)
The implementation of the measures proposed in the Fit-for-55 package would enable the EU to largely
exit Russian gas by 2025, through the foreseen large-scale deployment of renewables, heat pumps and
energy efficiency measures bringing down Europe’s gas demand:
• Security of supply issues are limited to low volumes (around 40 GWh of unmet electricity
demand due to gas-to-power shortage).
• Security of supply issues are limited to a few countries, namely Finland, Estonia, Latvia and
Lithuania (Figure 2).
• Other countries in Europe (even East of Europe) do not experience security of supply issues.
4
Supply mix based on TYNDP 2018; demand volume derived from Fit-for-55.
5/17Does phasing-out Russian gas require new gas
infrastructure?
Figure 2 – Number of hours of loss of load per country in the Russian gas phase-out scenario
However, even if thanks to the Fit-for-55 measures Europe will already be well placed to cope with a
complete phase-out of fossil gas imports from Russia, the situation comes with some important
caveats:
• Europe would continue to rely on a large amount of potentially expensive LNG imports, up to
ca. 100 bcm (Figure 3). These imports do not exceed the 2019-2020 level (around 107 bcm),
and can be handled by the existing LNG regasification infrastructure. Importing additional 50
bcm compared to today’s levels (as assumed in REPowerEU and by the EC and US Task Force)
is not necessary.
• The higher price of LNG results in the displacement of gas power plants by coal and lignite
power plants, thus increasing power sector CO2 emissions by 113 Mt CO2 (Figure 4), which
amounts to roughly 3% of total European CO2 emissions in 2019 (International Energy Agency,
2022).
• The gas supply situation remains quite tight in Europe, as gas flows are redirected on the West-
to-East route: the overall European transmission network features significantly high utilisation
rates (e.g., usage exceeds 95% between Belgium, the Netherlands and Germany). In order to
relieve the European transmission network from potential congestion and strengthen the
resilience of the gas and electricity systems, a structural decrease of gas demand is needed.
• As Russian gas phase-out is in majority compensated by higher LNG imports, Europe faces
increased vulnerability to LNG market price volatility and competition with Asian economies
under lacking global export capacities.
6/17Does phasing-out Russian gas require new gas
infrastructure?
Figure 3 – Evolution of European gas supply and demand: Russian gas phase-out against Baseline
Reading note: The phasing-out of Russian gas removes 152 bcm of gas supply, compensated by an
increase in indigenous production (4 bcm), pipeline imports (15 bcm) and LNG imports (100 bcm),
reaching 370 bcm consumption. Gas demand would decrease as higher gas prices drive a switch from
gas-based power generation to coal/lignite-based generation, resulting in 34 bcm of gas demand
reduction.
Figure 4 – Evolution of European co2 emissions: Russian gas phase-out against Baseline
Reading note: The switch from gas-based power generation to coal and lignite-based generation
increases coal and lignite CO2 emissions by 193 Mt while reducing gas to power emissions by only 80
Mt CO2, resulting in an increase of power sector emissions by 113 Mt CO2 due to switch to more carbon
intensive power plants.
7/17Does phasing-out Russian gas require new gas
infrastructure?
1.3.2 Additional European clean energy investments provide the best path
forward to ensure full security of supply for a Russian gas phase-out
As demonstrated in the previous section, the existing infrastructure already allows for a complete
phase-out of Russian gas with limited supply issues in Finland and the Baltics region.
This section identifies the best path forward to reach complete security of supply and strengthen
resilience while ensuring that Europe stays on track with the climate ambition of the Fit-for-55
package.
Artelys Crystal Super Grid is used to compare investment strategies and identify the least-cost one.
Jointly with the energy system operation, the model optimises the investments in a set of technology
options (that depends on the scenario to be assessed). The model performs a system cost
minimisation, which covers the investment cost and fixed operation cost of the optimised
technologies, as well as the fuel, CO2, and loss of load costs for all assets. It results in the set of optimal
capacities for considered technologies that minimises total system costs and maximises social-welfare.
Two investment strategies are considered and compared, namely:
• “Gas solutions” scenario: investing in Floating Storage and Regasification Units (FSRUs), i.e.
LNG storage ships with onboard regasification capacity5. Proponents of FSRUs underline the
fact that they could be dismantled quite easily once they have served their purpose.
• “Clean energy solutions” scenario: additional investments in energy efficiency, electrification,
renewables and flexibility solutions.
These two investment strategies solve security of supply issues, as shown Figure 5.
5
FSRUs are chosen for their short investment cycles that make them plausible within the 3-year timeline of the
study. Standard LNG terminals are unlikely candidates for 2025
8/17Does phasing-out Russian gas require new gas
infrastructure?
Figure 5 – Number of hours of loss of load per country in the Gas solutions and Clean energy solutions scenarios
Under the first investment strategy studied, the modelling conducted shows that a single investment
in gas infrastructure is cost-efficient, in Finland:
• Only one investment into an LNG terminal provides additional gas supply capacity in the
Finland-Baltics region (where cross-border capacity is not congested), hence solving the
security of supply issues experienced from the Russian gas phase-out.
• The new LNG terminal proposals currently being put forward – in Germany, Italy, Poland6 –are
thus found to be unnecessary from a security of supply point of view. If added, these assets
would quickly end up as stranded assets.
• New investments in gas import capacity could put Europe at risk of locking gas in its system
for decades as these projects tend to feature 15 to 20-years long-term supply contracts.
• An FSRU strategy is likely to be short-sighted as the EU27 gas demand is expected to drop by
an additional 68 bcm between 2025 and 2030, as foreseen under a Fit-for-55 policy pathway.
LNG being among the expensive supply sources, these projects in particular imply stranded
asset risks.
6
See 1.1
9/17Does phasing-out Russian gas require new gas
infrastructure?
Clean energy investments are more cost-efficient to secure Europe’s energy supply and reduce
emissions in the long-term. In particular, the model shows that a large set of renewable investments
is cost-efficient when Russian gas is phased-out:
• A combination of supply-side and demand-side measures reduce the reliance on LNG
compared to what would happen in the gas solutions scenario (Figure 6).
• The acceleration of investments allows for the reduced operation of coal and lignite power
plants compared to the gas solutions scenario (Figure 7), resulting in a reduction of European
power sector CO2 emissions of 77 Mt. Overall, CO2 emissions decrease by 187 Mt in the clean
energy solutions scenario compared to the gas solutions scenario (including the 110 Mt CO2-
emissions reduction resulting from energy efficiency and electrification measures).
• From a total system cost perspective, a clean energy solution scenario is cheaper for the
European energy system than a gas-based solution scenario (Figure 8), as investments in
renewables, energy efficiency and electrification are outweighed by decrease in LNG and coal
supply cost, and as well as CO2 emissions.
Figure 6 – Evolution of European gas supply and demand: clean energy against gas solutions
Reading note: The clean investment scenario allows for a 51 bcm reduction of LNG imports. This
reduction is compensated by lower gas-to-power demand (renewable-based generation), energy
efficiency measures and demand electrification.
10/17Does phasing-out Russian gas require new gas
infrastructure?
Figure 7 – Evolution of the electricity generation mix: clean energy against gas solutions
Reading note: In the clean energy scenario, carbon-intensive electricity generation decrease by 92 TWh.
Renewable generation increase by 233 TWh, half of the increase being dedicated to meet additional
electricity demand (electrification)
Figure 8 – Evolution of total system costs: clean energy against gas solutions
Reading note: Additional electrification and energy efficiency increase investment costs by 34 bn €. On
the gas supply side, lower LNG imports reduce gas supply cost by 30 bn €. Eventually, lower operation
of carbon-intensive power plants saves 6 bn € of CO2 cost.
11/17Does phasing-out Russian gas require new gas
infrastructure?
Exposure to global LNG markets
Both scenarios rely on LNG supply as part of the solution to phase-out Russian gas. Yet, LNG supply
volumes are twice as high in the gas solutions compared to the clean energy solutions, resulting in
a significant exposure to global LNG markets and price variability.
For instance, when exposed to a 50%-LNG price increase, the European energy system faces a 30 bn
€ supply cost increase in the gas solutions (resp. 15 bn € in the clean energy solutions). The average
European gas supply price increases by 25% in the gas solutions (resp. 16% in the clean energy
solutions).
12/17Does phasing-out Russian gas require new gas
infrastructure?
Bibliography
Artelys. (2022). Artelys Crystal Super Grid. Retrieved from https://www.artelys.com/crystal/super-
grid/
Bellona, EMBER, RAP, E3G. (2022). EU can stop Russian gas imports by 2025.
ENTSO-E, ENTSOG. (2020). TYNDP 2020.
European Commission. (2020). SWD(2020) 176 final - Climate Target Plan Impact Assessment.
European Commission. (2021). EU Reference Scenario 2020.
Eurostat. (2022). Retrieved from https://ec.europa.eu/eurostat
Global Energy Monitor. (2022). Europe Gas Tracker Report.
International Energy Agency. (2022). Data tools. Retrieved from IEA: https://www.iea.org/data-and-
statistics/data-browser/?country=WEOEUR&fuel=CO2%20emissions&indicator=TotCO2
13/17Does phasing-out Russian gas require new gas
infrastructure?
2 Annex
2.1 Fit-for-55 scenario
For the purpose of this assessment, a baseline scenario has been built as the starting point. The
framework assumptions build on the TYNDP 2020 National Trends scenario for 2025 (ENTSO-E,
ENTSOG, 2020), from which we adopt fuel prices, electricity generation mix, gas supply mix and
infrastructure, electricity and gas demand structure.
In order to reflect the Fit-for-55 decarbonation ambition, renewable capacities and energy demands
(including gas) have been updated according to the European Commission’s MIX scenario for 2025
(European Commission, 2020).
In addition to the Member States of the European Union, 7 neighbouring countries are included in the
modelling scope to capture their interactions with the EU Member States. These 7 countries
are Bosnia-Herzegovina, Montenegro, Norway, North Macedonia, Serbia, Switzerland, and the United
Kingdom.
Figure 9 – Pan-European energy model in Artelys Crystal Super Grid, Baseline scenario
In the main model runs, the LNG import price is assumed to reach 60 €/MWh. In order to assess the
results robustness to a set of LNG price scenarios, sensitivities with LNG prices between 38 €/MWh
and 150 €/MWh (closer to current market prices) have been performed, with minor impacts on
investment costs, lignite and coal use, and CO2 emissions.
EU ETS carbon price has been increased to 80 €/t to reflect current trends on European markets.
According to Eurostat, the 2019 gas consumption is shared between the transformation sector (32%,
for electricity and distributed heat generation), industry (21%) and buildings (36%). Non-energy
consumption accounts for a minor share of total gas demand.
14/17Does phasing-out Russian gas require new gas
infrastructure?
The gas supply mix is evolving quite considerably between 2019 and 2025, with reduced indigenous
production, higher imports from North Africa, and the commissioning of the trans-Adriatic pipeline
(TAP). Simultaneously, gas demand shrinks considering the Fit-for-55 scenario, resulting in close-to-
zero LNG imports.
In the 2025 scenario, Russia exports 151 bcm of gas to Europe.
Others
2%
Households Electricity and
26% heat generation
32%
Commercial &
public services
10% Refineries
4%
Transport
1% Final non-energy
consumption
Industry
4%
21%
Figure 10 – Gas demand by sector (EU27+UK), (Eurostat, 2022), 2019
2.2 Methodology to establish the solutions runs
15/17Does phasing-out Russian gas require new gas
infrastructure?
Main assumptions
Cost of capital 4%
Gas solutions
LNG terminals Investment costs: based on recent PCI list average cost for FSRUs
Potential: investment projects are considered only in countries with the objective of
developing a terminal in the next years
Clean energy solutions
Renewables • Investment costs: REF20 (European Commission, 2021) technology assumptions
(reference database for the EU scenarios). Average between 2020 and 2030 cost
assumptions.
o Wind onshore - medium resource area, medium height
o Wind-offshore - shallow waters, near-shore, high resource area
o Solar PV - commercial and industrial - medium resource area
• Potential:
o Onshore and offshore wind: a 10%-increase compared to Fit-for-55 levels
is allowed
o Solar PV: maximum potential derived from Solar Power Europe figures
Energy Energy efficiency and electrification figures derived from (Bellona, EMBER, RAP, E3G, 2022)
demands
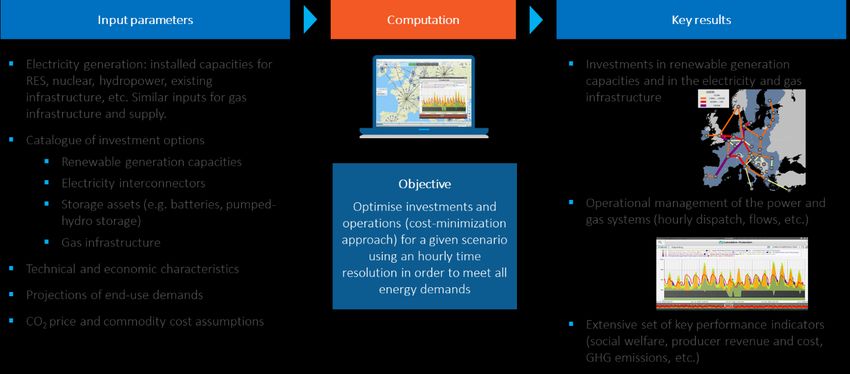
2.3 Artelys Crystal Super Grid overview
Artelys Crystal Super Grid (Artelys, 2022) is a multi-energy model covering in high granularity (in time
and technological detail) the entire European energy system, representing each Member State and
relevant neighbouring countries (one node per country). In this assessment, gas and electricity are
included in the energy system model.
Artelys Crystal Super Grid allows to perform the joint gas and electricity hourly dispatch simulation
(over the duration of an entire year, i.e., 8760 consecutive time-steps per year). The result consists of
the hourly utilisation for the different energy vectors of all national generation, storage, sector
coupling and cross-border capacities (as well as demand side response assets for electricity).
In addition, Artelys Crystal Super Grid can jointly optimise the investments in a large number of
technologies together with the dispatch optimisation of the hourly demand-supply equilibrium. Both
these capabilities (simulation and investment optimisation) have been used in this assignment.
16/17Does phasing-out Russian gas require new gas
infrastructure?
Figure 11 – Modelling approach in Artelys Crystal Super Grid
17/17You can also read