Progress and Opportunities in the Rapidly Expanding Solar PV Market
←
→
Page content transcription
If your browser does not render page correctly, please read the page content below
Progress and Opportunities in the
        Rapidly Expanding Solar PV Market
                           Eicke R. Weber

                           Co-Chair, European Solar Manufacturers Council ESMC
                           Prof. emer., Dept. of Materials Science, UC Berkeley
                           Director emer., Fraunhofer Institute for
                           Solar Energy Systems ISE

                           InterSolar Middle East
                           Video Stream: January 26, 2021
Graphic: Primolo

                           Eicke R. Weber                                     1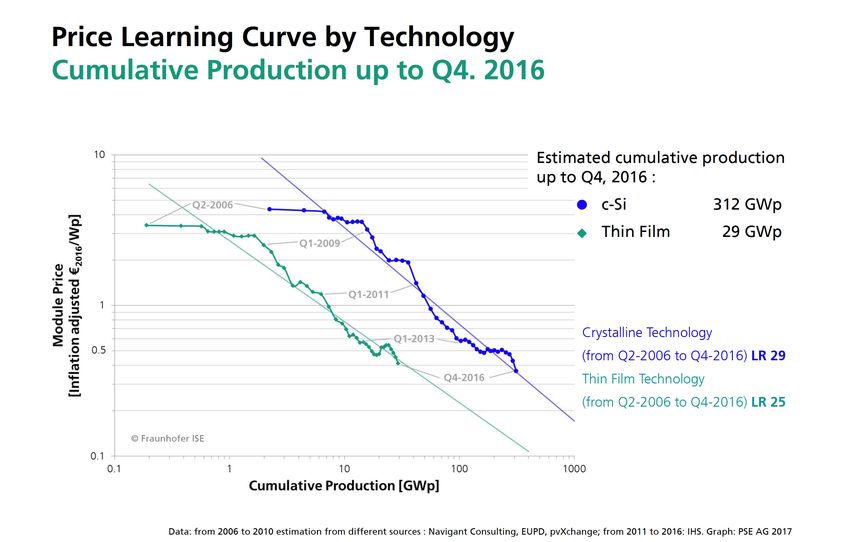
Primary Energy Demand 2015 - 2050

                                                   (renewable)

Source: LUT/Mercator Study 2019

      09.03.2021                  Eicke R. Weber                 2
Primary Energy Supply 2015 - 2050

Source: LUT/Mercator Study 2019

      09.03.2021                  Eicke R. Weber   3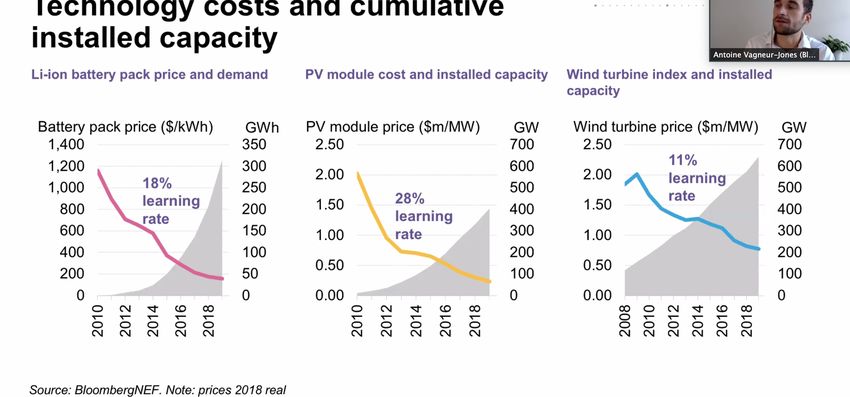
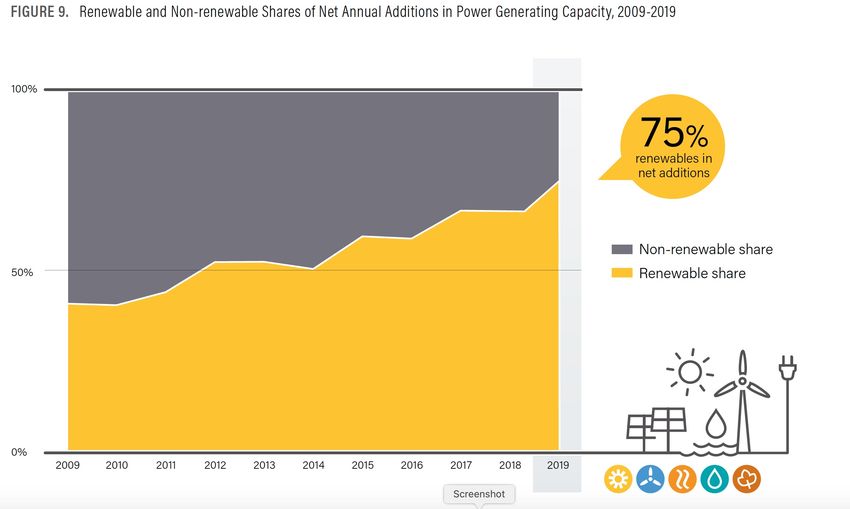
RE and non-RE Shares of Annual Additions in Power Generation 2009-2019

 Source: REN21 Global Status Report 2020
Global Growth of PV Installations 1992 – 2019
       From 0.1 GW 1992 to 627 GW 2019: CAGR of 38%!

                                                                       Source: Wikipedia: Global PV, accessed Feb 5, 2020
                                                                    Source: Wikipedia: Global PV, accessed Feb 5, 2020
08.09.2020                                         Eicke R. Weber                                                           5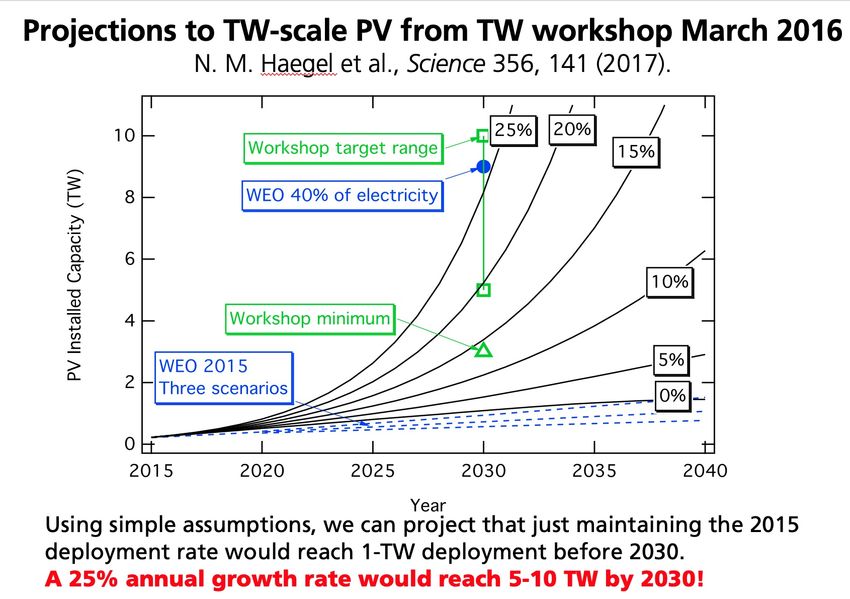
PV Heading into the Terawatt Range – this is a Disruption!
• Rapid introduction of PV globally is fueled by the availability of
  cost-competitive, distributed energy
• In 2050 or before between 4.000 and 30.000 GWp PV will be installed!
• By 2020, about 700 GWp have been installed!

We are just at the
beginning of the
global growth curve!

                                                          Source: IEA 2014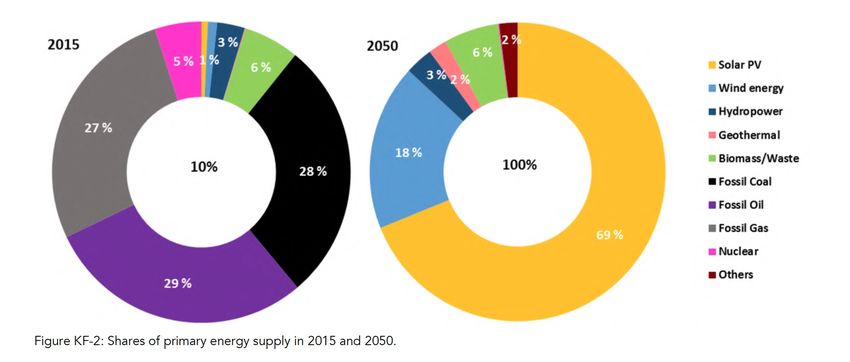
Price-Experience (Learning) Curves of PV Technologies
Crystalline-Si vs. Thin Film Technologies
Price-Experience Curve of Photovoltaics since 1980
Includes all Commercially Available PV Technologies

 - Driven by Innovation and Market Growth!

                                                  Learning Rate:
                                                  Each doubling of globally installed capacity results in price reduction of 24%!
                                                  - By a factor of 100 in 40 years – about -12% p.a.!

                                                                                                              PV Modules today:
                                                                                                            20 ct/ Watt and less!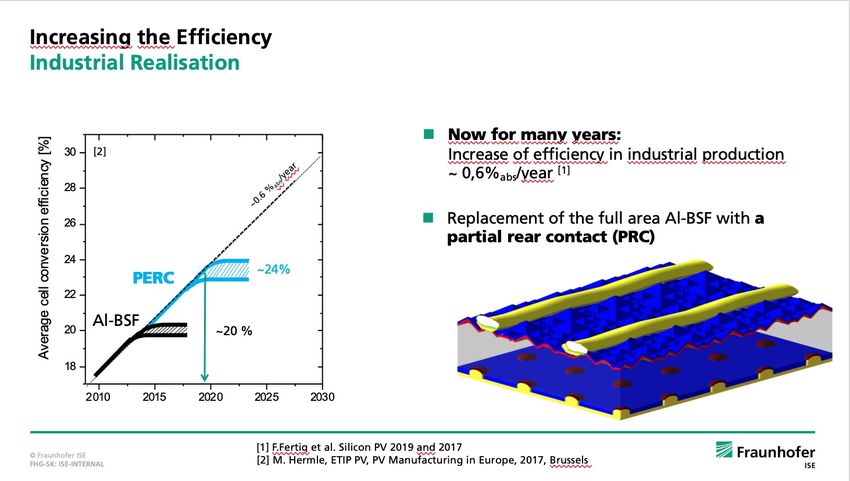
PV Production by Technology:
          Percentage of Global Annual Production

                                                                                                                              Production 2019 (GWp)
                                                                                                                                 Thin film     7.5
                                                                                                                                 Multi-Si     39.6
                                                                                                                                 Mono-Si      89.7

                                               © Fraunhofer ISE

Slide courtesy A. Bett, Fh-ISE 2020, data from 2000 to 2009: Navigant; from 2010: IHS Markit. Graph: PSE Projects GmbH 2020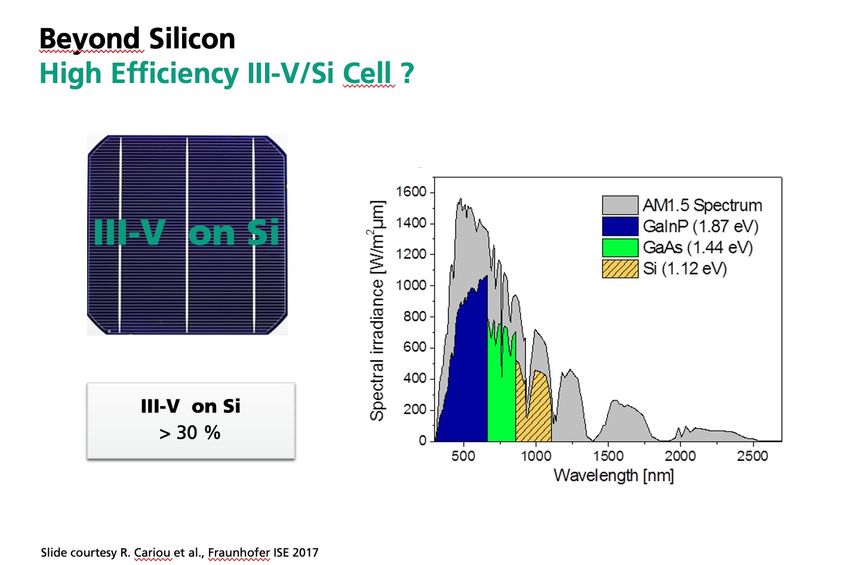
Slide courtesy A. Bett, Fraunhofer ISE 2020
Crystalline Silicon Technology Portfolio
      c-Si PV is not a Commodity, but a High-Tech Product!
     material quality
      • diffusion length                  material                                                                        module efficiency
                                          quality
      • base conductivity
                                                                                                                BC-     21%
                                                                                                                HJT
     device quality                                                                                       IBC-BJ
      • passivation of surfaces                                                                             HJT         20%
                                                                                                   MWT-
      • low series resistance                                                                      PERC
                                                                                                                        19%
      • light confinement                                                               PERC
                                                                                                                        18%
     cell structures
                                                                Industry
      • PERC: Passivated Emitter                                                                                        17%
         and Rear Cell                                          Standard
                                                                                                          16%
      • MWT: Metal Wrap Through                                                       15%
                                                             14%                                             device quality
      • IBC-BJ: Interdigitated Back
         Contact – Back Junction
                                                       Adapted from R.Preu et al., EU-PVSEC 2009
      • HJT: Hetero Junction Technology

08.09.2020                                           Eicke R. Weber                                                                           11
Advanced c-Si PV Cell Technologies
Passivated Emitter and Rear PERC1 Heterojunction on Intrinsic layer HIT3
Passivating Layer Local Contacts
1Blakers et al., Appl. Phys. Lett. 55, pp. 1363-5, 1989
Interdigitated Back Contact/Junction IBC-BJ4
Metal Wrap-Through MWT-PERC2
Lightly Doped Front Diffusion Texture+passivation Layer
Metal Wrap Through Contact
Passivating Layer
2Dross et al., Proc. 4th WCPEC, 2006, pp. 1291-4
3 Sanyo/Panasonic 4 Sunpower
Slide courtesy Fraunhofer ISE
09.03.2021 Eicke R. Weber 12Slide courtesy A. Bett, Fraunhofer ISE 2020 09.03.2021 Eicke R. Weber, Co-chair ESMC 13
Slide courtesy Fraunhofer ISE

09.03.2021                            Eicke R. Weber   14
Slide courtesy A. Bett, Fraunhofer ISE 2020
Slide courtesy A. Bett, Fraunhofer ISE 2020
Perovskite tandem photovoltaics on silicon
                                                19
Perovskites-on-Silicon Tandem Cells

                    Left: Schematic illustration of a perovskite/silicon
                    tandem cell. Right: Light enters through the perovskite
                    cell, where mostly the visible part of the solar spectrum
                    is absorbed. Near-infrared light is transmitted to the
                    silicon cell where it is absorbed
           Perovskite solar cells having high efficiency with tunable bandgap
           have great potential for tandem application with silicon solar cells.

         J. Phys. Chem. Lett. 2016, 7, 161−166
         http://pvlab.epfl.ch/page-124775-en.html                                      19
                                                                     Slide courtesy N. Mathews, ERI@N, NTU 2017
20
* PEROVSKITE-SILICON CELLS
Perovskites-on-Silicon Tandem Cells
Work in progress...proposed for SinBeRISE-2
Cell Voc (V) Jsc (mA/cm2) Fill Factor(%) Efficiency (%)
Perovskite top cell 0.94 20.1 75.0 14.2
c-Si cell stand-alone 0.62 39.2 71.7 17.4
c-Si cell filtered 0.45 15.0 63.8 4.3
4-terminal tandem 18.5
Silicon cells provided by from SERIS, NUSPV Module Production by Region 1997-2019
Percentage of Total MWp Produced
Data up to 2009: Navigant Consulting; since 2010: IHS Markit. Graph: PSE Projects GmbH 2020
Eicke R. Weber 21Levelized cost of electricity
Solar power rapidly becomes the lowest-cost way to provide
electricity in many regions of the world!
2020: already below 1.5 ct/kWh, $ 15/MWh in sun-rich areas!!
Source: Fraunhofer ISE (2015): Current and Future Cost of Photovoltaics.
Study on behalf of Agora EnergiewendeSlide courtesy S. Schindele, Fraunhofer ISE 09.03.2021 Eicke R. Weber 24
09.03.2021 Eicke R. Weber 25
Learning curves: Batteries, PV and Wind

09.03.2021                    Eicke R. Weber   26
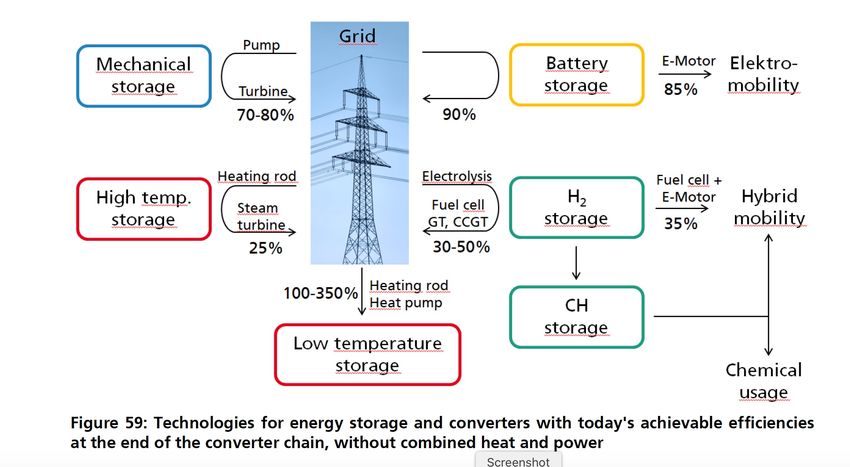
Energy Storage Efficiencies

Source: Fraunhofer ISE PV Report (2019)

 09.03.2021                               Eicke R. Weber   27
Progress and Opportunities in the
Rapidly Expanding Solar PV Market
• In response to the climate problem, and driven by the low cost and ubiquitous availability of PV power, PV is
  developing to be the key pillar of our future energy system!
• PV has become the lowest-cost way to produce electricity in many countries, a rapidly growing element of
  the electricity supply, driven by Gigawatt-scale production, smart incentives and technical innovations!
• We expect the global PV market to grow rapidly, from the current 120 GW/yr towards 500GW/yr,
  1,000GW (1 TW)/yr!
• PV installations will grow within this decade from the current 700Gigawatt installed globally to 3.000-5.000
  GW of PV, 3-5 Terawatt.
• For 2050, we expect global PV installations of 30 - 50 TW!
• Si-wafer based PV technologies, currently more than 95% of the total PV production, are experiencing
  exciting technology improvements , from transitioning to PERC and HJT and other high-efficiency
  technologies, to tandem structures exceeding the 30% efficiency limit. Exciting research to be done!
• The central component of the PV value chain, solar cells, today nearly 100% are imported from Asia (China)!
  We can expect multi-GW scale PV cell&module production to be established in many parts of the world!
You can also read