Planning Commission Presentation | April 14, 2021 - City of ...

Page created by Hector Swanson
 
CONTINUE READING
Planning Commission Presentation | April 14, 2021 - City of ...
Planning Commission Presentation | April 14, 2021
Planning Commission Presentation | April 14, 2021 - City of ...
Today’s objectives

1. Share community input on housing.
2. Review and discuss strategies.

                                       2
Planning Commission Presentation | April 14, 2021 - City of ...
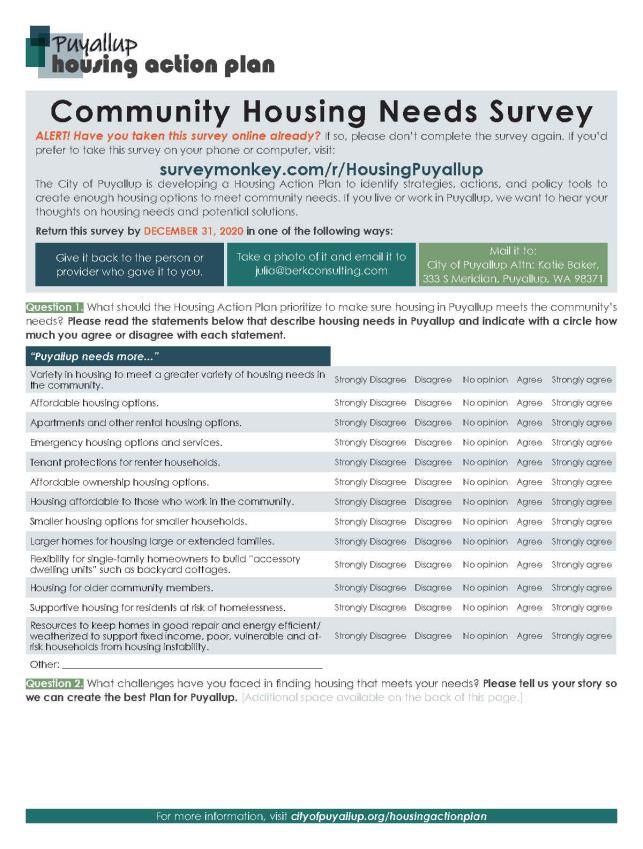
Community Input on
Housing: Findings
Planning Commission Presentation | April 14, 2021 - City of ...
Housing Action Plan Process
                                    We Are Here

 Fall 2020            Winter 2021                  Spring 2021                  July 2021

  Clarify and      Identify strategies             Create an
quantify housing      and policy                 implementation
    needs              solutions                      plan                 Housing Action
                                                                                Plan
                                                                            Review and
                                                                             Adoption
        Engage community and stakeholders

                                           The final Housing Action Plan will
                                         include strategies identified during
                                                      this process.

                                                                                            4
Community Input Activities

▪ Interviews
▪ Community
  Survey
▪ Ideas Wall

                             5
Key Findings
Overall Growth and Demand                                            Quotes
                                                                     • “This exercise will make the most
▪ Vacancy rates are too low.                                           sense if it is carried out in the
▪ Interest in increasing density.                                      context of a larger vision for the
Rental Market                                                          city.”
▪ Rents are unaffordable for households with lower incomes.          •   “There is a struggle to find units
Homeownership Market                                                     within multifamily and find
▪ Homeownership feels unattainable for many residents.                   affordable single-family units.”

Demand for Smaller Units                                             •“Race is embedded in this
▪ Significant interest in ADUs and DADUs.                             conversation. The issue of housing
                                                                      exists at the intersection of
Need for housing type variety                                         economics, environment and
▪ Existing housing stock does not meet residents’ diversity of needs. equity.”
Barriers or Equity Implications
▪   Additional hardships for BIPOC, people with disabilities.
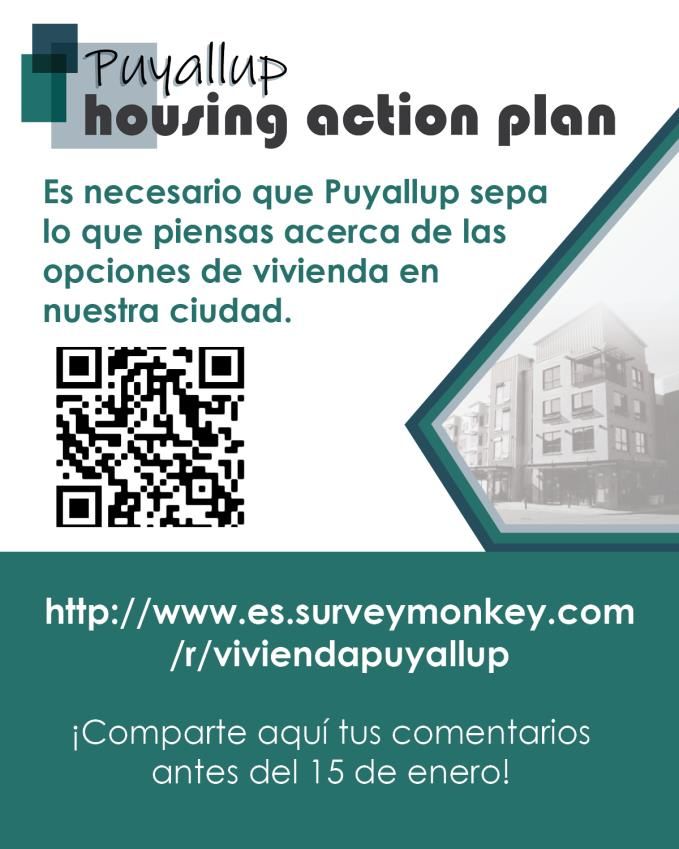
                                                                                                              6
Survey Distribution
▪ November 9, 2020 through
  January 15, 2021.
▪ English and Spanish.
▪ Primarily online, with paper
  versions distributed via
  service providers.
▪ Publicized through
  community groups and
  Spanish media (print, online,
  and radio).
▪ Narrated videos on city
  website.

                                  Above: Spanish print ad, English print survey, and Spanish online banner.

                                                                                                              7
Survey Respondents
                             Survey Respondents’ ZIP Codes
▪ 534 survey respondents.    of Residence (512 responses)

                                           Other
 ❑   96% live in Puyallup.                  5%
                                   98375
                                    8%
 ❑   36% work in Puyallup.                           98371
                                                      28%
                               98373
                                13%

                                 98372
                                                   98374
                                  23%
                                                    23%

                                                             8
Demographics: Who responded?
      Race and Ethnicity                                                                                                 Age
      ▪ No major differences in responses when                                                                           ▪ The survey overrepresents the cohort
        disaggregated by race or ethnicity.                                                                                from 35 to 49 years of age.
                                                                                                                         ▪ No youth (under 18 years of age)
   Race or Ethnicity of Survey Respondents (480 responses)                                                                 responded to the survey.
                                            0%     10%         20%     30%    40%    50%   60%   70%      80%     90%

                                   Asian          4%
                                                  4%
                                                                                                                           Age of Survey Respondents (523 responses)
                                                                                                                         45%
                                                  4%                                                                     40%
              Black or African American                                                                                                                                  41%
                                                 2%
                                                                                                                         35%
                       Hispanic or Latino                10%
                                                        8%                                                               30%

                                                   4%                                                                    25%
      Native American or Alaska Native                                                                                                                27%
                                                 1%                                                                                      24%
                                                                                                                         20%
                                                  2%                                                                                                        21%                             20% 20%
Native Hawaiian or other Pacific Islander                                                                                15%                                                   19%
                                                 1%
                                                                                                                         10%
                                   White                                                                          85%
                                                                                                                82%       5%                                                                                   10% 9%
                                                                                                                                                                                                                                    2%   7%
                                                                                                                                    0%
       Other, Two or More, Self-describe                  12%                                                             0%
                                                        9%
                                                                                                                                Under 18 or 20*    18-34 or 20-34*         35-49              50-64             65-74           75 or older

                                    Survey Respondents               Puyallup Residents                                                                        Survey Respondents         Puyallup Residents

     Sources: American Community Survey B02001 5-Yr Estimates, 2018; BERK, 2021.                                        Sources: American Community Survey S0101 5-Yr Estimates, 2014-2018; BERK, 2021.
     Note: Survey respondents could select multiple races or ethnicities. Census data used for citywide                 * Available citywide data and the survey used different age brackets for youth. The survey used the brackets “Under
     demographics does not allow selection of multiple races or ethnicities.                                            18” and “18 – 34,” whereas citywide data uses brackets “15-19” and “20-24.” All other data brackets are identical.

                                                                                                                                                                                                                                9
Respondent Priorities
 What survey respondents want the HAP to Prioritize (534 responses)                                       0%         20%     40%         60%        80%       100%

                                                 Housing affordable to those who work in the community.              42%                31%         8% 9% 9%

                                                                Affordable ownership housing options.                45%                28%         8% 10% 9%
Resources to keep homes in good repair and energy efficient/weatherized to support fixed income, poor,
                                              vulnerable and at-risk households from housing instability         35%                   36%          13% 7% 8%

                                                                              Affordable housing options.             47%               22%     4% 14% 13%

                          Variety in housing to meet a greater variety of housing need in the community.         37%               26%        6% 16%      15%

    Flexibility for single-family homeowners to build “accessory dwelling units” such as backyard cottages      33%               25%         18%     11% 12%

                                                          Smaller housing options for smaller households.       29%              29%          16%     13% 12%

                                                  Supportive housing for residents at risk of homelessness.     32%              25%         13% 13%      18%

                                                                Emergency housing options and services.         33%              22%      15% 12%         19%

                                                                  Housing for older community members.         22%          26%          22%        20%    10%

                                                            Apartments and other rental housing options.       22%         20%    10%     20%          28%

                                                                Tenant protections for renter households.      24%         17%      22%         16%     20%

                                                    Larger homes for housing large or extended families. 18%     15%      28%         25%                 12%
                                                          Strongly agree      Agree      No opinion     Disagree    Strongly disagree

                                                                                                                                                             10
Respondent Solutions
Survey respondents’ opinion on the viability of potential housing solutions (532 responses)

                              Ensure existingEnsure
                                              housing
                                                    existingishousing
                                                               in good       condition
                                                                      is in good condition                                 70% 70%                       16%            16%
                                                                                                                                                                       14%             14%

                      Providing support for older
                                     Providing supportcommunity      members
                                                       for older community members                                        67% 67%                        22%           22%
                                                                                                                                                                       12%              12%

  Providing support
               Providingfor  working
                         support          families
                                 for working          who
                                             families who areare  paying
                                                              paying         a large
                                                                     a large share of their
                                                                                                                       66% 66%                         15%            19%
                           incomes for housing and fixed income households                                                                                           15%              19%
 share of their incomes for housing and fixed income households

           Helping households whohouseholds
                            Helping face barriers
                                            who faceto access
                                                     barriers       housing
                                                              to access housing                                       62% 62%                      18%           18%20%             20%

                         Building and preserving dedicated affordable housing units.                                57% 57%                  15%
      Building and preserving   dedicated affordable housing units.                                                                                          15% 28%            28%

                  Protecting residents from being displaced or forced out of their current
  Protecting residents    from being displaced    housing
                                                          or forced out of their                                51%                        22%                   27%
                                                                                                                      51%                              22%                      27%
                               current housing
               Building a greater diversity of housing other than single family homes, such
    Building a greater     diversity of     housing other than single family
                                        as attached housing units.
                                                                                                               49%                     18%                     33%
                                                                                                                     49%                           18%                        33%
               homes, such as attached housing units.
                                                      Increasing the overall supply of housing.               45%                    20%                       34%
                                  Increasing the overall supply of housing.                                         45%                          20%                          34%

                                                                                              0%    10%    20%      30%     40%     50%    60%    70%     80%    90%  100%
                                                                                               0%      10%     20%        30%     40%       50%     60%      70%     80%            90%       10
                                This is a good solution that should be considered.    No opinion/Unsure    This is not a good solution and should not be considered.
                       This is a good solution that should be considered.            No opinion/Unsure        This is not a good solution and should not be considered.

                                                                                                                                                                               11
Goals &
Strategies
Goals of the Housing Action Plan

   1. Livability       2. Attainability*                3. Supply &Variety        4. Equity             5. Stability

Promote livable       Preserve the                      Build a diverse      Remove barriers        Encourage housing
neighborhoods.        affordability and                 range of new         and constraints        for people
                      quality of existing               housing.             that limit access to   experiencing
                      housing.                                               housing.               homelessness, older
                                                                                                    adults, and people
                                                                                                    with disabilities.

                   * Preferred term to affordability.

                                                                                                                       13
Preliminary Priority Strategies
1. Explore strategic rezones in areas to allow more density and
   missing middle housing types.
2. Explore residential infill pilot program.
3. Consider incentives for attainable housing.
  ▪   Provide fee waivers for affordable housing
  ▪   Provide expedited permitting for developments with attainable set-
      aside housing units.
4. Expand MFTE program
  ▪   Outside of downtown core to South Hill Regional Growth Center
      and/or River Road Mixed Use Center and other areas.
5. Make strategic infrastructure investments.

                                                                       14
Second Priority Strategies
1. Review existing zoning districts and approval processes.
   ▪ streamline site plan and SEPA review thresholds, design review.
2. Make it easier to build ADUs by revising standards and creating pre-
    approved plans.
3. Expand City support for housing services and programs:
   ▪  Programs to repair credit and help with first and last deposit.
   ▪  Down payment assistance
   ▪  Need-based rehabilitation assistance.
4. Encourage permanent supportive housing.
5. Support mobile home parks.
6. Use surplus or city-owned land for attainable housing.

                                                                          15
Third Priority Strategies
1. Consider actions to preserve existing attainable housing
   ▪ Track affordable rental properties facing expiring affordable
     housing use.
   ▪ Adopt a Notice of Intent to Sell / Sale Ordinance.
   ▪ Pursue strategic acquisition and financing of existing multi-family
     housing.
2. Consider an affordable housing bond/trust fund.
3. Adopt Just Cause eviction protections.
4. Consider developer agreements to require inclusion of diverse housing
   types, flexible space or affordable housing units.

                                                                           16
Discussion Questions

▪ Do these seem like the right priority strategies?

▪ Any other strategies to consider for prioritization?

                                                         17
Top Priority
Strategies
Next Steps
Upcoming Milestones
▪   Early May – Draft Plan for public review
▪   Early May – Online Open House and survey to collect
    public comment
▪   May 26 Planning Commission meeting

                                                          19
You can also read