Outlook for Advertising, Marketing and Data 2022: The Rally Will Continue Bruce Biegel, Senior Managing Partner - Amazon S3
←
→
Page content transcription
If your browser does not render page correctly, please read the page content below

Outlook for Advertising, Marketing and
              Data 2022:
      The Rally Will Continue
             Bruce Biegel, Senior Managing Partner
                       January 20, 2022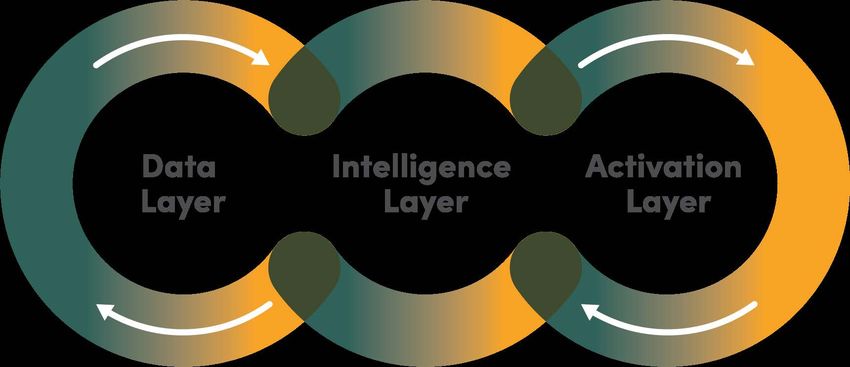
About
     Winterberry Group
     Winterberry Group is a strategic
     consultancy specializing in
     advertising, marketing, data,
     technology and commerce.

    With our deep industry, operational
    and M&A expertise we bridge
    strategic growth and tactical
    execution.

    Our market insight and intelligence
    provides unprecedented speed to
    action. Through our highly
    collaborative approaches, we
    enable knowledge transfer and
    actionability, giving our clients a
    competitive edge and driving
    increasing employee, client and
    shareholder value.

2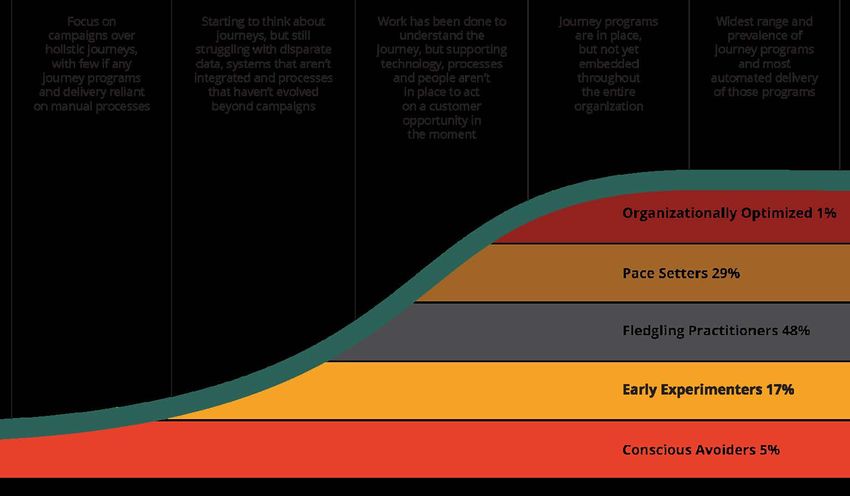
Looking Back at 2021: US Economy
Rebounds; Marketing Investment
          Accelerates
What a Difference a Year Makes

                                        US Marketing Spend Growth Benchmarked to GDP Growth
                                                             2019 – 2022P
                                                                                         21.5%
                                                                                                 Forecast
            US Advertising/ Marketing
            Spend Growth
            Benchmark:
            2x GDP Growth
            US GDP Growth
                                                                                                        11.8%

                                          4.4%
                                                                                         5.5%
                                                                                                            3.9%
                                           2.3%
                                           2019                           2020           2021               2022P
                                                                                 -3.4%
                                                                                 -4.8%

4   Source: Winterberry Group Spend Estimates (2022), S&P Global (2021)
Review 2021: The COVID Recession of 2020 Led to an Advertising
    Onslaught in 2021
                                                        US Annual Advertising and Marketing Spend
                                                                    2018 – 2021 ($BB)
                                                                                                       $436.3

                                                                $377.0
                          $361.2                                                              +21.6%
                                                                                   $358.9

                                                       +4.4%
                                                                          -4.8%

                             2018                                2019               2020                2021

5   Source: Winterberry Group Spend Estimates (2022)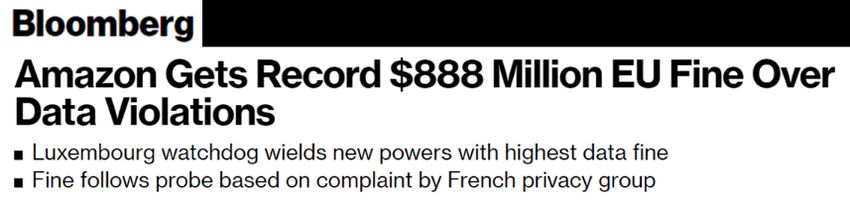
Review 2021: Spend Not Only Eclipsed 2019 Levels, Analysts –
    (including WG) Missed Forecasts With Continuous Growth Revisions
                                            US Marketing Spend on Offline and Online Channels
                                                            2018 – 2021 ($BB)                 CAGRs (2018-2021):

                                                                                                                      +6.5%
                                                                                                     $436.3           TOTAL

                            $361.2                           $377.0
                                                                                 $358.9

                                                                                                     $240.4           +23.5%
                             $127.7                          $152.9
                                                                                 $176.7

                                                                                                                      -5.7%
                             $233.6                          $224.2
                                                                                 $182.2              $196.0

                              2018                            2019                2020                2021

                                                       Offline Marketing Spend    Online Marketing Spend      Total

6   Source: Winterberry Group Spend Estimates (2022)
Review 2021: Spend on Offline Channels, Mostly Flat Pre-COVID
    Revised for 4Q20 Upward Revisions, Rebound Significantly In 2021
                                                         US Offline Marketing Spend, 2021 ($BB)
                                                                     Total: $196.0BB
                                                       Shopper Marketing
                                         +11.0%
                                                             $21.6

                                                                                                        Linear TV
                                                                                                                       -3.2%
                                                                                                          $60.1

                                 Experiential/Sponsorship
                  +27.6%
                                           $36.1

                                                                                 +7.6%
                                                                                                         Addressable TV      +33.2%
                                                                                                              $2.9

                             +9.0%         Traditional Outdoor
                                                   $7.1                                                   Radio     +16.8%
                                                                                                          $11.9

                                                                                                    Newspaper       -6.1%
                                                                                                       $7.0
                                                                   Direct Mail
                                                          +10.4%
                                                                      $41.9              Magazine
                                                                                           $7.5       -8.1%

7   Source: Winterberry Group Spend Estimates (2022)
Review 2021: Direct Mail Volumes Rebounded From a Low in 2020
With A Ramp in 2Q21 and Continuing for the Balance of the Year
Direct Mail Volumes
2018 – 2021
82,290,525
77,801,778
70,220,148
67,048,102
-5.5% +4.7%
-13.8%
2018 2019 2020 2021
8 Source: USPS (2021)Under-The-Numbers: Acquisition Mail Up 14.6%, Now Accounts for
80% of Mail; Loyalty/Cross-Sell Gains Off-Set Systemic Declines
Percent Change in Acquisition and Retention For Marketing Mail
2019 – 2021
-23.0%
+14.6%
• Acquisition mail approaching 2019 volumes
after 14.6% growth in 2021
• Follow-up (-25.7%) and renewal mailing (-23.4%)
experiencing the sharpest declines across
-16.1%
+7.9% retention formats
• Cross-sell (14.1%) and loyalty (10.1%) mailing
leading the surge in retention mail’s 2021
comeback
2019 2020 2021 Source: Mintel/ Comperemedia
Acquisition Retention
9 Source: Comperemedia (2021)Review 2021: Shift to Video Formats Across Channels was the
Prime Catalyst; Marketers Follow the Digitally Engaged Consumer
US Online Marketing Spend, 2021 ($BB)
Total: $240.4BB
+33.3% Paid Social Video Game
Advertising +22.9%
$58.6 +43.1%
$5.0 Influencer
CTV/ Streaming
+59.9% $4.6
$14.4
Email/SMS +10.8%
$5.7
Digital Audio (Radio/
+17.0% Podcasts)
$5.6 Display +15.8%
$14.1
+36.0%
Digital Out-of-Home
+19.9% $3.1
Digital Video
+46.2%
$41.0
+39.1% Search
Affiliate Network
$84.7
Fees
+27.8%
$3.4
Source: Winterberry Group Spend Estimates (2022)
10
Note: Display refers to banner ads that appear on desktop; affiliate network fees exclude media and platform costsReview 2021: Data, Identity, Services and Platforms Spend All Saw
Robust Expansion, Gaining Share As a Percent of Media to 12.3%
US Spending on Data, Identity, Data Services and Platforms, by Channel, 2021 ($BB)
Total: $29.3BB
TV (Linear,
Addressable and CTV) +34.5%
$4.3
Digital Media and
+46.7%
Web Personalization
$13.6
+26.4%
Direct Mail
Email $8.2 +4.5%
+11.9%
$3.2
Source: Winterberry Group Spend Estimates (2022)
11 Note: ‘Web Personalization’ includes web and app; ‘Digital Media’ includes display, video and paid social; ‘TV’ includes linear, addressable and CTV; ‘Data, Identity, Data Services and Platforms’ includes analytics (modeling,
measurement and attribution), spend on CRM, CDP and DMP platforms, database management and hygiene, excludes cloud hosting services2021 M&A: A Record 4,050 M&A and Investment Transactions
Totaling $373.0BB in Value, up in Both Categories From 2020
M&A and Investment Activity, 2021 ($BB)
Marketing, Media and Technology Industries (# of Transactions)
Marketing
Technology
Total deal value $98.1
increased 148.2%, (1,543)
up from $150.3BB
in 2020 Digital Agency & Marketing
Media/Commerce Services
$201.8 $12.1
(1,571) (441)
Activity increased
41.9%, up from Traditional Media
2,855 deals in 2020 $31.3
Digital Advertising (329)
$29.7
(166)
12 Source: CG/Petsky Prunier (2021)2021 M&A Themes: Focus on CX, Creative, Programmatic and Retail
Media
Agency Holding Companies Data and Technology Private Equity
2021 Mar 2021 July 2021 Mar 2021 Nov 2021
Acquired & Consolidated:
Acquired Acquired Acquired
Acquired
&
Into “.Monks” for $500MM for $1.4BB
Jul 2021 Jul 2021 Oct 2021 Nov 2021 Aug 2021
Acquired
Acquired Merges with Acquired Investing in
for $250MM
Aug 2021 Dec 2021 Dec 2021 Sept 2021
&
Announced to Acquires
Acquired Announced to
Completed merger as acquire
for $380MM For $5BB, rebrands as Yahoo
13Macro Trends : What’s Driving the Market
Trend: Accelerating Focus on More Integrated, Holistic Experiences

                      Consumers expect consistent and exceptional
                       experiences. To meet expectations, brands are
     Trend

                          increasing focus—and spend—on digital
                        experiences, platforms and personalization.

                           Marketers seek acceleration of omnichannel
                        integration; going beyond digital transformation and
             Impact

                         customer experience to a holistic brand experience
                      requires faster “de-silo-ization” of marketing, servicing and
                                              supply chains.

15
Trend: The Need for Consistent Content Everywhere
In an ”always on” world, consumers demand
quality content at scale across channels.
Trend
Brands focus on speed to content, quality
control and cost.
All creators of content have to consider the who and
where before the what—thinking downstream utilization
Impact
at the point of creation, building and delivering assets
across formats and touchpoints.
16Trend: Rise of Connected Commerce and Retail Marketplaces
The concept of DTC has changed: digital and
physical shelves are integrating inventory, BOPIS
Trend
and BORIS while brands are simultaneously
reallocating spend across upper and mid-funnel,
focusing on retail and other media marketplaces.
Retail media ad spend projected to double from $20BB
in 2020 to $40BB in 2022; not just about AMZN, WMT, TGT
Impact
and BBY—marketplaces can be regional, national and
cross- border, forcing the media conversation towards
outcomes from impressions.
17 Source: eMarketer (2021)Trend: Finding Balance in a More Regulated, Privacy-First World
Privacy and data regulation
accelerates. Regulators, browser
changes, consumer choice impact
Trend
targeting and attribution.
It’s about direct relationships in a
first-party world.
Does identifier deprecation matter?
Impact
Its about control, competition and
choice. No national privacy legislation
this year—but an activist FTC.
18Trend: Linear & Advanced TV - Colliding and Converging
The growth of connected video consumption across
places, channels and devices is about seeking higher
Trend
engagement. Video spend expected to reach $130BB in
2022 across linear, digital video and CTV—where 72%
of marketers see growth.
Reaching the consumer across any device or platform
will continue to drive consolidation of media providers
Impact
and demand to integrate buying—improving the ability to
manage reach/frequency and transforming
measurement.
19 Source: Mediaocean (2021)Trend: Influencer Marketing in Transformation Still Seeks Brand
Suitability, Measurability
Who owns the influencer relationship between
creative, paid media and digital commerce with
Trend
the rise of social commerce happening? A
convergence of influencer and affiliate marketing.
With $11BB in 2022 spend, its about speeding the path-
Impact
to-purchase, shortening the buying cycle and enabling
social commerce. How hard will it be to manage
experience, creators, suitability, safety and measurement?
20Trend: The B2B Digital Shift Continues Its Accelerated Expansion
From 2019 to 2020, B2B digital spend grew 50%
year over year and another 29.4% increase in
Trend
2021. B2B eCommerce is expected to grow at a
17.9% CAGR and hit $1.9 trillion by 2023—doubling
from 2019
B2B performance marketing will reach ~$30BB this
year. Demand generation and ABM continue to be top
Impact
of mind with an increasing adoption of programmatic
intent. Content consumption up by 20%, and the focus
is on reach, quality and privacy.
21 Source: eMarketer (2021)Trend: Do you Get Gaming? Real Life and the Metaverse
There are 227MM video game players
(consumers) in the US spending nearly $180BB
in 2021 across mobile, console and PC. In-game
Trend
ads are still primarily mobile as brands partner
with gaming providers to capitalize on the next
digital frontier.
Advertising in video games is expected to reach $5.8BB
in 2022. Building worlds in the Metaverse is not new,
Impact
though this, along with NFTS, AR/VR and immersive
experiences, are the next big thing—but hardware has to
catch up.
22 Source: Entertainment Marketing Association (2021), Newzoo (2021)Trend: The Great Resignation and Talent Supply Chains
In 2020 they were let go, retired, sent home, saved
by government subsidy and taken off the road. In
Trend
2021 many decided not to come back (or come
back differently…and more expensively).
2022 is still very much about talent—it is about the right
Impact
skills, having enough people to manage profitable growth
with consideration for DEI, ESG, WFA (work from
anywhere), in-house, on-shore and offshore.
23Data, Data Services & Data
Technology: Fast Times in the Data
WorldA (Re)View of The Data-Technology Relationship
At the data layer, customer and At the intelligence layer, marketers At the activation layer, marketers and
prospect data is ingested, and advertisers leverage advertisers use applications and
consolidated and standardized customer profiles to drive insights, platforms to communicate across
with the end goal of using the data gain audience intelligence and outbound (email, display or Advanced
for analysis and activation inform a range of marketing and TV) and inbound (website, app, or
advertising decisioning-related use customer service) channels.
cases
25 Source: Winterberry Group’s ‘Demystifying Decisioning & Orchestration’ (2020)Identity: Losing Identifiers, the Race to First Party Relationships
and Contextual Rising
The delay of cookie deprecation pushed out
transformation, yet with Apple iOS, ATT (along
with Edge, Firefox, etc.) and state-based
privacy regulation, cookies are going away
anyway.
Identity marketing solutions, platforms and
services spend reached $5.44BB in 2021—
nearly 2x 2018 spend.
The ID market continues to evolve based on
privacy and ecosystem adoption, but going
forward 4 primary solutions are likely to be
leveraged:
• First-party cookies
• Email centric identifiers (UIDs)
• Cohort solutions (FLOCS and other birds)
• Contextual solutions
26 Source: Winterberry Spend Estimates (2022)
Note: ‘Identity solutions’ reference ID data for activation and measurement and include spend on data, resolution and data management (including clean rooms and related services)Data Management: Adoption of CDPs, Clean Rooms and an
Improved Data Layer Integration
Fueled by the transformation of marketing
data use cases and channels, spend on data
technology reached $7.9BB in 2021, a 35.2%
increase from 2020.
Market consolidation and rapid growth will
continue through 2022 as the CDP
(frequently adjacent to a CRM) becomes the
hub of personalization, activation and
measurement.
Implementation and management skills
shortages may hamper brands’ ability to fully
leverage their investments.
27 Source: Winterberry Group Spend Estimates (2022)
Note: ‘Identity technology solutions’ include spend on CDPs, DMPs and CRM solutionsPutting the Layers Together: Customer Journey Management
A strategic approach to understanding an
individual’s need in the moment, in order to
meet that need as early as possible, and in the
most convenient manner for the individual
28 Source: Winterberry Group’s “The Evolution of Customer Journey Management, For Marketing and Beyond” (2021)And How Should We Think About Customer Journey Use Cases?
Campaign Centric Journey Centric
Basic Communications Optimization of Prospect Journey
Optimization and Orchestration of
Omnichannel Communication
CX
Optimization of Abandoned
Personalization of Customer Service
Journeys
29The Customer Journey Management Curve: We Are Very Early
Source: Winterberry Group’s “The Evolution of Customer Journey Management, For Marketing and Beyond” (2021)
30
Note: n=156 brand marketers and marketing decision-makersIs It the Year of Attribution Yet?
Spend on analytics, from prescriptive and
predictive through measurement and
attribution, eclipsed $7.5BB in 2021, up
$1.0BB (16.7%) from 2020.
Attribution is still near the top of everyone’s
wish list yet faces headwinds…
• Losing identifiers continue to pressure MTA
• Walled garden “black holes”
• Evolving standards in “TV/CTV”
• Insufficient analytics talent
31The Changing Needs of Measurement and Attribution
Marketing Measurement Hierarchy Measurement and Analytics Approach
Marketing Mix
Understand path to purchase Modelling (MMM)
Holistic View Quantify the impact of
and the customer journey different marketing channels
and tactics (the marketing
mix) on financial outcomes
over time
Multichannel Assign credit and optimize
Attribution marketing spend
Integrates MMM and MTA for
Unified Measurement
a holistic view
Campaign ROI Brand lift, sales, etc.
Quantify the impact of
marketing activities on
metrics associated with
granular conversion events to
Audience Reach Who did we reach? guide decisions about future
Multi-Touch marketing spend
Attribution (MTA)
32Outlook for Spending 2022: Following the Money
Outlook 2022: High Probability for Solid Growth, With Marketing
     Ad Spend Up Double Digits For Second Consecutive Year

      • US GDP growth is estimated at 3.9%,
        continuing the de-acceleration of growth
      • Fed will give the US a series of interest rate
                                                                            US Advertising and Marketing Spend
        hikes, designed to combat the effects of                                     2019 – 2022P ($BB)
        inflation—a number expected to grow at 3.5%
        (Democrats) or 7% (Republicans),                                   Year    Spend ($BB)   YoY Growth (%)
      • The FTC is going to keep the pressure on
        “controlling” the major social and ad                              2019       $377.0
        platforms in the name of privacy and                                                         -4.4%
        competitive markets
                                                                           2020       $358.8
     Outlook Dependencies:                                                                           21.6%
      • COVID vaccine penetration and the next wave’s                      2021       $436.3
        impact on employment
                                                                                                     11.8%
      • Easing of supply chain challenges                                  2022P      $487.8
      • Global macro-economic and political risk
      • Mid-term elections—just how nasty this time?

34   Source: Winterberry Group Spend Estimates (2022), S&P Global (2021)
Trend: VC and PE Have Loaded Up With Cash—Making for Another
Year of Active M&A
VC funds raised $130BB in capital: investments
Trend
were $349BB and exits reached $177BB in 2021.
Valuations rose throughout the year and the supply of
available capital is higher than ever—market pullbacks
Impact
for internet related equity (Platforms, Adtech, MarTech),
could put valuations under pressure eventually.
35 Source: Pitchbook-NVCA Monitor (2022)Outlook 2022: Linear Gets a Boost from Election Cycle, DM Benefits
from Omnichannel Commerce
US Offline Marketing Spend, 2022P ($BB)
Total: $207.6BB
Shopper Marketing
+7.4%
$23.2
Linear TV
+3.5%
$62.1
+16.8% Experiential/Sponsorship
$42.2
+5.9% Addressable TV +27.4%
$3.6
Radio
Traditional Outdoor +3.9%
+15.0% $12.4
$8.2
Newspaper
-9.1%
$6.3
+3.5% Direct Mail Magazine
$43.4 $6.2 -17.2%
36 Source: Winterberry Group Spend Estimates (2022)Outlook 2022: More Digital Tailwinds as Continued Corporate Profit
Growth Fuels Investment—More Video All the Time
US Online Marketing Spend, 2022P ($BB)
Total: $280.3BB
+14.1% Video Game Influencer +51.3%
Advertising $7.0
+15.1% Paid Social $5.8
$67.4
Email/SMS +7.1%
$6.1
+32.3% CTV/ Streaming Display +9.9%
$19.1 $15.5
Digital Video
Digital Audio +23.1%
+11.9% +16.6% $50.4
(Radio/ Podcasts)
$6.3
Digital Out-of-Home
+14.2% Affiliate Network Fees
$3.6 +15.6%
$4.0
+12.3% Search
$95.2
Source: Winterberry Group Spend Estimates (2022)
37
Note: Display refers to banner ads that appear on desktop; affiliate network fees exclude media and platform costsOutlook 2022: Fueled By Digital Tailwinds, Enhanced Omnichannel
Data Solutions- Identity and Data Spend Sees Strong Growth
US Spending on Data, Identity, Data Services and Platforms, by Channel, 2022P ($BB)
Total: $33.1BB
TV (Linear,
+19.2%
Addressable and CTV)
Digital Media and $5.1
Web Personalization
+18.3%
$16.1
+13.1%
Direct Mail +3.5%
$8.5
Email
+7.4% $3.5
Source: Winterberry Group Spend Estimates (2022)
38 Note: ‘Web Personalization’ includes web and app; ‘Digital Media’ includes display, video and paid social; ‘TV’ includes linear, addressable and CTV; ‘Data, Identity, Data Services and Platforms’ includes analytics (modeling,
measurement and attribution), spend on CRM, CDP and DMP platforms, database management and hygiene, excludes cloud hosting servicesOutlook 2022: Adding Another $50BB, Driven By Economic
Expansion—Have We Reached Peak Growth and Transformation?
US Marketing Spend on Offline and Online Channels
2019 – 2022P ($BB) CAGRs (2019-2022E):
+8.9%
TOTAL
$487.8
$436.3
$377.1 $358.9 +22.4%
$280.3
$152.9 $240.4
$176.7
-2.5%
$224.2 $196.0 $207.6
$182.2
2019 2020 2021 2022P
Offline Marketing Spend Online Marketing Spend Total
39 Source: Winterberry Group Spend Estimates (2022).
Thank you.
Bruce Biegel, Senior Managing Partner
bbiegel@winterberrygroup.com
(212) 842 – 6030
winterberrygroup.com
@WinterberryGrp
London New York MiamiYou can also read