Top players in the European AV industry - Ownership and concentration 2021 Edition - Coe
←
→
Page content transcription
If your browser does not render page correctly, please read the page content below

Top players in the European AV industry
       Ownership and concentration
       2021 Edition

                                Laura Ene (Author)
                                Agnes Schneeberger (Contributor)
                                January 2022

A publication of the European Audiovisual Observatory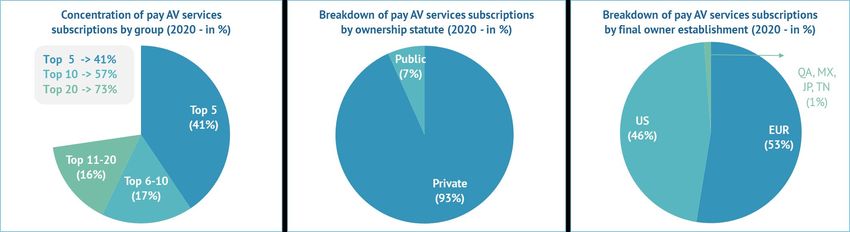
Table of Contents Key insights Methodology Key indicators Operating revenues structure for top 100 AV groups in Europe Pay TV market structure by subscriptions in Europe SVOD market structure by subscriptions in Europe Pay AV services market structure by subscriptions in Europe Broadcast service market structure by number of TV channels in Europe On-demand service market structure by number of platforms in Europe AV services market structure by number of TV channels and ODAS in Europe TV market structure by audiences in Europe TV fiction market structure by number of titles produced in Europe Cinema market structure by number of screens in Europe Additional Methodological Notes
Key insights

  The top 100 audiovisual companies in Europe showed some resilience to the COVID-19 pandemic
  which has been accelerating pre-existing market trends. Their cumulated operating AV services
  revenues grew slightly more (+7.7% over 2016 at the end of 2020) than average inflation and the
  overall market. This was due to several factors:

                            Not all market segments have been equally impacted. Players whose business models are
                            primarily based on pay TV and public funding proved more resilient. Those relying on
                            advertising were more severely affected.

                            The SVOD market has been thriving, significantly boosting the revenues of SVOD players
                            across the board. Cumulated revenues of the pure SVOD players (Netflix, Amazon and DAZN)*
                            among the top 100 audiovisual companies quadrupled over the five-year period, comprising
                            7% of cumulated revenues for the top 100 at the end of 2020.

  *No separate data on European operations was available for Apple TV+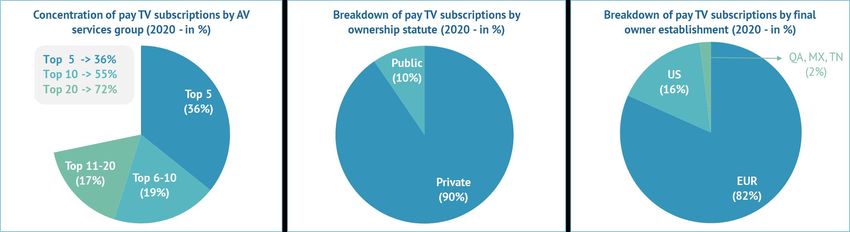
Key insights
The top 100 developed against a very dynamic backdrop of M&A and divestment activities pushed up
by the streaming wars and the pandemic crisis.
Consolidations helped bolster the top 100 companies’ revenues
These consolidations followed different rationales: obtaining more, premium content at
competitive prices, seeking to pair that content with strong distribution, or just eyeing
access to new markets. The players moved horizontally (i.e. acquisition of TVN by Discovery
in the takeover of Scripps Network Interactive, acquisition of Fox International Channels and
NGC Europe by Disney in the takeover of 21st Century Fox, acquisition of Sanoma’s Dutch
unit by DPG Media), and vertically (i.e. acquisition of TV4 Media by Telia, acquisition of CEME
by PPF Group), as well as in the direction of market extensions (i.e. acquisition of TDC
Norway by Telia, acquisition of DNA by Telenor, acquisition of Forthnet and Vivacom by
United Group) in a quest to strengthen market positions.
At times these consolidations impacted the audiovisual sector indirectly since they were
primarily telco-driven (i.e. acquisition of UPC operations in Europe from Liberty Global by
Vodafone). These were more generally moves designed to build strong convergent telco
offers or to feed content into platforms or simply to expand to new territories.
Conversely, a series of divestments were also registered between 2016 and 2020, with several
actors refocusing on their strongholds, be these core businesses or key territories (i.e. MTG
transformation into a global digital entertainment company, Kinnevik turning to their primary
telco business, Grupo Prisa accelerating the digital transformation, Sanoma transforming into a
learning and cross-media company).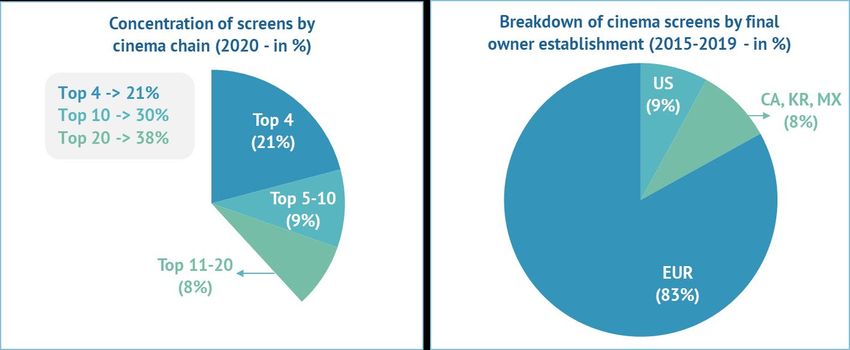
Key insights

   Moreover, the structure of the top 100 audiovisual groups in Europe by operating AV revenues
   experienced several significant evolutions between 2016 and 2020:

      Public players saw their weight in revenues diminish between 2016 and 2020 (down by 3% to
      31%). Although not too strongly affected by COVID-19, PSB revenues decreased over the same
      period by 0.4% in real terms. Also, these players were not part of the consolidation game.

      Overall, the revenues of the traditional players have more or less stagnated, while the growth of
      the top 100 players was largely driven by the new SVOD players. Traditional telco players kept
      their share of the top 100 revenues stable over the five-year period (around 16%), while
      traditional broadcasters lost 5% in weight (down to 77% at the end of 2020). By contrast, pure
      SVOD players namely Netflix, Amazon and DAZN, accounted cumulatively for more than 75% of
      the revenue growth registered between 2016 and 2020 at the top 100 level.

      Concentration levels remain largely the same among the top 100 European AV groups by
      operating revenues over the analysed period. Over the five-year period, the top 20 players
      consistently accumulated between them around 70% of top 100 revenues. This percentage would
      have risen to 85% were it not for the PSBs weakening concentration.

      The private European AV sector tends however to be less concentrated than the US one. The top
      five private European AV players account for 53% of top 20 revenues as opposed to 62% for
      players on the US market.
Key insights
Significant changes have been also registered from a geoeconomics perspective:
The weight of US interests in top 100 revenues has increased (by +4% up to 31% in 2020) due to
the rise of the pure SVOD players. US-backed AV players in Europe particularly stand out in the
private sector where they comprised 44% of the main players’ revenues at the end of 2020. Two
thirds of the US share were accounted for by Sky, Netflix, Amazon and DAZN.
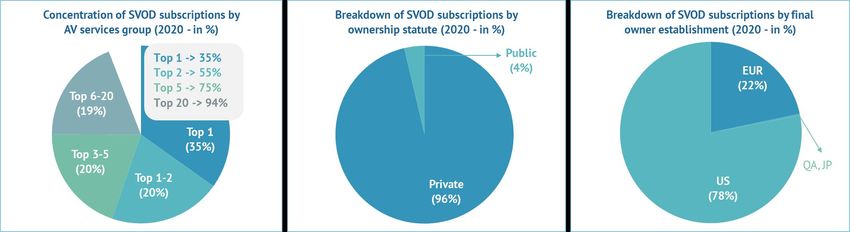
The share of US interests is by far the highest in the SVOD market, with around four in five
subscriptions signed off by a US-backed OTT platform. By contrast, pay TV remains largely a
European-driven business (US-backed companies account for only 16% of subscriptions).
US interests are less significant as regards TV audiences (only 11% of viewing time) as most of the
main national broadcasters are still controlled by European interests. However, US-backed
broadcasters are likely to claim a larger share of advertising as PSBs are bound to access only a
limited share.
Nevertheless, US groups have managed to roll-out a large range of thematic channels and
catalogues all over Europe, which is reflected in a comparatively higher share by number of TV
channels (19%) and on-demand services (25%) operated in Europe. Discovery, Sky, ViacomCBS and
Disney are the top four networks in Europe by number of TV channels, while Discovery and Disney
also rank among the top four groups by number of on-demand services.Key insights
Even if US-backed groups have started to increase their operative presence in Europe for TV
content production, their contribution as (executive) producers of European TV fiction titles is still
limited (only 6% of the total number of TV fiction titles produced in Europe between 2015-2019).
Overall, the degree of internationalisation is following an upward trend regarding US interests.
However, US players are starting to prioritise expansion by investing in direct-to-consumer
business models (chiefly SVOD platforms) and producing locally as opposed to traditional indirect
investments.
The consolidation operations have not impacted the share of US players:
On the one hand, the largest mergers and acquisitions took place primarily between already-
US-backed companies or between companies controlled by European interests.
On the other hand, there were also registered divestments of European assets by US groups
(i.e. AT&T sale of WarnerMedia's stake in CEME to PPF Group).
To a lesser extent, emergent markets such as the CEE countries have registered a more rapid
increase in revenues compared to the other regions represented in the top 100. Their share of the
top 100 revenues grew from 4% in 2016 to 5% at the end of 2020. This is likely explained by
players taking advantage of relatively stronger economic growth as well as of the opportunities
afforded by divestments of US groups regarding investment and the strengthening of market
positions. This phenomenon was rather common among the telco-driven businesses.Key insights
The top 100 AV companies in Europe by operating AV revenues are heterogeneous in terms of their
portfolio of activities:
Even if top players tend to be active in several market segments, most appear to be driven by one
leading activity. Among them, the highest-ranking ones tend to also hold a strong position in at
least one additional activity.
For broadcasters and TV packagers, diversifying into TV production seems a common strategy as,
probably, an answer to the threat of on-demand over-the-top services.
High-ranking companies in terms of audiences are relatively better represented among the top
players by revenues as opposed to players topping other market segments. However, the higher
the position occupied by a player in terms of revenues, the greater the incidence of players
ranking highest on the SVOD or TV production market.Key insights
This diversity of portfolios among the top 100 companies determines different levels of concentration
in individual market segments, as well as different levels of involvement when it comes to PSBs:
SVOD and pay TV stand out as the most concentrated audiovisual market segments in Europe. A
total of 94% of SVOD subscriptions are cumulatively signed off to top 20 OTT platforms, while
72% of pay-TV subscriptions are cumulated by top 20 pay-TV operators.
At the other end of the spectrum, the operations of TV channels and ODAS (measured in number
of services) are least concentrated, with the top 20 players cumulating around one third of each
respective market segment. The private sector operates 91% of TV channels and 97% of ODAS.
Audiences tend to be more concentrated, with the leading 20 broadcasters accounting for 56% of
viewing consumption in Europe, followed by the TV production market (measured in number of TV
fiction titles) with the top 20 production companies cumulating up to 41% of titles.Key insights
This diversity of portfolios among the top 100 companies determines different levels of concentration
on individual market segments, as well different levels of involvement when it comes to PSBs:
Even if under-represented in terms of volumes (9% of TV channels and 3% of ODAS), PSBs
accounted for one third of global viewing consumption in Europe mainly thanks to strong
generalist channels that appeal to a larger public and with almost all of them offering at least
one on-demand service at the end of 2020. Also, they are relatively better represented in the TV
production business (accounting for 16% of the total number of TV fiction titles produced in
Europe between 2015 and 2019, a lower share than that commissioned, as private broadcasters
more often internalise production).
As regards cinema, the top 20 cinema chains account for 38% of cinema screens in Europe. It
remains a largely European-driven business with only 17% of cinema screens controlled by non-
European interests (of which 9% are US-backed).Methodology
Data providers
Based on the analysis of data collected by the European Audiovisual Observatory, and data from
the Observatory’s MAVISE database, as well as data provided by Ampere Analysis, Glance and
European Metadata Group.
Scope
The scope of analysis includes 40 European countries covered by the European Audiovisual
Observatory, provided that data was available.
Indicators and definitions
Figures in the report are presented at the European group level and reflect in general the
situation for the year 2020. Exceptions: for the number of TV fiction titles, figures are cumulated
for 2015-2019, to level out variations. For 10 out of the top 100 groups for which 2020 data was
not available, 2019 and 2018 revenues were used. To analyse revenues in evolution, 2016 data
was used as a benchmark.Methodology
Indicators and definitions
The indicators analysed at the European group level are: revenues, pay-TV subscriptions, over-the-
top SVOD subscriptions, number of TV channels, number of on-demand services (ODAS), audience
share, number of TV fiction titles and number of cinema screens.
The European Audiovisual Observatory collects on a yearly basis revenue data for the main
audiovisual players in Europe by relying on desk research, corporate annual reports, companies
houses, the Amadeus database for public and private companies across Europe and data from the
EBU’s Media Intelligence Service. Revenues presented in this report have been analysed for
European groups primarily active in the AV services sector and they derive mainly from the
exploitation of these AV services (including radio). Revenues of the groups in Europe were
estimated in several cases by cumulating the revenues of their main subsidiaries. They should not
be therefore considered as consolidated results in the proper sense, as subsidiaries may have
exchanges between themselves.
Ownership information about European and final owner groups reflects the situation at the end of
2020. There has been a best-effort assessment of ownership and alignment across the different
market segments by the EAO.Methodology
Indicators and definitions
For jointly owned assets, the indicators have been equally distributed between all parties.
Market shares, concentrations and breakdowns by establishment or statute of final owner are
calculated from the total sample available or total market; these calculated indicators are not
limited to the top 20 and/or 50 showcased in this report.
When several companies rank in the same position, those companies active in several market
segments have been prioritized for inclusion in the top listings.
Considering that the data samples used for analysis are neither exhaustive nor complete, the
figures presented in this report should be regarded as indicative and not exact.Key indicators Operating revenues structure for top 100 AV groups in Europe Pay TV market structure by subscriptions in Europe SVOD market structure by subscriptions in Europe Pay AV services market structure by subscriptions in Europe Broadcast service market structure by number of TV channels in Europe On-demand service market structure by number of platforms in Europe AV services market structure by number of TV channels and ODAS in Europe TV market structure by audiences in Europe TV fiction market structure by number of titles produced in Europe Cinema market structure by number of screens in Europe
Operating revenues structure for top 100 AV groups in Europe
Top 20 European AV groups by operating AV services revenues (2020 - in mEUR)
                                                                                                                                               Market shares of AV group by (%)

                                                                                             Country of     Revenues      Top 100
 Rank                AV group               Country     Statute           Final owner
                                                                                            final owner   (EUR million)              PayTV     SVOD         # TV       # VOD         TV     TV fiction
                                                                                                                          AV group
                                                                                                                                      subs.     subs.     channels     services   audiences   titles
                                                                                                                          revenues
   1    Sky                                GB         Private     Comcast                   US                  16 279       13.3%      9.7%      1.3%         3.2%        1.6%        1.4%          0.1%
   2    ARD                                DE         Public      State of DE               DE                   6 527        5.3%                             0.3%        0.1%        3.0%          7.3%
   3    Netflix (Europe)                   NL         Private     Netflix                   US                   6 152        5.0%               34.9%                     1.5%
   4    RTL Group                          LU         Private     Bertelsmann               DE                   6 017        4.9%                1.3%         1.2%        1.1%        4.5%      3.7%
   5    BBC                                GB         Public      State of GB               GB                   5 674        4.6%                             1.3%        0.4%        2.6%      2.3%
   6    Groupe Canal Plus                  FR         Private     Vivendi                   FR                   5 498        4.5%      3.8%      0.8%         1.2%        1.9%        0.8%      1.1%
   7    ProSiebenSat.1 Media               DE         Private     ProSiebenSat.1 Media      DE                   4 047        3.3%                0.3%         0.5%        0.3%        1.9%      0.1%
   8    The Walt Disney Company (Europe)   EUR        Private     The Walt Disney Company   US                   3 876        3.2%                8.2%         2.7%        2.4%        2.1%
Pay TV market structure by subscriptions in Europe
Top 20 European AV groups by number of pay TV subscriptions (2020 - in thousands)
Market shares of AV group by (%)
Country of Subs. Top 100
Rank AV Group Country Statute Final owner
final owner (thousand) PayTV SVOD # TV # VOD TV TV fiction
group
subs. subs. channels services audiences titles
revenues
1 Vodafone GB Private Vodafone GB 20 989 10.0% 0.1% 0.5% 2.2%
2 Sky GB Private Comcast US 20 384 9.7% 1.3% 3.2% 1.6% 1.4% 0.1% 13.3%
3 Tricolor TV RU Private Tricolor TV RU 12 257 5.9% 0.3% 0.1% 0.2%
4 Rostelecom RU Public State of RU RU 10 823 5.2% 2.3% 0.1%SVOD market structure by subscriptions in Europe
Top 20 European AV groups by number of SVOD subscriptions (2020 - in thousands)
Market shares of AV group by (%)
Country of Subs. Top 100
Rank AV Group Country Statute Final owner
final owner (thousand) SVOD Pay TV # TV # VOD TV TV fiction
group
subs. subs. channels services audiences titles
revenues
1 Netflix (Europe) NL Private Netflix US 62 470 34.9% 1.5% 5.0%
2 Amazon Prime Video (Europe) EUR Private Amazon Inc US 36 507 20.4% 0.1% 1.6% 1.4%
3 Apple (Europe) EUR Private Apple Inc US 15 097 8.4% 2.2%
4 The Walt Disney Company (Europe) EUR Private The Walt Disney Company US 14 637 8.2% 2.7% 2.4% 2.1%Pay AV services market structure by subscriptions in Europe
Top 20 European AV groups by number of subscriptions to pay AV services (2020 - in thousands)
Market shares of AV group by (%)
Subs.
Country of Pay TV & Top 100
Rank AV Group Country Statute Final owner
final owner SVOD PayTV SVOD # TV # VOD TV TV fiction
group
(thousand) subs. subs. channels services audiences titles
revenues
1 Netflix (Europe) NL Private Netflix US 62 470 34.9% 1.5% 5.0%
2 Amazon Prime Video (Europe) EUR Private Amazon Inc US 36 507 20.4% 0.1% 1.6% 1.4%
3 Sky GB Private Comcast US 22 727 9.7% 1.3% 3.2% 1.6% 1.4% 0.1% 13.3%
4 Vodafone GB Private Vodafone GB 20 989 10.0% 0.1% 0.5% 2.2%
5 Apple (Europe) EUR Private Apple Inc US 15 097 8.4% 2.2%
6 Rostelecom RU Public State of RU RU 14 907 5.2% 2.3% 0.1%Broadcast service market structure by number of TV channels in Europe
Top 20 European AV groups by number of TV channels (2020)
Market shares of AV group by (%)
Country of No. of Top 100
Rank AV Group Country Statute Final owner
final owner TV channels # TV # VOD PayTV SVOD TV TV fiction
group
channels services subs. subs. audiences titles
revenues
1 Discovery Inc (Europe) EUR Private Discovery US 353 6.4% 3.9% 1.3% 3.0% 1.3% 2.6%
2 Sky GB Private Comcast US 175 3.2% 1.6% 9.7% 1.3% 1.4% 0.1% 13.3%
3 ViacomCBS (Europe) EUR Private ViacomCBS Inc US 162 2.9% 1.3% 1.6%On-demand service market structure by number of platforms in Europe
Top 20 European AV groups by number of on-demand services (2020)
Market shares of AV group by (%)
No. of
Country of Top 100
Rank AV Group Country Statute Final owner on-demand
final owner # VOD # TV PayTV SVOD TV TV fiction
services group
services channels subs. subs. audiences titles
revenues
1 Discovery Inc (Europe) EUR Private Discovery US 106 3.9% 6.4% 1.3% 3.0% 1.3% 2.6%
2 Google (Europe) EUR Private Alphabet US 90 3.3%
3 Rakuten Europe ES Private Rakuten Inc JP 74 2.7% 0.1%
4 The Walt Disney Company (Europe) EUR Private The Walt Disney Company US 67 2.4% 2.7% 8.2% 2.1%AV services market structure by number of TV channels and ODAS in Europe
Top 20 European AV groups by number of TV channels and on-demand services (2020)
Market shares of AV group by (%)
Sum of
Country of Top 100
Rank AV group Country Statute Final owner TV channels
final owner # TV # VOD PayTV SVOD TV TV fiction
and ODAS group
channels services subs. subs. audiences titles
revenues
1 Discovery Inc (Europe) EUR Private Discovery US 459 6.4% 3.9% 1.3% 3.0% 1.3% 2.6%
2 Sky GB Private Comcast US 220 3.2% 1.6% 9.7% 1.3% 1.4% 0.1% 13.3%
3 The Walt Disney Company (Europe) EUR Private The Walt Disney Company US 218 2.7% 2.4% 8.2% 2.1%TV market structure by audiences in Europe
Top 20 European AV groups by TV audience (2020 - in million hours)
Market shares of AV group by (%)
Daily total
Country of hours of Top 100
Rank AV group Country Statute Final owner
final owner viewing time TV PayTV SVOD # TV # VOD TV fiction
group
(million) audiences subs. subs. channels services titles
revenues
1 Channel One - Perviy Kanal RU Public State of RU RU 180 5.9% 0.2% 0.1% 0.2%
2 Gazprom Media RU Public State of RU RU 150 4.9% 0.4% 0.4% 0.6% 0.1% 0.4%
3 RTL Group LU Private Bertelsmann DE 137 4.5% 1.3% 1.2% 1.1% 3.7% 4.9%
4 Gruppo Mediaset IT Private Gruppo Mediaset IT 131 4.3% 0.8% 0.6% 0.2% 0.7% 2.2%
5 National Media Group RU Private National Media Group RU 120 4.0% 0.3% 0.1% 0.4%
6 RAI IT Public State of IT IT 96 3.2% 0.3%TV fiction market structure by number of titles produced in Europe
Top 20 European AV groups by number of TV fiction titles produced (2015-2019)
Market shares of AV group by (%)
No. of titles
Country of Top 100
Rank AV Group Country Statute Final owner (2015-2019
final owner TV fiction Pay TV SVOD # TV # VOD TV
cummulated) group
titles subs. subs. channels services audiences
revenues
1 ARD DE Public State of DE DE 369 7.3% 0.3% 0.1% 3.0% 5.3%
2 Banijay Group (Europe) EUR Private Banijay Group FR 236 4.7%
3 RTL Group LU Private Bertelsmann DE 186 3.7% 1.3% 1.2% 1.1% 4.5% 4.9%
4 Mediawan FR Private Mediawan FR 167 3.3% 0.3% 0.4% 0.1%
5 ITV GB Private ITV GB 140 2.8% 0.5% 0.3% 0.4% 1.8% 2.5%
6 ZDF DE Public State of DE DE 131 2.6% 0.1%Cinema market structure by number of screens in Europe
Top 20 European cinema chains by number of screens (2020)
Country of No. of cinema Market
Rank Cinema chain Country Statute Final owner
final owner screens share (%)
1 AMC Theatres (Europe) GB Private AMC Entertainment Holdings US 2 938 7.1%
2 Cineworld Group (Europe) GB Private Cineworld Group GB 2 300 5.6%
3 VUE International GB Private OPE/AIMCo CA 2 052 5.0%
5 Pathé Cinemas FR Private Pathé FR 1 360 3.3%
4 Mars Entertainment Group TR Private CJ-CGV KR 850 2.1%
6 CGR Cinémas FR Private CGR Cinémas FR 686 1.7%
7 United Cinemas RU Private United Cinemas RU 640 1.5%
8 Kinepolis Group BE Private Kinepolis Group BE 586 1.4%
9 UGC Ciné Cité FR Private UGC FR 584 1.4%
10 Cineplex DE Private Cineplex DE 560 1.4%
11 Premier Zal (Magna Tech) RU Private Magna Tech US 505 1.2%
12 Cinestar DE Private Greater Union Filmpalast DE 449 1.1%
13 Yelmo Films ES Private Cinepolis MX 400 1.0%
14 Cineplexx AT Private Constantin Film Foundation AT 347 0.8%
15 Helios PL Private Agora PL 281 0.7%
16 Showcase Cinemas (Europe) GB Private National Amusements US 275 0.7%
17 Kinomax RU Private State of RU RU 268 0.6%
18 Karo Film Management RU Private Concern Karo RU 248 0.6%
19 Nordisk Film Cinemas DK Private Egmont Fonden DK 237 0.6%
20 Omniplex IE Private Omniplex IE 231 0.6%
Download
Top 20 cinema chains
by number of screensAdditional Methodological Notes
Scope
The scope of analysis for each data set includes 40 European countries covered by the European
Audiovisual Observatory, provided that data was available.
Data sets
Revenues
European Audiovisual Observatory analysis of data collected on a yearly basis for the main
audiovisual players in Europe by relying on desk research, corporate annual reports,
companies houses, the Amadeus database for public and private companies across Europe
and data from the EBU’s Media Intelligence Service.
The analysis covers consolidated operating revenues derived mainly from the exploitation of
AV services (including radio) by the top 100 European groups for which the AV services
business is the leading activity as assessed by the European Audiovisual Observatory. Groups
not included: 1) groups mainly providing telecommunication services without details on
video revenues; 2) subsidiaries of US groups with no separate data on European operations
available; 3) groups mainly active in production and distribution of audiovisual works; 4)
cinema chains.Additional Methodological Notes
Revenues of the groups in Europe were estimated in several cases by cumulating the revenues of
their main subsidiaries. They should not be therefore considered as consolidated results in the
proper sense, as subsidiaries may have exchanges between themselves.
The figures represent revenues in EUR million, at the current rate for the year 2020. There are
several groups for which 2020 data was not available and instead 2019 data was used: The Walt
Disney Company (Europe), Discovery Inc (Europe), ViacomCBS (Europe), BeIn Media (Europe), DAZN
Group, Bauer Media, Global Media & Entertainment, NOS (NL), COPE and Warner Media.
Conversion from local currencies to EUR is based on the actual dates of the companies' fiscal year.
Additional notes for specific groups for which revenues required compilation:
The Walt Disney Company (Europe) = combined 2019 revenues of The Walt Disney Company Limited, NGC
Europe and Fox International Channels. Includes film production and distribution activities and therefore
cannot be compared to the revenues of other US studios in Europe
Discovery Inc (Europe) = combined 2019 revenues of Discovery Communications Europe, TVN SA, Eurosport
and 50% All3 Media
Vodafone = combined 2020 revenues of network video services and 25% of Sport TV Portugal
Bouygues = combined 2020 revenues of TF1 and network video services
Liberty Global = combined 2020 revenues of network video services and 50% of All3Media
Warner Media (Europe) = combined 2019 revenues of Turner Broadcasting System Europe Limited and HBO
(Europe). HBO revenues estimated by combining last available revenues of subsidiaries in the Czech
Republic, Poland, the Nordic countries, Romania, Bulgaria and Hungary.Additional Methodological Notes
NENT = combined 2020 revenues of Nent and 50% of Allente
ViacomCBS (Europe) = combined 2019 revenues of Viacom International Networks in Belgium, the Nordic
countries, Hungary, Italy and the UK, and of Nickelodeon UK, Nickelodeon International and Channel 5 UK,
and the 2018 revenues of Viacom International Networks in Germany
Altice Europe = combined 2020 revenues of network video services, Next Radio TV and 25% Sport TV
Portugal
BeIn Media (Europe) = combined 2019 revenues of BeIn Media IP, Digiturk and BeIn Connect
Telia = combined 2020 revenues of network video services and TV4 Media
Telenor = combined 2020 revenues of network video services and 50% of Allente
PPF Group = combined 2020 revenues of O2 Czech Republic and Central European Media Enterprises (as of
2020)
Gazprom Media = combined 2020 revenues of Telekompaniya NTV, Natsionalnyi Sportivnyi Telekanal, Red
Media and NTV-Plus
NOS (PT) = combined 2020 revenues of network video revenues and 25% of Sport TV PortugalAdditional Methodological Notes
PayTV
European Audiovisual Observatory analysis based on 2020 pay-TV subscription data
provided by Ampere Analysis.
SVOD
European Audiovisual Observatory analysis based on 2020 over-the-top SVOD subscription
data provided by Ampere Analysis.
TV channels and on-demand services (ODAS)
European Audiovisual Observatory analysis based on 2020 figures from the MAVISE
database.
Data is presented in number of TV channels and on-demand services, each cumulated at
European group level.Additional Methodological Notes
Audiences
European Audiovisual Observatory analysis based on 2020 audience data provided by
Glance.
The figures represent a calculated European audience market share that is comparable
across different national markets. The European audience market share per audiovisual
group corresponds to the sum of daily hours of TV channels belonging to one group divided
by total daily hours in Europe, multiplied by 100. Total viewing time in Europe corresponds
to the average daily television viewing time per person per country multiplied by the total
population per country (source EUROSTAT).
Data for Bosnia and Herzegovina is based on 2019 figures for daily audience shares and
Eurostat population numbers, and 2016 data for daily viewing time.
The data sample includes TV channels with a daily market share of at least 0.1%. The same
TV channel can be available in several national markets.Additional Methodological Notes
Production of TV fiction
European Audiovisual Observatory analysis based on European Metadata Group data on TV
fiction titles by main production company.
The figures represent TV fiction titles broadcasted between 2015-2019 and cumulated at
European production group level for the given period to level out variations for this
indicator. One “title” refers to either a TV film or a TV season. Each different TV season of a
TV series is counted as one title.
The ownership information reflects the market realities at the end of 2020.
Cinema screens
European Audiovisual Observatory data collection and analysis of estimated number of
screens by selected exhibitors in Europe at the end of 2020.
The figures represent number of cinema screens at exhibitor level in Europe.
Breakdown of number of screens by final owner establishment was calculated based on the
assumption that half of the screens for which ownership data was not available were owned
in 2020 by European exhibitors.More information: www.obs.coe.int
You can also read