MARCH 2017 - I-15 Mobility Alliance
←
→
Page content transcription
If your browser does not render page correctly, please read the page content below
CALIFORNIA NEVADA ARIZONA UTAH

I-15 CORRIDOR SYSTEM
MASTER PLAN UPDATE 2017

                                 MARCH 2017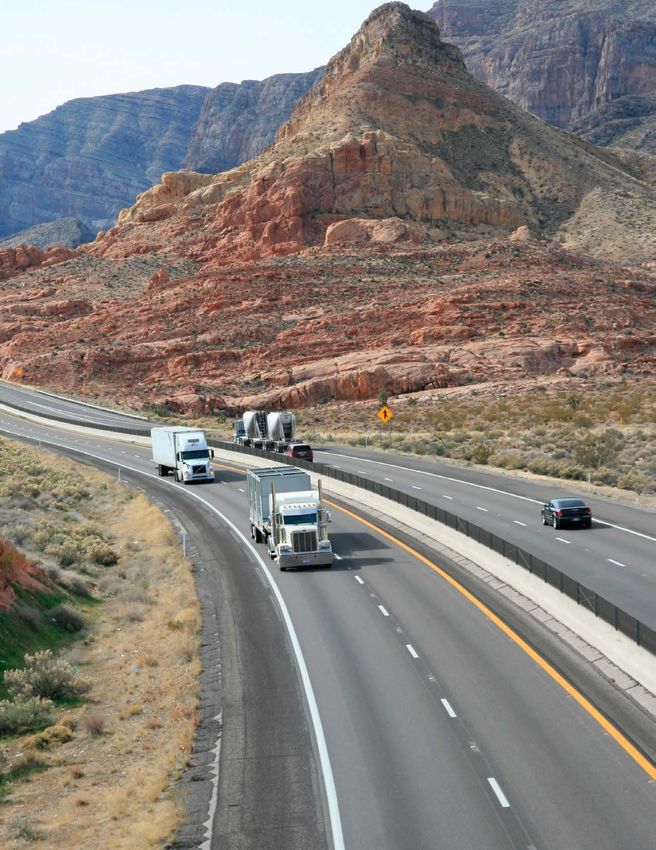
ACKNOWLEDGEMENTS
    The I-15 Corridor System Master Plan (Master Plan) is a           commerce, port authorities, departments of aviation, freight
    product of the hard work and commitment of each of the            and passenger rail authorities, freight transportation services,
    I-15 Mobility Alliance (Alliance) partner organizations and       providers of public transportation services, environmental
    their dedicated staff.                                            and natural resource agencies, and others.

    Individuals within the four states and beyond are investing       Their efforts are a testament of outstanding partnership and
    their time and resources to keep this economic artery             a true spirit of collaboration, without which this Master Plan
    of the West flowing. The Alliance partners come from              could not have succeeded.
    state and local transportation agencies, local and interstate

    I-15 MOBILITY ALLIANCE PARTNERS
    American Magline Group                       City of Orem                               Authority
    Amtrak                                       City of Provo                              Millard County
    Arizona Commerce Authority                   City of Rancho Cucamonga                   Mohave County
    Arizona Department of Transportation         City of South Salt Lake                    Mountainland Association of
    Arizona Game and Fish Department             City of St. George                         Governments

    Bear River Association of Governments        Clark County Department of Aviation        National Park Service - Lake Mead
                                                                                            National Recreation Area
    BNSF Railway                                 Clark County Public Works
                                                                                            Nellis Air Force Base
    Box Elder County                             Community Planners Advisory
                                                 Committee on Transportation                Nevada Army National Guard
    Brookings Mountain West
                                                 County of San Bernardino                   Nevada Department of Tourism and
    Bureau of Land Management                                                               Cultural Affairs
    Cache Metropolitan Planning                  Davis County
                                                                                            Nevada Department of Transportation
    Organization                                 Economic Development Corporation
                                                 of Utah                                    Nevada Department of Wildlife
    California Department of
    Transportation                               El Dorado Holdings                         Nevada Division of State Parks

    California High Speed Rail Authority         Envision Utah                              Nevada Governor’s Office of
                                                                                            Economic Development
    California Trucking Association              Federal Highway Administration
                                                                                            Nevada Governor’s Office of Energy
    Carmen Group Inc.                            Federal Railroad Administration
                                                                                            Nevada Highway Patrol
    Cedar City                                   Five County Association of
                                                 Governments                                Nevada Motor Transport Association
    City of Clearfield
                                                 Freeway and Arterial System of             Nevada State Office of Energy
    City of Fontana
                                                 Transportation                             Northern Arizona Council of
    City of Henderson                                                                       Governments
                                                 Idaho Transportation Department
    City of Las Vegas                                                                       NV Energy
                                                 Iron County
    City of Layton                                                                          Orange County Transportation
                                                 Las Vegas Global Economic Alliance
    City of Lehi                                                                            Authority
                                                 Las Vegas Metro Chamber of
    City of Murrieta                             Commerce                                   Parametrix
    City of North Las Vegas                      Las Vegas Motor Speedway                   Port of Long Beach
    City of Ontario                              Los Angeles Metro Transportation           Port of San Diego

2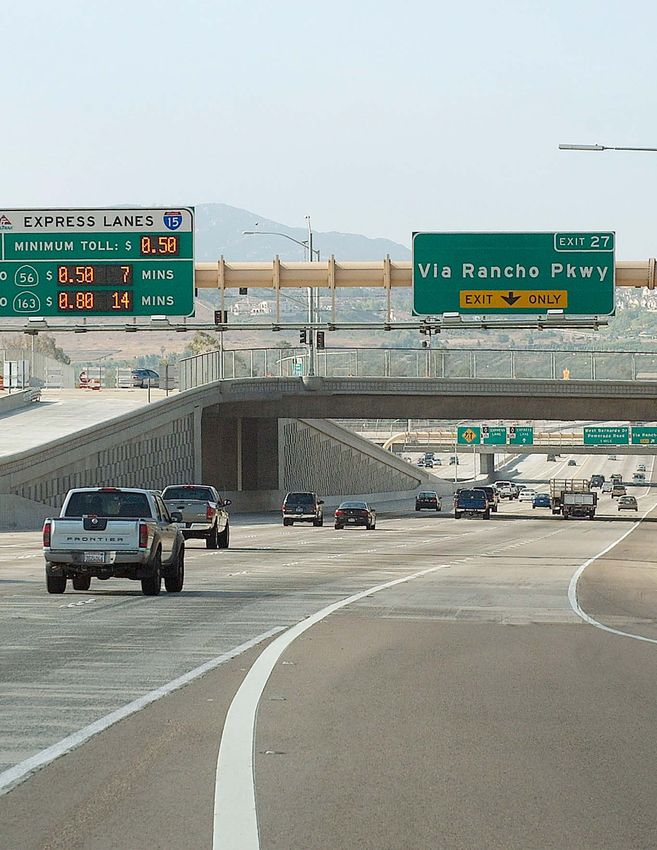
Regional Transportation Commission
of Southern Nevada                                     CONTENTS
Riverside County Transportation Commission              Acknowledgements............................................................................................ 2
Riverside Transit Agency                                 I-15 Corridor System Master Plan.................................................................... 4
Salt Lake City Chamber of Commerce                        I-15 At A Glance.............................................................................................. 5
San Bernardino County Transportation Authority
                                                           Economic Lifeline....................................................................7
San Diego Association of Governments
                                                            Background................................................................................................... 8
San Diego International Airport
                                                              Economic Lifeline Corridor....................................................................... 11
Sierra Club, San Diego Chapter
                                                               Economic Profile...................................................................................... 12
Sierra Club, Utah Chapter
Southern California Association of Governments                  Moving People.................................................................. 17
Southwest Airlines                                                Highway Travel..................................................................................... 18
State of Nevada Division of Environmental Protection               Passenger Rail...................................................................................... 20
The Toll Roads                                                      Local Transit....................................................................................... 22
Union Pacific Railroad                                               Aviation............................................................................................. 24
U.S. Army Corps of Engineers                                           Moving Goods............................................................ 27
U.S. Coast Guard                                                        Freight Overview........................................................................... 28
U.S. Fish and Wildlife Service                                           Trucking........................................................................................ 30
Utah County                                                               Freight Rail .................................................................................. 32
Utah Department of Transportation                                          Air Cargo.................................................................................... 34
Utah Transit Authority                                                      Ports of Entry............................................................................ 36
Utah Trucking Association
Wasatch Front Regional Council
                                                                              Performance Measures...................................... 39
                                                                               Measuring Progress Through Performance Measures........... 40
Washington County
                                                                                Congestion............................................................................ 42
Weber County
                                                                                  Safety................................................................................... 44
Western High Speed Rail Alliance
                                                                                   Infrastructure Condition.................................................... 46
XpressWest
                                                                                    Mobility Alliance............................................ 49
CONSULTANT SUPPORT                                                                   I-15 Mobility Alliance....................................................... 50
The consultant team of CH2M would like to recognize the tireless                      Mission Statement.......................................................... 51
efforts of the I-15 Mobility Alliance partners in providing invaluable
                                                                                        Immediate Projects of Interregional Significance ......... 52
data, resources, and assistance in capturing, analyzing, and summarizing
the technical data into this Master Plan. The consultant teams and their                 Accomplishments ........................................................ 54
specific roles in this project include:                                                   Multistate I-15 Dynamic
                                                                                          Mobility Project......................................................... 56
CH2M: Program management and partner agency coordination,
responsible for preserving the I-15 program with Alliance partners and                      Looking To The Future: Emerging Technologies...... 58
program stakeholders, maximizing visibility by promoting the corridor                        Funding And Financing: Making
on a national level, and sustaining the Alliance partnership’s competitive                   The Vision A Reality............................................... 60
advantage by capitalizing on federal grants.
                                                                                                References............................................................ 62
RCG Economics: Technical support on the economic performance and
implications of I-15 and the broader corridor.

Kimley-Horn and Associates: Project manager of the I-15 Dynamic
Mobility Project, including interface with the Alliance.

                                                                                                                                                                     3
I-15 CORRIDOR SYSTEM MASTER
                    PLAN
                    The I-15 Corridor System Master Plan defines a multi-decade multimodal transportation system
                    vision, governance, implementation strategy, and provides a prioritized program of projects
                    needed to serve all modes of transportation. Defining this vision is a regional partnership between
                    government and private interests in California, Nevada, Arizona, and Utah—the I-15 Mobility
                    Alliance. Developing a clear unified vision for the I-15 Corridor enables us to look beyond highway
                    corridor preservation and focus on regional and global competitiveness.
                    The purpose of this Master Plan is to maintain an understanding of Interstate 15 (I-15) through the Alliance
                    states (California, Nevada, Arizona, and Utah) and implement improvements to continually advance operations,
                    capacity, safety, resiliency, and access.

                    This Master Plan is meant to evaluate the corridor as a whole, and is not intended to produce a state by state
                    analysis nor to supplant the priorities established by the various agencies that form the I-15 Mobility Alliance. The
                    Master Plan tells a story of the importance of the corridor and the challenges facing it, and outlines an approach
                    for addressing these challenges, including multi-jurisdictional and interest group collaboration. Each of the five
                    chapters tells the following part of the story:

1. Economic Lifeline: defines this transcontinental corridor and provides an
   overview of its importance to the nation and local communities served by it.                                                       page
                                                                                                                                       7
2. Moving People: describes the socio-economic make-up of the adjoining
   megaregions and the opportunities and challenges of moving people between
   these major population centers via car, rail, and airplane.                                                                        page
                                                                                                                                      17
3. Moving Goods: establishes the importance of goods movement to the
   financial well-being and quality of life of those living along the corridor, and
   to the nation.                                                                                                                     page
                                                                                                                                      27
4. Performance Measures: tracks progress of improvements along
   the corridor as each state implements capacity, safety and operational
   enhancements.                                                                                                                      page
                                                                                                                                      39

5. Mobility Alliance: introduces the organizational structure and mission
   of the Alliance, and the successes achieved through collaboration.                                                                 page
                                                                                                                                      49

  4
I-15 AT A GLANCE
  • 1,434 miles of interstate highway
  • Traverses the Nation’s fastest growing regions: Arizona, Nevada, and Utah ranked in the top 10
    fastest growing states in the U.S. in 2015
  • Serves as primary access route for interstate tourism between Southern California and Las Vegas
  • Transports $95 billion of commerce annually to and from local communities and the global
    marketplace (FAF04, 2015)
  • Links 4 of the nation’s top 20 airports including top international gateways of Los Angeles International
    Airport and McCarran International Airport

       This document
    is an update to the
 initial 2012 Master Plan,
with the goal of continually
updating and capturing the
 changes as the corridor
  improves and evolves.

                                                                               This
                                                                         Master Plan only
                                                                       covers the portion of
                                                                    I-15 through the states of
                                                                California, Nevada, Arizona, and
                                                                Utah. It is hoped and anticipated
                                                                that future revisions will extend
                                                                  the corridor and expand the
                                                                   Alliance partnership north
                                                                         to the Canadian
                                                                              border.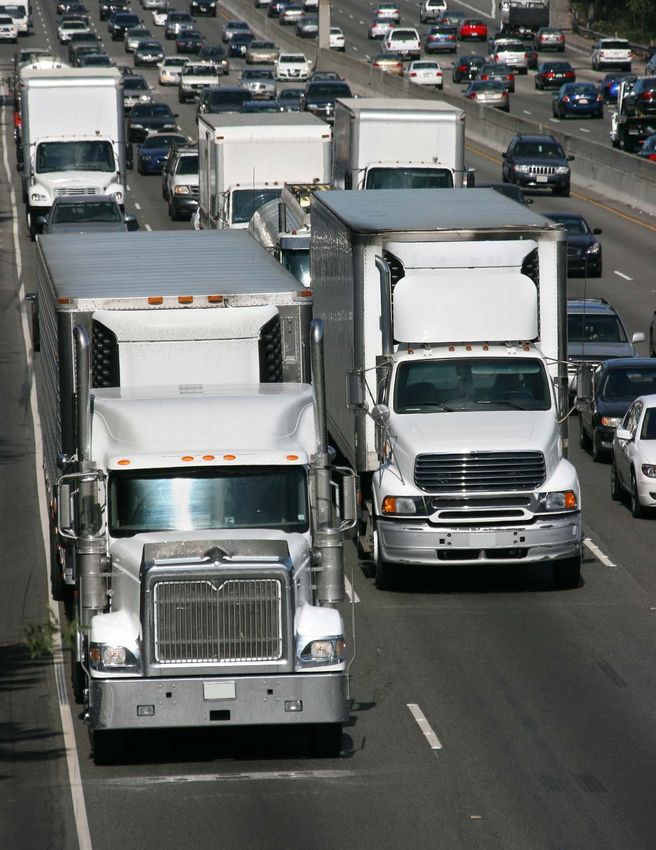

1.
ECONOMIC
   LIFELINE
BACKGROUND
                        In the western United States (U.S.), the I-15 Corridor is the spine of a
                        transportation network extending more than 1,470 miles through the
                        states of California, Nevada, Arizona, Utah, Idaho, and Montana. I-15
                        is a unique, diagonally oriented artery linking coastal ports to inland
                        population centers and connecting with major east-west corridors that
                        serve the entire U.S.
                        For much of its path, I-15 was constructed along old US Route 91, which served
                        as an international commerce route from Long Beach, California to Canada via
                        Sweetgrass, Montana. US 91 was routed on the main streets of most of the
                        communities it served, including Las Vegas Boulevard in Las Vegas and State Street
                        in Salt Lake City. I-15 began construction as an interstate highway in 1957, with the
                        segment between Los Angeles and Las Vegas opening to traffic in 1966. Much of the
                        corridor was constructed throughout the 1970s, with the final segment bypassing
                        Plymouth, Utah opening in 1990.

                        Today, the I-15 transportation corridor links the San Diego metropolitan area
                        with the Riverside-San Bernardino metropolitan area, and several other suburban
                        communities between them. Due to rapid population growth in recent years in the
                        California Mojave Desert region, I-15 has become a heavily traveled commuter
                        route between metropolitan Southern California and the communities of Victorville,
                        Barstow, Hesperia, Apple Valley and Adelanto.
                        It is also the primary access route between
                        Southern California and Las Vegas with
                        more than 25 million people driving                     Critical to the
                        this corridor annually (FHWA, 2014).                economic vitality of
                        In Nevada, I-15 is the single most             the Western United States,
                        important tourism and freight
                        corridor and is essential for                   the I-15 Corridor moves
                        southern Nevada’s economy.                  people and goods to and from
                        In Utah, I-15 is the primary
                        transportation corridor, connecting         major trade gateways, tourist
                        the major population centers                  destinations, and population
                        and serving the majority of the                centers from Mexico in the
                        residents.
                                                                        south to Canada in the
                                                                                north.

8   Economic Lifeline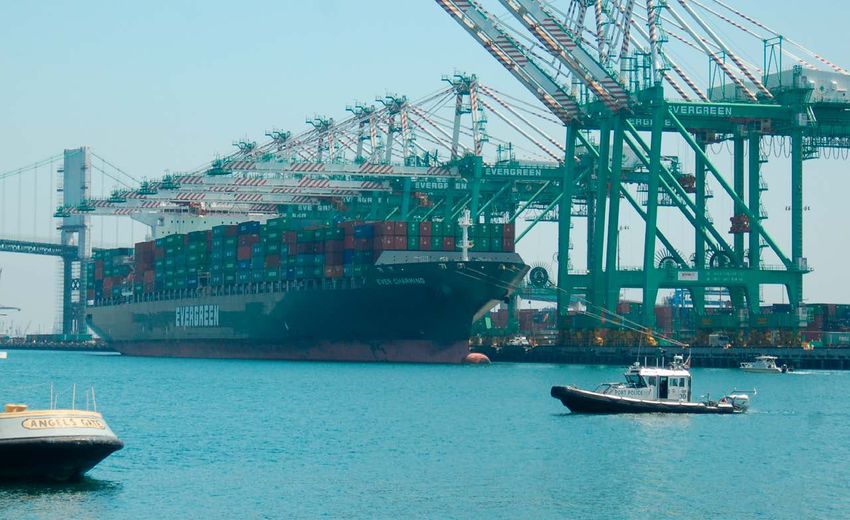
Economic Lifeline 9

But, I-15 can be a victim of its own success. I-15 is a major tourism and
                                                trade corridor, moving more than 46 million vehicles annually, including
                                                2 million tons of freight valued at $108 billion (FAF04, 2015). Without
                                                continued improvement however, the success of the corridor can overrun
                                                the functionality.

I-15 is frequently impacted by congestion, which harms our economies.
Population and employment        I-15 becomes a bottleneck         The segment with the highest           The total cost of congestion
growth in communities along      between Southern California       traffic fatality rate is between       on I-15 equates to $6.2 billion
I-15 is expected to double       and Las Vegas on weekends.        Las Vegas and the Arizona              per year, with more than half
traffic volumes by 2040 –        Average travel time between       state line, which experienced          of that due to chokepoints in
exacerbating current             San Bernardino and Las Vegas is   11 deaths in 2013 (NHTSA,              Los Angeles and Las Vegas
congestion issues (FAF03,        3.5 hours (NPMRDS, 2013). On      2014).                                 and between (TTI, 2015).
2010).                           Sunday afternoons, this
                                 southbound trip might range up
                                 to 7 hours, with bottlenecks
                                 near Primm and Barstow.

 A lack of alternative routes to I-15 exist. Major incidents that close I-15 cripple traffic,
 causing added congestion and lost economic dollars.

         I-15 flood damage, September 2014                                Fire closes I-15 at Cajon Pass, July 2015
                                                                          Source: San Bernardino Fire Department

         The 2014 Moapa flood forced the closure of                       The July 2015 Cajon Pass fire swept across
         50 miles of I-15, requiring a 223-mile detour                    I-15, resulting in more than 30 destroyed
         for truck traffic bound from Las Vegas to Utah                   vehicles. Detour options exist, although none
         – more than doubling the travel time. This                       are direct and all pose additional hazards,
         resulted in an extra daily cost of $667,000 -                    ranging 20 to 50 miles out of direction on
         $790,000 in trucking operations, not including                   rural forest service roads. The Cajon Pass was
         the economic impact of delayed freight                           closed again in August 2016 due to the Blue
         deliveries (ATRI, 2015).                                         Cut Fire.

  10   Economic Lifeline
ECONOMIC LIFELINE
CORRIDOR
The prestigious designation given to I-15 in 2007 as a Corridor of the
Future recognizes that the health of the corridor directly impacts the
wealth and welfare of the region it serves.
The critical economic importance of I-15 is federally recognized via various
designations. From San Diego, California to Mesquite, Nevada via the Inland Empire
and Las Vegas, I-15 from San Diego, California to Utah/Idaho boarder was chosen
as 1 of 6 Corridors of the Future and is known as the Economic Lifeline Corridor.
The section of I-15 from Las Vegas to Sweetgrass, Montana, is part of FHWA’s
High Priority Corridor 26: CANAMEX Corridor. And between Great Falls and
Sweetgrass, the freeway is also part of High Priority Corridor 27: Camino Real.
While these designations come with no funding for improvements, they do
recognize the importance of the corridor at a key linkage in the nation’s interstate
highway system, with a priority on developing innovative national and regional
approaches to reduce congestion and improve the efficiency of freight delivery.
ID
OR
RR
CO
E
TUR
U
F
EXHIBIT 1-1. Federally-Designated Corridors of the Future
Economic Lifeline 11ECONOMIC PROFILE
Some of the largest economic and population centers in the U.S. rely on
the I-15 Corridor. Anchored in the south by Southern California, one of
the ten largest economies in the world in its own right, the I-15 Corridor
cuts across a diverse geography and is critical to this area’s continued
ability to grow and thrive.
UTAH
Las Vegas Salt Lake City
$95 B GDP 2.1 M Population $76 B GDP 1.2 M Population
NEVADA
Inland Empire
$134 B GDP 4.5 M Population
Los Angeles/Long Beach/Orange County
$867 B GDP 13.3 M Population
San Diego
$207 B GDP 3.3 M Population
ARIZONA
CALIFORNIA
EXHIBIT 1-2. Economic Centers along the I-15 Corridor
Source: U.S. Census Bureau, 2014; Bureau of Economic Analysis, 2015
12 Economic LifelineThe I-15 Corridor serves a growing region and provides the avenue to work and
play for the population surrounding it. It also acts as a natural avenue for truck
movements out of the ports and agricultural regions of Southern California and
onward to major cities such as Las Vegas and Salt Lake City. I-15 helps connect the
region to the rest of the U.S., and goods traveling to the Southeast, Midwest, Great
Lakes, and Northeast states travel north along I-15 before heading east on I-10, I-40,
I-70, or I-80.
The I-15 Corridor traverses some of the most densely populated and fastest The I-15 Corridor is
growing counties in the U.S., including the urban and/or suburban areas of San
Diego, Los Angeles, Riverside, and San Bernardino counties, Las Vegas, and Salt
the thread that ties 28
Lake City. Population in the metropolitan areas located along the I-15 Corridor million people together
accounted for just under 8 percent of total U.S. population in Exhibit 1-5 (U.S. economically, culturally,
Census Bureau, 2015). Significant growth is expected in these communities in
the future. In fact, Nevada, Arizona, and Utah were some of the fastest growing and socially.
states in the U.S. in 2015, and it is anticipated that populations in the Las Vegas and
Ogden regions will almost double by 2050, while Southern California will add nearly
7 million more people.
1990 2000 2010 2015 2020 2030 2040 2050
500M
NATIONAL
MILLIONS
400M
300M
200M
15M LOS ANGELES
12M
MILLIONS
9M
INLAND EMPIRE
6M
SAN DIEGO
LAS VEGAS
3M
SALT LAKE
OGDEN
0
1990 2000 2010 2015 2020 2030 2040 2050
TRENDS FORECASTS
EXHIBIT 1-3. Population Trends in Corridor Metropolitan Areas
Source: U.S. Census Bureau, 2015; Woods & Poole Economics, 2015
Economic Lifeline 13Of the top 25 industries in the study area, several industries rely heavily
on transportation networks, including hospitality and tourism, business
and financial services, and transportation and logistics. Each of these
industries along the I-15 corridor had higher employment concentrations
than the national average (BLS, 2005-2015). The strength and size of
these industries determines the amount of inter-regional activity that
occurs on the Corridor and will continue to impact travel demand trends
along I-15.
Each metropolitan area bears a different set of
economic industry strengths, dependent on
their trade activities (BLS, 2005-2015). In San
Ogden
Diego, the hospitality and tourism, business
services, other services, and education
Salt Lake City and health services categories continue to
strengthen and become more specialized.
The Inland Empire sees a high degree of
construction, hospitality and tourism, and
LEG E ND
UTAH transportation and logistics employment
growth – surpassing the national average.
Education & NEVADA Hospitality and tourism remain Las Vegas’
Health
greatest asset. Salt Lake City and Ogden
Manufacturing mirror each other, with diverse economies
in financial services, construction, information
Professional
& Business technology, hospitality and tourism, natural
resources and mining, and transportation and
Information logistics.
Other Services Exhibit 1-4 illustrates those industry clusters
taking hold and emerging within the I-15
Las Vegas
metropolitan areas, offering the potential to
further expand and diversify these economies.
CALIFORNIA
Inland
Empire ARIZONA
Los Angeles
Phoenix
San Diego
EXHIBIT 1-4. Emerging Industries along the I-15 Corridor
14 Economic LifelineOne of the strongest economic industries shared among all I-15
communities is leisure and hospitality. Tourism is heavily dependent on the
transportation system to deliver visitors to and from regional destinations, From the
and I-15 strongly contributes to the movement of people between corridor beaches of San Diego
communities. to the resort corridor in
For Nevada, I-15 is the single most important tourism corridor and is essential for Las Vegas and beyond to the
Southern Nevada’s economy. It is the primary access route for interstate tourism
between Southern California and Las Vegas, for which Las Vegas attracts 9.8
natural wonders of Utah, the
million Southern California visitors annually via I-15 (LVCVA, 2015). A plethora of I-15 Corridor takes residents
theme parks, white sand beaches, and cultural and historical sites attract tourism of the West on vacation,
to Southern California, while most of Utah’s spectacular skiing, national parks, and
other attractions are accessed via I-15 including Zion National Park, Utah Olympic and delivers $52 billion in
Park, and Alta Ski Area. tourism revenue to local
communities.
GDP All GDP Leisure & Hospitality
Metropolitan Statistical Area (MSA) Industries ($M) Industry ($M) % of Total GDP
San Diego $206,817 $8,662 4%
Inland Empire $133,983 $5,438 4%
Los Angeles $866,745 $41,537 5%
Las Vegas $94,521 $19,726 21%
Salt Lake $75,672 $2,131 3%
Ogden $23,862 $610 3%
EXHIBIT 1-5. Tourism Industry along the I-15 Corridor
Source: Bureau of Economic Analysis, 2015b
Economic Lifeline 152. MOVING PEOPLE
HIGHWAY TRAVEL
                                                 I-15 is a major transcontinental north-south highway in the western
                                                 United States that extends more than 1,470 miles through the states
                                                 of California, Nevada, Arizona, Utah, Idaho, and Montana. It is the
                                                 principal artery linking coastal ports to inland population centers and
                                                 connects with the nation’s three coast-to-coast east-west highways: I-10,
                                                 I-80, and I-90 in addition to other east-west interstates including I-40,
                                                 I-70, I-84, and I-86.
                                                 Improving and maintaining existing infrastructure is an important national priority as
                                                 the U.S. seeks more trade and exports. Failure to establish adequate infrastructure
                                                 to move people and goods around the country could significantly constrain future
                                                 economic growth. As an interstate corridor, the ability for cars and trucks to travel
                                                 reliably between corridor destinations is critical.

                                                 Within the I-15 Mobility Alliance states, the corridor extends 843 miles through the
                                                 four-state region, with approximately 320 miles through urban areas.

                                                 Currently, the primary obstacle for seamless movement on I-15 is congestion,
                                                 which can be caused by commute traffic, safety incidents, emergency conditions,
                                                 natural disasters, and numerous other factors. Annual average daily traffic (AADT)
                                                 volumes for the I-15 corridor were obtained from FHWA Highway Performance
                                                 Monitoring System (HMPS) and Freight Analysis Framework (FAF) datasets, as they
                                                 are nationally-recognized datasets and periodically maintained. Currently, the average
                                                 daily traffic throughout the entire corridor is about 65,000 vehicles per day, with a
                                                 maximum of 299,000 vehicles per day in San Diego just north of the I-8 interchange
                                                 (FHWA, 2014). On any given day, up to 15 percent of this traffic may include trucks.

                                                              California            Nevada                Arizona                Utah
       Center Line Miles                                            288                  124                   30                  401
       Number of Lanes                                          4 to 12              4 to 10                    4              4 to 12
       Maximum Annual Average Daily                            299,000              267,000                23,500             268,900
       Traffic
       Minimum Annual Average Daily                              32,000               16,500               18,500               9,400*
       Traffic
       Speed Limit                                             65 to 70             65 to 75                    75            65 to 80
       Rest Areas                                                     4                    5                     0                   6

      EXHIBIT 2-1. I-15 Travel Characteristics
      Source: FHWA, 2014. | * 2013 HPMS data

18   Moving People
Even with planned
Exhibit 2-2 shows existing AADT volumes along I-15, paired with potential
future traffic volumes, if no improvements are made. Green lines represent improvements in place,
free flowing traffic, whereas red lines represent congestion. As displayed, congestion delay during peak
most of the urban areas along I-15 experience congestion today, and that
is expected to worsen in the future. San Diego, portions of San Bernardino times on I-15 between Southern
County, Las Vegas and Salt Lake City all experience AADTs over 200,000. California and Las Vegas is
projected to grow from 3.19
hours per vehicle in 2012 to
7.03 hours in 2022.
Ogden
Salt Lake City
UTAH
NEVADA
CALIFORNIA St. George
Las Vegas
ARIZONA
Barstow
Victorville
Los Angeles
Corona
Temecula
Phoenix
Average Annual Daily Traffic
(Vehicles Per Day)
San Diego
2014 2040
Less than 75,000 vpd
75,000 - 150,000 vpd
More than 150,000 vpd
EXHIBIT 2-2. I-15 Average Annual Daily Traffic
Source: FAF03 2010, FHWA 2014
Moving People 19The
Southwest
PASSENGER RAIL
network
Demand for passenger rail is expected to grow as highway and aviation
systems reach their capacities. In particular, California has one of the
busiest air markets and some of the most congested highways in the
nation, making it a prime candidate for high-speed rail. Various passenger
rail systems operate within the metropolitan regions served by I-15;
however, no system currently connects the regions.
The Southwest Multi-State Rail Planning Study, led by Federal Railroad Administration
The
(FRA), was completed in 2014 and included the states of Arizona, California, and
Southwest Nevada. This study provides a model baseline for other regions of the U.S. to use
network
for illustrating current conditions, a multimodal context, and rail market potential as a
baseline input to a FRA Regional Rail Plan for the entire U.S.
2 lanes Conceptual planning analysis performed in the study indicates there are several
on I-5 from
Los Angeles to multi-state corridors in the Southwest that could address increasing constraints on
San Francisco the transportation network and thus warrant further study in advance of possible
new rail investments (Exhibit 2-3). The link between San Diego and Las Vegas
Source: FRA, 2014 through the Inland Empire is considered a high-priority route, with an eventual
extension to Salt Lake City and Ogden, paralleling the I-15 corridor.
ng
en
i
ico edd
gd
O
R
to
ty
Ch
en
Ci
am
ke
ejo
ee
o
La
cr
n
ck
ll
ko
Va
Re
Sa
u
lt
El
Tr
Sa
S.F./Oakland
n
tio
n
nc
ga
r
Ju
or
ve
NEVADA
vo
nd
M
en
o
Pr
ra
rt
D
Stockton Carson City
Fo
G
eic
Modesto
Pr
Colorado Springs
ity
San Jose Merced Pueblo
C
ar
CA
d
Ce
Santa Cruz
LIF
UTAH COLORADO
OR
as
ARIZONA NEW MEXICO
eg
Salinas Fresno
sV
NIA
La
Santa Fe Las Vegas, NM
w
Lo
an
ff
San Luis Obispo Visalia
sta
s
up
m
nt
ow
ng
ag
all
ra
Sh
Ki
Fl
G
G
Albuquerque
Santa Barbara Bakersfield
Prescott
Major MSA Minor MSA
Core Express
Oxnard Phoenix Potential Core Express or
Blended Service Corridor
es
re
el
pi
Regional
ng
Em
A
nd
os
Emerging/Feeder
la
rL
In
Long Distance
ate
re
n
G
so
c
Tu
s
g
a
gla
in
go
m
ou
em
Yu
ie
D
D
D
a-
n
ist
Sa
aV
rr
Sie
EXHIBIT 2-3. Southwest Corridors for Further Consideration
Source: FRA, 2014
20 Moving PeopleOn July 8, 2011, the FRA issued a Record of Decision for a project-level
Environmental Impact Statement (EIS) for the XpressWest (formerly A lack of long-distance
DesertXpress), a 200-mile high-speed rail line that would provide non-stop
service between Victorville, California, and Las Vegas, Nevada, along the travel options in the U.S.
I-15 corridor. Operating at 150 miles per hour, the trains are estimated has led to increased highway
to travel the corridor in about 80 minutes, with potential for non-stop
service. A future link between Victorville and Palmdale, California, congestion and airport delays.
would connect it to the existing Metrolink commuter rail system and Conventional service and
planned California High-Speed Rail network, with Southern California
stations planned in Los Angeles, Orange, San Diego, and San Bernardino high-speed rail options could
counties. provide relief to the demand
If federal loans are approved or other funding secured, the new rail corridor on I-15.
could significantly reduce congestion on I-I5 between California and Las Vegas
by offering travelers a fast, low stress, and price-competitive mode of travel. It is
estimated that the project will divert approximately 3 million automobile trips from
I-15 each year.
To maintain momentum for this corridor, in 2015, Nevada Governor Brian Sandoval
signed a law creating the Nevada High Speed Rail Authority with the mission
to support implementation of high speed rail between Las Vegas and Southern
California, for which they selected XpressWest as the partner to lead construction
for Phase 1 efforts: Las Vegas to Victorville. Phase 2 efforts are also underway, with
the completion of the final environmental work required for the development of
the line connecting the project to Los Angeles through Victorville and Palmdale,
California expected in late 2016 and defining that segment’s project design. The
California High Speed Rail Authority is completing the EIS/EIR for Phase 3, the
connection to Los Angeles and Anaheim.
CLARK
95 15
373 160
NEVADA NEVADA
190
Lake Mead NRA
LAKE MEAD
127 372
NEVADA
Las Vegas
NYE 160 Segment 6B
178
CO
Paradise
NEVADA
LO
Death Valley NP
395 Hoover Dam
RA
DO
R.
Segment 5B
INYO
M O H AV E
SAN BERNARDINO 93
Segment 4C
127 Primm
Lake
138 Mohave
95
Baker ARIZONA
68
Segment 3B 163
Mojave National NEVADA
Preserve Bullhead City
Segment 2A
58 Barstow
KERN Yermo
Needles
LOS ANGELES Segment 2C
Lancaster 395 40
247
Segment 1
Palmdale
138 Victorville LAKE
15 18 HAVASU
247
Hesperia 18
Big Bear Legend
Burbank
215 Proposed Terminals
San Bernardino 62
Preferred Alternative
Joshua Tree NP
DesertXpress
Federal Railroad
Administration Final EIS Project Location A
Source: CirclePoint, 2011.
EXHIBIT 2-4. Phase 1 XpressWest Connection between Victorville, CA and Las Vegas, NV
Source: FRA, 2011
Moving People 21LOCAL TRANSIT
Building supportive local transit systems to I-15 has been tremendously
successful in removing short distance trips from the highway, both
providing an alternative transportation option for local residents and
freeing up capacity on the interstate, thereby providing additional benefits
such as reduced greenhouse gases, less congestion, and improved safety.
All the major metropolitan areas along the I-15 Corridor have regional transit
systems in place, maximizing mobility within urban centers and strengthening the
success of I-15 as an interregional corridor. Public transit is one component of
a successful and comprehensive multimodal transportation system. It connects
people to jobs, supports business development, saves households money, and
generates employment with every dollar invested. It is also a form of environmental
stewardship, reducing carbon emissions by 37 million metric tons of carbon dioxide
each year across the US – saving the equivalent of 4.2 billion gallons of gasoline
annually (APTA, 2016).
Public transit also provides additional benefits for people who do not use it. It makes
the entire transportation system work more efficiently. Every 10 people on a bus or
train in your community during rush hour means there are nine fewer cars on the
roads. By providing additional capacity, public transit use can move more people
around, thereby increasing the efficiency of the entire transportation network. That
means less traffic congestion, fewer carbon emissions, and a safer community for all.
PUBLIC TRANSPORTATION SAVES FUEL, REDUCES CONGESTION
• Public transportation has a proven record of reducing congestion.
• In 2011, U.S. public transportation use saved 865 million hours in travel time and 450 million gallons of fuel
in 498 urban areas.
• Without public transportation, congestion costs in 2011 would have risen by nearly $21 billion – or 18% - in 498
urban areas.
PUBLIC TRANSPORTATION REDUCES CARBON FOOTPRINT
• Public transportation use in the United States reduces our nation’s carbon emissions by 37 million metric tons annually.
• A single commuter switching their commute to public transportation can reduce a household’s carbon emissions
by 10 percent, and up to 30 percent if a second car is eliminated.
• Households near public transit drive an average of 4,400 fewer miles than households with no access to public transit.
Source: APTA, 2016
22 Moving PeopleSAN DIEGO AND SALT LAKE CITY HAVE TRANSIT CORRIDORS
THAT DIRECTLY SERVE OR PARALLEL I-15
I-15 Corridor Bus Rapid Transit Front Runner System Improvements
(San Diego) (Salt Lake City)
As part of a suite of improvements to improve capacity The FrontRunner commuter rail line is operated by the
and congestion on I-15 in San Diego County, the 20-mile Utah Transit Authority (UTA) and runs 89 miles from
I-15 Express Lanes Corridor (SR 78 in Escondido to SR Provo to Pleasant View serving a total of 16 stations
163 in San Diego) was built in the center of the freeway in Weber, Davis and Salt Lake Counties. FrontRunner
to improve reliability for those traveling longer distances parallels I-15 for the majority of the route and operates
and not requiring local access. The goal of the project primarily on single track with double track at stations
was to improve commute times, foster public transit, and and other locations along the route to allow for trains
encourage shared ridership. Carpools/vanpools have no to pass one another. It operates on UTA-owned track
entry fee to utilize the Express Lanes, and in mid-2014, a which parallels the Union Pacific (UP) tracks from Provo
new Bus Rapid Transit (BRT) service called Rapid began until Ogden, and then UP and UTA share the remaining
using the Express Lanes as well. Rapid is a high-frequency, mileage to Pleasant View. The 16 stations provide riders
limited stop bus service that serves travelers all day with connections/transfers to TRAX, UTA’s light rail
long, and connects with residential areas, employment system, and bus routes. UTA’s primary goal in continuing
centers, and leisure destinations. The Express Lanes to expand the FrontRunner system is to provide increased
are connected to direct access ramps that allow transit transportation opportunities to those living along the
services to be a reliable, timely, and predictable way to Wasatch Front and to decrease traffic congestion caused
travel. by the transportation needs of a growing population.
Future extensions are envisioned that would eventually
Because of the success in managing traffic along I-15, encompass over 135 miles (UTA, 2016).
construction is currently underway on the State Route
15 Mid-City BRT project to build transit-only lanes in the
center of the freeway corridor, south of I-8 (Exhibit X).
The environmental review required under state law and
completed in 2011 projected that implementation of this
corridor will reduce traffic volumes on SR 15, improving
the freeway’s traffic operations (Caltrans, 2011).
Moving People 23AVIATION
Airports within the study area serve as major national and international
gateways for leisure and business activities as well as significant hubs for
goods movement.
Eleven major airports connect the metropolitan areas between Southern California
and Northern Utah. I-15 provides access to four of the nation’s top 25 airports
including top international gateways Los Angeles International Airport (LAX)
and McCarran International Airport (LAS). LAX, LAS, and Phoenix Sky Harbor
International Airport (PHX) all ranked among the top 10 busiest airports in the U.S.,
and Salt Lake City International (SLC) and San Diego International (SAN) were
ranked in the top 30 (FAA, 2016).
Within the southwest region, the busiest air travel corridors exist between
metropolitan areas and are consistent with travel along the I-15 corridor. Most of
these metropolitan areas are separated by 300 to 500 miles. The long distances
between major markets and lack of competitive service for this distance offered
by the existing passenger rail network have led to a disproportionate reliance
on short-haul flights for travel within the region. The busiest air travel corridor is
between Los Angeles and Las Vegas.
24 Moving PeopleAirport State Rank 2014 Enplanements
Los Angeles International California 2 34,314,197
McCarran International Nevada 9 20,620,248
Phoenix Sky Harbor Arizona 10 20,344,867
International
Salt Lake City International Utah 25 10,139,065
San Diego International California 28 9,333,152
John Wayne Airport-Orange California 40 4,584,147
County
Ontario International California 59 2,037,346
Long Beach/Daugherty Field California 77 1,368,923
EXHIBIT 2-5. I-15 Corridor Air Travel
Source: FAA, 2016
LE GE ND
0 to 400,000
400,000 to 800,000
800,000 to 1,200,000 SLC
(2015: Volume of Passengers)
UTAH
NEVADA
CALIFORNIA
LAS
ARIZONA
LAX
PHX
ONT
SNA SAN
EXHIBIT 2-6. Popular Air Travel Corridors
Source: FAA 2016b
Moving People 253. MOVING GOODS
FREIGHT OVERVIEW
                                             Globalization, evolving trade relationships, and technological advances
                                             continue to change economies around the world. Each of these factors
                                             has an effect on the transportation network that serves the region and the
                                               ability to meet the changing demands for freight.
                                                    Many of these changes will affect commodity flows along the I-15 Corridor.
                          An estimated 86            The I-15 Corridor is a national asset with global impacts and enormous
                        million tons of goods         value when considering transport of every type and mode. Freight and
                                                      goods movements are vital to a healthy economy. A reliable transportation
                        worth $244 billion are         network is essential to move freight between states by truck, rail, aviation,
                     expected to travel along the      or any other mode. The 2008 economic downturn has limited the
                                                      spending capability of U.S. consumers, thus lowering the demand of
                      I-15 corridor annually by       goods. However, demand for goods is recovering, and goods movement
                                2040.                continues to be essential to support the growing population of the U.S.

                                                   Approximately 53 million tons of goods, valued at $123 billion, originated and
                                                terminated within the four Alliance states along the I-15 corridor transportation
                                             network on all transportation modes. This is only a portion of the total goods moved
                                             through this corridor destined for points beyond, and is estimated to increase to 86
                                             million tons by 2040 with a projected value of $244 billion (FAF04, 2015).

  100,000                                                                                                   Value* ($ million)
                                                                                                       $112,204       $123,257        $244,160
                                                                                      TOTAL
    80,000                                                                                                M               M              M

                                                                                                        $4,775         $5,932          $8,485
                                                                                    PIPELINE
                                                                                                          M               M              M
   60,000
                                                                                  MULTIPLE
                                                                                                       $15,609         $16,956        $30,489
                                                                                  MODES &
                                                                                                          M               M              M
                                                                                    MAIL**
    40,000
                                                                                                        $4,064         $5,457         $20,879
                                                                                            AIR
                                                                                                          M               M              M
    20,000
                                                                                                        $184            $220           $349
                                Volume (Kton)                                             RAIL
                                                                                                          M               M              M

          0                                                                                            $87,572         $94,693        $183,957
                                                                                      TRUCK
              2012                    2015                        2040                                    M               M              M

                                                                                                        2012            2015           2040
                                                                                   * in 2012 dollars
EXHIBIT 3-1. I-15 Corridor Freight Summary
                                                                                   ** Multiple Modes and Mail refers to commodities
Source: FAF04, 2015                                                                that move by more than one mode, in particular,
                                                                                   parcel delivery services.

     28       Moving Goods
The reliability of freight movement continues to play a major role in determining how goods are moved across North America, and to and from global markets.
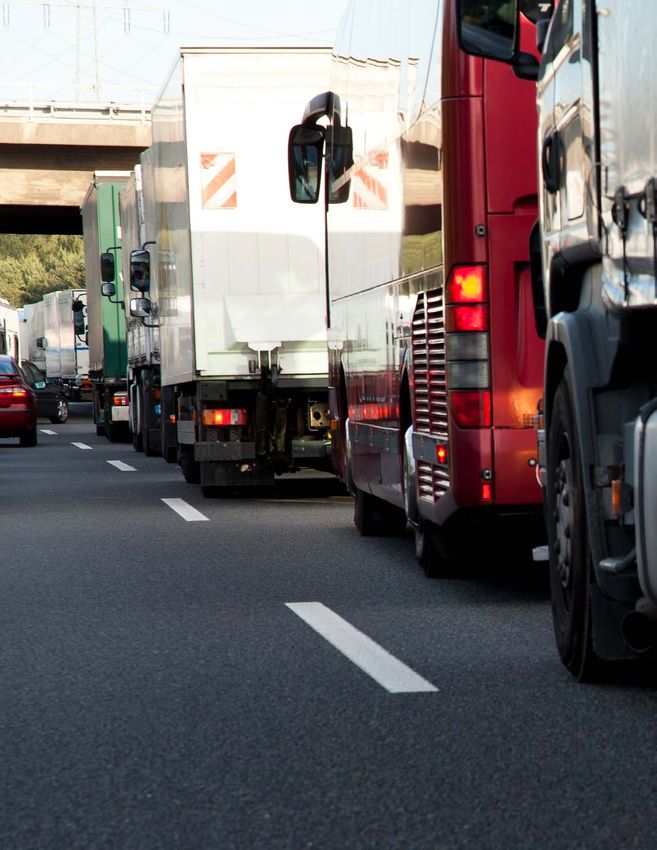
TRUCKING
                                                   The I-15 Corridor is an avenue for truck movements out of the ports and
                                                   agricultural regions of Southern California and onward to major cities such
                                                   as Las Vegas and Salt Lake City.
                                                   As a major trade route, I-15 moves approximately 30 million tons by truck valued at
                                                   approximately $95 billion (FAF04, 2015). Considering the continued growth of port
                                                   traffic, without improvements, the roadways supporting the ports will be congested
                                                   and will experience greater delays in the future. Furthermore, safety and congestion
                                                   issues within metropolitan areas along I-15 will continue to slow traffic and degrade
                                                   reliability of goods shipment along this corridor.

COST OF CONGESTION
The cost of congestion in lost time, money,
opportunity, and lives can be significant. In
the 2012 Corridor System Master Plan, it
was reported that the I-15 corridor hosted
five of the nation’s worst trucking bottlenecks,
according to the American Research Institute
(ATRI). ATRI’s latest report (2014) shows that
only three locations remain on this list, which
shows that corridor efforts to improve I-15 on
a regional scale are succeeding.

The I-15/I-215 interchange in Salt Lake City
has been removed from the ATRI list, which
encompassed two prior rankings. Due to
recent improvements, I-15 through Las Vegas
and San Bernadino have dropped significantly in
their rankings. The Corona, California location     60,000
at I-15/SR 91 however, has gotten worse.                                                                                  $183,957
                                                    50,000                                                                      M
                                                    40,000
                                                                                            $94,693
                                                    30,000 $87,572
                                                                                                 M
                                                                   M
                                                    20,000

                                                    10,000                          Volume (Kton)
                                                           0
                                                                2012                          2015                           2040
                                                     EXHIBIT 3-2. Volume and Value of I-15 Freight by Truck
                                                     Source: FAF04, 2015

  30    Moving Goods
Ogden
Salt Lake City
UTAH
NEVADA
CALIFORNIA St. George
Las Vegas
ARIZONA
Barstow
Victorville
Los Angeles
Corona
Temecula
Phoenix
Average Annual Daily Truck Traffic
(Trucks Per Day)
San Diego
2007 2040
Less than 15,000 vpd
15,000 - 30,000 vpd
More than 30,000 vpd
EXHIBIT 3-3. Average Annual Daily Truck Traffic
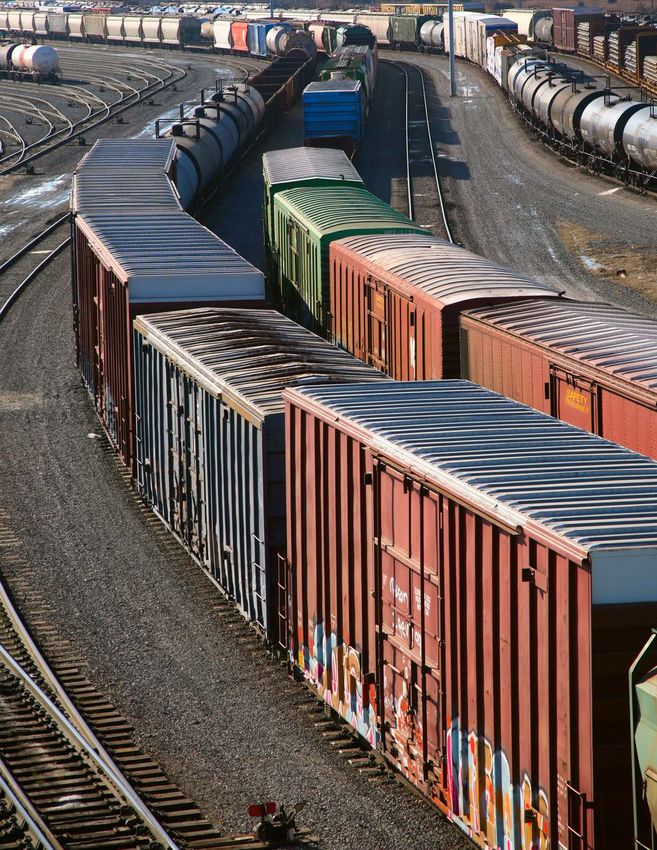
Source: FAF03 2010, FAF04 2015FREIGHT RAIL
Without improvements, demand is expected to exceed both freeway and
rail capacity, resulting in costly shipping delays.
The two largest U.S. Class I railroads, BNSF Railway (BNSF) and Union Pacific (UP),
are the only Class I railroads that operate in the study area. BNSF service starts
in San Diego, California and proceeds north along the coastal rail corridor to Los
Angeles and then to points north
and east across Arizona, New
Mexico, and Texas. UP provides
service to a large portion of the
region, and one segment of the
UP track parallels I-15 from Los
Angeles to Salt Lake City—both
critical hubs in UP’s network.
Approximately 400,000 tons of
goods, valued at $220 million,
originated and terminated within
the four Alliance states along the
I-15 corridor. This constitutes a
small fraction of the total goods
moved by rail through this corridor
destined for points beyond
(FAF04, 2015).
EXHIBIT 3-4. Primary U.S. Freight Rail Corridors
Source: Cambridge Systematics, Inc.
600 $349
M
500
400 $220
$184 M
300
M
200
100 Volume (Kton)
0
2012 2015 2040
EXHIBIT 3-5. Volume and Value of I-15 Freight by Rail
Source: FAF04, 2015
32 Moving GoodsAIR CARGO
Most air cargo has a high value and is transferred to trucks for quick
delivery to its final destination.
The I-15 corridor moves approximately 52,000 tons by air valued at approximately
$5 billion (FAF04, 2015). Some of the major air cargo airports along the corridor
include Los Angeles International (LAX), McCarran International Airport (LAS), and
Salt Lake City International (SLC).
LAX ranks in the top 6 airports in the world for total air cargo traffic (FAA, 2016a). In
terms of landed weight in in the U.S., LAX and PHX rank in the top 20 airports, with
LAS ranked at 64 in 2015 (FAA, 2016).
200
$20,879
M
150
100
$5,457
50 $
4,064 M
M
Volume (Kton)
0
2012 2015 2040
EXHIBIT 3-6. Volume and Value of I-15 Freight by Air
Source: FAF04, 2015
34 Moving GoodsPORTS OF ENTRY
The reliability of the network to transport goods from the Ports of Entry
through inland distribution centers and on to the end consumer underlines
the very nature of this Master Plan and the importance of the I-15
Corridor to the region, nation, and world.
Together, the Ports The Port of Los Angeles and Port of Long Beach have worldwide significance,
and are the busiest ports in the U.S. for container traffic. If combined, they
of Los Angeles and Long would be ranked ninth worldwide for container traffic according to the
Beach rank as the 9th busiest American Association of Port Authorities statistics on World Port Rankings
port complex in the world. As in 2014. Combined, they account for approximately 32 percent of goods
transported in and out of the U.S. (AAPA, 2014b).
demand for warehousing moves
further out of the Los Angeles The ports are major economic drivers for California and the region. The
ports of California are the primary gateways to manufactured goods from
Basin, connecting corridors the Asian markets and the most cost-effective way to deliver goods to
like I-15 will become North American markets. The expansion of the Panama Canal which was
inaugurated on June 26, 2016, may shift some traffic from West Coast to East
stressed. Coast and Gulf ports as the all-water route from Asia to the eastern U.S. through
the Panama Canal becomes more economical. Maintaining I-15’s capacity to move
goods will help maintain the viability of California’s deep-water ports, strengthening
the economy of the entire region.
The I-15 Corridor serves as a primary goods movement route serving California
and Mexican ports, including portions of the CANAMEX Corridor. As a primary
collector-feeder route between Southern California, Mexico, and Canada, the
U.S. relies on goods moving on the I-15 Corridor, because it provides an efficient
connection between primary east-west trade corridors, specifically, I-8, I-10, I-40/SR
58, I-70, I-80, I-84, I-86, and I-90.
CALIFORNIA
Barstow
Los Angeles Victorville
Port of Hueneme Corona
Port of Los Angeles Temecula
ARIZONA
Port of Long Beach Calexico
Port of San Diego Andrade Phoenix
San Diego
San Ysidro
San Luis
Proposed Port of Punta Colonet
Tecate
Port of Ensenada
Lukeville
L E GE ND Otay Mesa
Port of Guaymas
Seaport Border Crossing Sasabe Naco
Nogales
Douglas
EXHIBIT 3-7. International Trade Entry Points
36 Moving GoodsWhile the ports of Los Angeles and Long Beach process the greatest share of goods
moving in and out of the study region, border crossings also play an important
role in international freight movements. Maintaining I-15’s capacity and reliability to
move goods will help maintain the viability of the Southern California ports and the
economy of the region.
Total Cargo Volume at Southern CA Ports
Long Beach
Long Angeles
Port Hueneme
San Diego
0 50 100 150 200 250 300 350 400 450
MILLIONS OF TONS
YEAR: 2010 2011 2012 2013 2014
EXHIBIT 3-8. Total Cargo Volume at Southern California Ports (Tons)
Source: AAPA, 2014a
The I-15 Mobility Alliance states must compete nationally and
globally for the investments and jobs needed for a thriving economy.
The reliability of freight movement will play a major role in
deciding how goods are moved from Asian and Mexican
manufacturers to markets throughout North
America. Maintaining I-15’s capacity to move goods
will help maintain the viability of both deep-water ports and land
ports of entry, strengthening the economy of the entire region.
Moving Goods 374.
PERFORMANCE
MEASURESSelect measures MEASURING
PROGRESS THROUGH
PERFORMANCE
Track and report
performance results MEASURES
State and Federal transportation agencies have long used asset and performance
management techniques to assess, measure, and gauge infrastructural and
operational capabilities of their systems. However, maintaining a performance
management system has become more important in the recent past, as it has
Identify key factors become one of several evaluation criteria used to award federal grant monies.
influencing
performance In the case of I-15, the I-15 Mobility Alliance has decided to establish a series of
performance measures to understand the major factors that impact travel on I-15:
• Congestion
• Safety
Allocate resources
to drive better • Infrastructure Condition
results Monitoring progress on an annual basis allows the Alliance to track change along the
Corridor and understand the impact of improvements on a regional scale, serving
as a touchstone by which to gauge the success of these efforts. Additionally, the data
allows the Alliance to prioritize improvements and grant opportunities in the areas of
greatest need.
Continue to monitor
and report progress
NO CHANGE IMPR
ORSE OVE
W
D
SIG MPROVED
WORSE NTLY
NIFIC
I
SIGNIFICA
ANTLY
In subsequent updates of the CSMP, illustrative gauges will show
the progress of these measures as improvements continue to be
constructed and traffic conditions evolve.
40 Perform ance Me asuresCONGESTION
SAFETY
INFRASTRUCTURE CONDITIONCONGESTION
Projected growth in trade, population and employment in counties along the
corridor will increase congestion on I-15. The existing Annual Average Daily
Traffic (AADT) for the entire I-15 Corridor is expected to double by 2040,
substantially exacerbating already apparent performance problems. The economic
competitiveness of the region depends on the free-flow movement of people and
goods.
PERFORMANCE GOAL
Maintain travel speeds at a minimum of 40 mph at all points throughout the day.
PERFORMANCE CRITERION
National Performance Management Research Data Set (NPMRDS) Speed Data:
Peak period travel speed data tracks average speeds for passenger and freight
vehicles, per direction, with results approximately every one mile.
RESULTS
Several chokepoints exist along the corridor as summarized in Exhibit 4-2. Many
chokepoints are located in heavily populated urban areas, at junctions with other
interstates or major state highways, or within areas of steep terrain. Some of these
chokepoints are likely due to temporary construction projects.
State Total Chokepoints General Location along I-15 Typical Speed
I-8 15 mph
I-215/Temecula 38 mph
SR 91/Corona 20 mph
CA 6
SR 60/Mira Loma 25 mph
SR 18/Victorville 25 mph
Barstow vicinity 25 mph Note: Chokepoints are
represented by areas that have
Tropicana Ave 32 mph average speeds below 40 mph.
NV 2 Speed data is gathered over
US 95/Spaghetti Bowl 25 mph multiple points in time to gather
AZ 0 typical conditions, organized by
vehicle type (passenger, freight)
I-215 (north)/Salt Lake City 30 mph and direction (northbound,
southbound). Therefore, typical
UT 3 SR 30 20 mph speeds noted are approximate
I-84/Ogden 18 mph averages and may not necessarily
correspond to each condition.
EXHIBIT 4-1. I-15 Corridor Traffic Chokepoints
Source: NPMRDS Travel Times, 2013
42 Perform ance Me asuresOgden
Salt Lake City
UTAH
NEVADA
CALIFORNIA St. George
Las Vegas
ARIZONA
Barstow
Victorville
Los Angeles
Corona
Temecula
Phoenix
San Diego
Traffic Chokepoints
(Speeds Under 40 mph)
EXHIBIT 4-2. I-15 Corridor Congestion Chokepoints
Source: NPMRDS Travel Times, 2013
Perform ance Me asures 43SAFETY
Traffic incidents contribute to significant delays for both passenger and freight travel as
SAFETY well as costs to the public. Even one life lost is too many.
PERFORMANCE GOAL
Maintain a fatal accident rate below 0.003.
PERFORMANCE CRITERION
National Highway Traffic Safety Administration (NHTSA) Fatality Analysis Reporting
System (FARS) Data: Fatal crashes per million vehicle miles traveled.
RESULTS
The I-15 corridor was broken into 14 segments for analysis purposes. All segments
experienced at least one fatal crash in 2013. The segments with the highest traffic
fatality rates are:
• Segment 8: Las Vegas metro area to Arizona state line
• Segments 9, 10, and 11: Arizona state line to US 6 in Utah
• Segment 5: I-40 to Nevada state line
Segment Start Finish Length Fatal Crashes (2013) Fatal Crash Rate (2013)
MVMT
1 I-5 I-215 62.78 7 0.002
2 I-215 SR 91 33.17 8 0.005
3 SR 91 I-215 27.11 6 0.004
4 I-215 I-40 58.43 17 0.009
5 I-40 NV-SL 112.01 16 0.01
6 NV-SL SR 146 27.6 3 0.007
7 SR 146 CC 215 24.33 9 0.007
8 CC 215 AZ-SL 71.99 11 0.021
9 AZ-SL SR 7 33.28 3 0.012
10 SR 7 SR 9 13.9 3 0.015
11 SR 91 US 6 229.12 14 0.01
12 US 6 SR 154 45.05 1 0.001
13 US 154 US 89 34.47 5 0.002
14 ES 89 ID-SL 76.31 4 0.003
EXHIBIT 4-3. I-15 Corridor Fatal Crash Rates by Segment
Source: NHTSA FARS, 2014
44 Perform ance Me asures14
Ogden
13 Salt Lake City
12
UTAH
NEVADA
11
CALIFORNIA 9
10
St. George
8
7 Las Vegas
6
ARIZONA
5
Barstow
4
Victorville
Los Angeles
3
Corona
Fatal Crash Rate 2 Temecula
(Fatal Crashes per MVMT) Phoenix
1
0.001 - 0.003
San Diego
0.004 - 0.006
0.007 - 0.009
0.010 - 0.015
0.016 - 0.021
# Segment Number
EXHIBIT 4-4. I-15 Corridor Fatal Crash Rates
Source: NHTSA FARS, 2014
Perform ance Me asures 45INFRASTRUCTURE
CONDITION
Poor infrastructure conditions create unreliable transportation facilities leading to
additional miles traveled, increased travel times, increases in vehicle operating costs,
and additional costs imposed on travelers and businesses. The cost of pavement and
bridge deficiencies on travelers is estimated to be $58 per person by 2020 and over
$650 by 2040 (ASCE, 2013).
Bridge conditions are assessed annually, at a minimum, with detailed tracking
of conditions and improvement projects. The Alliance states have pavement
management systems in place that include pavement maintenance and rehabilitation
plans to continually prioritize needs through routine improvement projects.
PERFORMANCE GOAL
Eliminate the number of structurally-deficient and functionally obsolete bridges along
I-15.
PERFORMANCE CRITERION
National Bridge Inventory (NBI) Database: Compilation of bridge data supplied by
the each state to the FHWA for bridges located on public roads.
RESULTS
Structurally deficient bridges have structural defects or significant load-carrying
elements that are found to be in poor or worse condition due to deterioration
and/or damage. Functionally obsolete bridges are substandard or are no longer to
conform to the design standards in place at the time they were designed.
Each I-15 corridor state has several structurally deficient and functionally obsolete
bridges along I-15. While I-15 only traverses Arizona for 29 miles, the majority of
this area passes through the Virgin River Gorge, which involves a series of major
bridge structures, all of which have been recently or are planned to be replaced/
improved.
46 Perform ance Me asuresTOTAL Ogden
9 52 = 61
Salt Lake City
UTAH
NEVADA
NEVADA
UTAH**
0 20 = 20
2 22 = 24
CALIFORNIA St. George
CALIFORNIA
Las Vegas
1 9 = 10
ARIZONA
ARIZONA*
Barstow 6 1 =7
Victorville
Los Angeles
Corona
LEGEND Temecula
Phoenix
Structurally Deficient Bridge
San Diego
Functionally-Obsolete Bridge
STATE
# # =# Total
# of Functionally Obsolete Bridges on I-15
# of Structurally Deficient Bridges on I-15
* The Virgin River Gorge Bridges have been replaced or are
planned to be replaced/improved. These bridges are not in
the national bridge inventory database. Bridge condition
EXHIBIT 4-5. I-15 Corridor Infrastructure Conditions
data for Arizona segment of I-15 received from ADOT.
Source: NBI Database, 2015; Peterson, pers. comm. 2017; Yaqub,
pers. comm. 2016 ** Several I-15 bridges have been recently replaced through
the I-15 Corridor Reconstruction (CORE) Project. Updated
bridge condition data for Utah received from UDOT.
Perform ance Me asures 475.
I-15 MOBILITY
ALLIANCETHE ALLIANCE GOALS
I-15 MOBILITY ALLIANCE
INCLUDE: The I-15 Mobility Alliance developed the first I-15 Corridor System Master Plan
in 2012 to provide policy and decision makers with a strategic action plan that
• Reduce or eliminate congestion impacting
the interregional movement of people or
defines future transportation infrastructure, and supports national, regional, and local
goods approaches to improve freight delivery, and relieve congestion for years to come.
Individuals within the four states and beyond invested their time and resources to
• Improve interregional travel time reliability keep this economic artery of the West flowing.
of people or goods movement
• Improve the safety of the interregional The Alliance partners come from state and local transportation agencies, local and
movement of people or goods interstate commerce, port authorities, departments of aviation, freight and passenger
rail authorities, freight transportation services, providers of public transportation
• Construct projects in a manner that
respects and honors the unique goals/
services, environmental and natural resource agencies, and others. The I-15 Mobility
objectives/standards of each sponsoring Alliance partners provided invaluable data, resources, and assistance in capturing,
community/entity analyzing, and summarizing the technical data in the Master Plan.
USDOT Executive Board
(FHWA, FTA, (ADOT, Caltrans, Guide and approve
FRA, FAA) NDOT, UDOT) all matters
DECISION MAKER DECISION MAKER
Review and approve federal
funding requests
Recommend Immediate
Programming Projects of Interregional
Committee Significance
(Partners) Provide technical data,
RECOMMENDER assessments and evaluation
Project Steering
Management Team Committee Public
(State DOT (Partners)
management and CONTRIBUTOR CONTRIBUTOR
consultant team) Identify issues of concern Provide input on Master
CONTRIBUTOR and provide input on Master Plan elements
Plan elements
Schedule and plan
committee meetings,
prepare/review deliverables, EXHIBIT 5-1. Organizational Structure
develop Master Plan
50 I-15 Mobilit y AllianceYou can also read