Management Discussion Analysis - and Macquarie Group Year ended 31 March 2022
←
→
Page content transcription
If your browser does not render page correctly, please read the page content below

Management
Discussion
and Analysis

Macquarie Group
Year ended 31 March 2022

Macquarie Group Limited
ACN 122 169 279

Notice to readers
The purpose of this report is to provide information
supplementary to the Macquarie Group Limited Financial Report
(the Financial Report) for the year ended 31 March 2022, including
further detail in relation to key elements of Macquarie Group
Limited and its subsidiaries’ (Macquarie, the Consolidated Entity)
financial performance and financial position. The report also
outlines the funding and capital profile of the Consolidated Entity.
Certain financial information in this report is prepared on a
different basis to that contained in the Financial Report, which
is prepared in accordance with Australian Accounting Standards.
Where financial information presented within this report does not
comply with Australian Accounting Standards, a reconciliation to
the statutory information is provided.

Date of this report
This report has been prepared for the year ended 31 March 2022
and is current as at 6 May 2022.

Cover image
With more than 15 years’ experience in physical and financial
energy markets, we have built a deep franchise of client
relationships globally. During a period of exceptional volatility,
we have continued to service our customers reliably and
consistently to enable them to continue their business
operations seamlessly.

Explanatory notes

Comparative information and conventions
Where necessary, comparative figures have been restated to conform to changes
in current year financial presentation and group structures.
References to the prior year are to the 12 months ended 31 March 2021.
References to the first half are to the six months ended 30 September 2021.
References to the second half are to the six months ended 31 March 2022.
In the financial tables throughout this document ‘*’ indicates that the absolute
percentage change in the balance was greater than 300% or indicates the result
was a gain in one period but a loss in another, or vice versa.

Independent Auditor’s Report
This document should be read in conjunction with the Financial Report for
the year ended 31 March 2022, which was subject to independent audit by
PricewaterhouseCoopers.
PricewaterhouseCoopers’ independent auditor’s report to the members of
Macquarie Group Limited dated 6 May 2022 was unqualified.
Any additional financial information in this document which is not included in the
Financial Report was not subject to independent audit by PricewaterhouseCoopers.

Disclaimer
The material in this document has been prepared by Macquarie Group Limited ABN 94 122 169 279 (MGL, the
Company) and is general background information about Macquarie Group Limited and its subsidiaries’ (Macquarie)
activities current as at the date of this document. This information is given in summary form and does not purport
to be complete. The material in this document may include information derived from publicly available sources
that have not been independently verified. Information in this document should not be considered as advice or a
recommendation to investors or potential investors in relation to holding, purchasing or selling securities or other
financial products or instruments and does not take into account your particular investment objectives, financial
situation or needs. Before acting on any information you should consider the appropriateness of the information
having regard to these matters, any relevant offer document and in particular, you should seek independent
financial advice. No representation or warranty is made as to the accuracy, completeness or reliability of the
information. All securities and financial product or instrument transactions involve risks, which include (among
others) the risk of adverse or unanticipated market, financial or political developments and, in international
transactions, currency risk.
This document may contain forward looking statements – that is, statements related to future, not past, events or
other matters – including, without limitation, statements regarding our intent, belief or current expectations with
respect to Macquarie’s businesses and operations, market conditions, results of operation and financial condition,
capital adequacy, provisions for impairments and risk management practices. Readers are cautioned not to place
undue reliance on these forward looking statements. Macquarie does not undertake any obligation to publicly
release the result of any revisions to these forward looking statements or to otherwise update any forward looking
statements, whether as a result of new information, future events or otherwise, after the date of this document.
Actual results may vary in a materially positive or negative manner. Forward looking statements and hypothetical
examples are subject to uncertainty and contingencies outside Macquarie’s control. Past performance is not a
reliable indication of future performance.

Contents
    01                                02
    Result Overview                   Financial Performance
    1.1 Executive Summary         4
                                      Analysis
                                      2.1 Net Interest and Trading Income      12
                                      2.2 Fee and Commission Income            15
                                      2.3 Net Operating Lease Income           17
                                      2.4 Share of Net (Losses)/Profits from
                                          Associates and Joint Ventures        17
                                      2.5 Credit and Other Impairment Charges 18
                                      2.6 Net Other Operating Income           20
                                      2.7 Operating Expenses                   21
                                      2.8 Headcount                            22
                                      2.9 Income Tax Expense                   23

    06                                07
    Capital                           Funds Management
    6.1 Overview                 70   7.1 Assets Under Management              80
    6.2 Bank Group Capital       72   7.2 Equity Under Management              81
    6.3 Non-Bank Group Capital   75
03                              04                                         05
Segment Analysis                Balance Sheet                              Funding and Liquidity
3.1 Basis of Preparation   26   4.1 Statement of Financial Position   44   5.1 Liquidity Risk Governance and
                                                                               Management Framework                 52
3.2 MAM                    30   4.2 Loan Assets                       46
                                                                           5.2 Management of Liquidity Risk         54
3.3 BFS                    32   4.3 Equity Investments                48
                                                                           5.3 Funded Balance Sheet                 56
3.4 CGM                    34
                                                                           5.4 Funding Profile for Macquarie        58
3.5 Macquarie Capital      37
                                                                           5.5 Funding Profile for the Bank Group   62
3.6 Corporate              39
                                                                           5.6 Funding Profile for the
3.7 International Income   41
                                                                               Non‑Bank Group                       65
                                                                           5.7 Explanatory Notes Concerning
                                                                               Funding Sources and Funded Assets 67

08                              09
Glossary                        Ten Year History
8.1 Glossary               84   9.1 Ten Year History                  90
01
    Result
    Overview
    Jozwin wind farm, Poland
    The Jozwin wind farm comprises of 9 GE turbines and
    has been operating for nearly 7 years. The project helps
    avoid 42kt CO2e in greenhouse gas emissions every year.

2
Financial
 Result                  Segment    Balance     Funding                             Funds                               Ten Year
           Performance                                            Capital                               Glossary
Overview                 Analysis    Sheet    and Liquidity                       Management                             History
             Analysis

                                                      Macquarie Group Limited 2022 Management Discussion and Analysis
                                                                                                                             3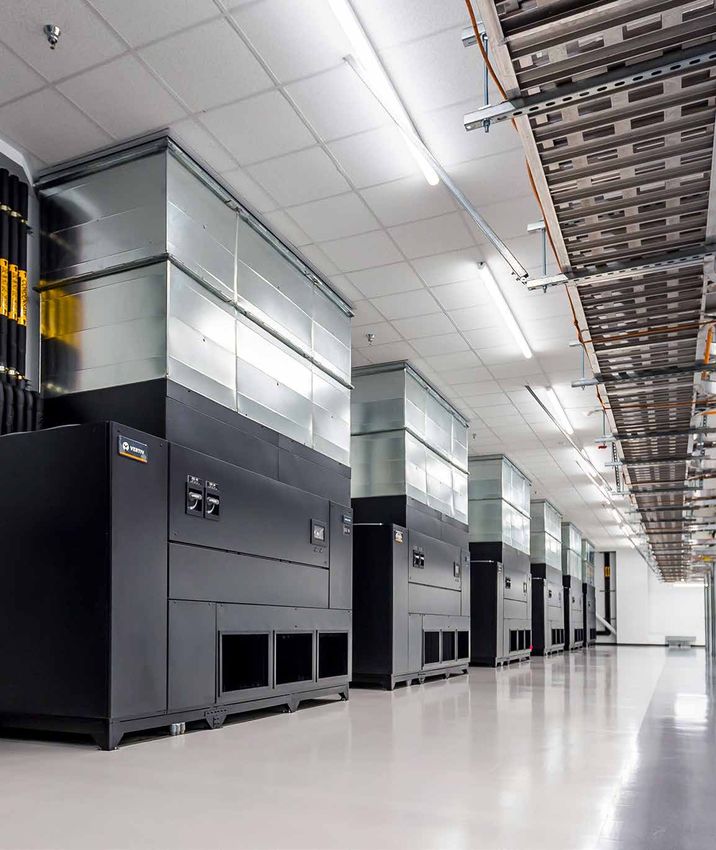
1.1 Executive Summary

Macquarie (MGL and its subsidiaries,
the Consolidated Entity) is a global
financial group with offices in
33 markets.
Macquarie Group Limited (MGL, the Company) is listed in Australia                                 investment. The diversity of our operations, combined with a
and is regulated by the Australian Prudential Regulation Authority                                strong capital position and robust risk management framework, has
(APRA), the Australian banking regulator, as a Non-Operating                                      contributed to Macquarie’s 53-year record of unbroken profitability.
Holding Company (NOHC) of Macquarie Bank Limited (MBL), an
                                                                                                  Macquarie works with institutional, corporate, government and
authorised deposit-taking institution (ADI). Macquarie’s activities
                                                                                                  retail clients and counterparties around the world, providing a
are also subject to supervision by various other regulatory agencies
                                                                                                  diversified range of products and services. We have established
around the world.
                                                                                                  leading market positions as a global specialist in a wide range
Founded in 1969, Macquarie now employs over 18,000 people                                         of sectors, including renewables, infrastructure, resources and
globally, has total assets of $A399.2 billion and total equity of                                 commodities, energy, financial institutions and real estate.
$A28.8 billion as at 31 March 2022.
                                                                                                  Alignment of interests is a longstanding feature of Macquarie’s
Macquarie’s breadth of expertise covers asset management,                                         client-focused business, demonstrated by our willingness to both
retail and business banking, wealth management, leasing and                                       invest alongside clients and closely align the interests of our
asset financing, market access, commodity trading, renewables                                     shareholders and staff.
development, specialist advice, access to capital and principal

Macquarie now employs over 18,000 people                                   (1)
                                                                                                                $A4,706m                                FY2022 profit

globally across 33 markets

EMEA ~14%

Americas ~18%

Asia ~22%

ANZ ~46%

1969                                                                                                                                                                2022

(1) This figure includes staff employed in certain operationally segregated subsidiaries (OSS).

4
Financial
 Result                                      Segment             Balance              Funding                                    Funds                          Ten Year
                    Performance                                                                              Capital                             Glossary
Overview                                     Analysis             Sheet             and Liquidity                              Management                        History
                      Analysis

FY2022 net profit                                                                        FY2022 return on equity

$A4,706m                                                                                 18.7%
     µ 56% on prior year                                                                     µ from 14.3% in prior year

FY2022 net operating income                                                              FY2022 operating expenses

$A17,324m                                                                                $A10,785m
     µ 36% on prior year                                                                     µ 22% on prior year

FY2022 net profit contribution(1) by activity
    Annuity‑style activities                                                                                                         Markets‑facing activities

    $A4,132m                                                                                                               $A5,330m
      µ 25% on prior year                                                                                                                          µ 92% on prior year

                                                        ~44%                                                                                            ~56%
0                                   20                                  40                                   60                             80                         100

          Macquarie Asset
          Management                                                   Commodities andGlobal Markets                                  Macquarie Capital

          ~23%                                                         ~10%                               ~31%                                   ~25%
                                                    Banking and Financial Services

                                                    ~11%
(1) Net profit contribution is management accounting profit before unallocated corporate costs, profit share and income tax.

                                                                                              Macquarie Group Limited 2022 Management Discussion and Analysis
                                                                                                                                                                     5
1.1 Executive Summary
Continued

FY2022 net profit contribution by Operating Group
Summary of the Operating Groups’ performance for the year ended 31 March 2022.
                      Annuity‑style businesses                                                      Markets‑facing businesses

                      Macquarie Asset Management (MAM)                                              Macquarie Capital
                      $A2,150m                                                                      $A2,400m
                          µ 4% on prior year                                                            µ significantly from $A651m in prior year
                      •   Increased base fees primarily driven by the acquisition of                •   Substantially higher net income on equity, debt and other
                          Waddell & Reed Financial (Waddell & Reed), investments made                   investments driven by material asset realisations in the green
                          by Private Markets-managed funds and mandates and Public                      energy, technology and business services sectors and included
                          Investments market movements.                                                 realisations across all regions.
                      •                                                                             •
  Non‑Banking Group

                          Increased other fee and commission income largely                             Higher fee and commission income due to higher mergers and
                          due to a disposition fee from Macquarie Infrastructure                        acquisitions fee income and debt capital markets fee income,
                          Corporation(1) (MIC).                                                         partially offset by lower equity capital markets fee income and
                      •   Increased share of net profits from associates and                            brokerage income.
                          joint ventures, primarily driven by equity accounted                      •   Higher net interest and trading income resulting from growth
                          income from MIC and lower equity accounted losses in                          in the private credit portfolio.
                          Macquarie AirFinance.
                                                                                                    Partially offset by:
                      Partially offset by:                                                          • higher credit and other impairment charges primarily due to
                      • increased operating expenses driven by Waddell & Reed                          a small number of underperforming equity investments and
                         one-off acquisition and ongoing costs                                         growth of the private credit portfolio
                      • decreased net income on equity, debt and other investments                  • higher non-controlling interests predominantly driven
                         driven by the non-recurrence of gains on sale of Macquarie                    by the share of gains on disposal attributable to
                         European Rail and other investments as well as lower gains on                 non‑controlling interests.
                         revaluation of property investments
                      • decreased performance fees following a strong prior year.

                      Banking and Financial Services (BFS)                                          Commodities and Global Markets (CGM)(2)
                      $A1,001m                                                                      $A3,911m
                          µ 30% on prior year                                                           µ 50% on prior year
                      •   Higher net interest and trading income mainly driven by                   •   Increased risk management income with gains across the
                          volume growth in the loan portfolio and BFS deposits.                         platform, particularly in Gas and Power, Resources, Agriculture,
                      •   Decreased credit and other impairment charges driven by the                   and Global Oil driven by increased client hedging activity and
                          partial release of COVID-19 overlays. Credit provisioning levels              trading activity due to elevated levels of volatility and price
                          remain prudent with the combined downside macroeconomic                       movements in commodity markets, partially offset by the
  Banking Group

                          scenarios having a higher weighting than the upside scenario.                 impact of fair value adjustments across the derivatives portfolio.

                      Partially offset by:                                                          •   Net income on equity, debt and other investments up
                                                                                                        significantly driven by the gain on the partial sale of the UK
                      • higher employment, technology and other operating expenses,                     Meters portfolio of assets, comprising the industrial and
                         including increased headcount, to support business growth and                  commercial portfolio.
                         to meet regulatory requirements.
                                                                                                    •   Decreased credit and other impairment charges driven by the
                                                                                                        partial release of COVID-19 overlays. Credit provisioning levels
                                                                                                        remain prudent with the combined downside macroeconomic
                                                                                                        scenarios having a higher weighting than the upside scenario.
                                                                                                    Partially offset by:
                                                                                                    • increased other operating expenses driven by higher
                                                                                                       expenditure on technology platform and infrastructure and
                                                                                                       increasing compliance and regulatory management spend.

(1) On 22 September 2021, Macquarie Infrastructure Corporation completed a corporate reorganisation, becoming a subsidiary of the newly formed Macquarie Infrastructure Holdings,
    LLC which continues to trade under the New York Stock Exchange symbol of ‘MIC’.
(2) Certain assets of the Credit Markets business, certain activities of the Commodity Markets and Finance business, and some other less financially significant activities are undertaken
    from within the Non-Banking Group.

6
Financial
Result Segment Balance Funding Funds Ten Year
Performance Capital Glossary
Overview Analysis Sheet and Liquidity Management History
Analysis
Profit attributable to the ordinary equity holders
$A4,706m
µ 56% on prior year
HALF YEAR TO FULL YEAR TO
Mar 22 Sep 21 Movement Mar 22 Mar 21 Movement
$Am $Am % $Am $Am %
Financial performance summary
Net interest income 1,487 1,373 8 2,860 2,195 30
Fee and commission income 3,435 3,452 (1.1 Executive Summary
Continued
Net operating income
Net operating income of $A17,324 million for the year ended 31 March 2022 increased 36% from $A12,774 million in the prior year.
The increase was primarily driven by higher Fee and commission income, Net other operating income and Net interest and trading income.
Net interest and trading income Fee and commission income
FULL YEAR TO FULL YEAR TO
31 Mar 22
$Am
31 Mar 21
$Am
µ 21%
on prior year
31 Mar 22
$Am
31 Mar 21
$Am
µ 33%
on prior year
6,856 5,677 6,887 5,176
• Higher commodities income mainly driven by increased risk • MAM included higher base fee income primarily driven by the
management income with gains across the platform, particularly acquisition of Waddell & Reed and a disposition fee from MIC.
from Gas and Power, Resources, Agriculture, and Global Oil in CGM. • Higher mergers and acquisitions fee income and debt capital
• Growth in the private credit portfolio in Macquarie Capital. markets fee income in Macquarie Capital.
• Growth in the average loan portfolio as well as average deposit Partially offset by:
volumes in BFS.
• lower performance fees in MAM following a strong prior year
Partially offset by: • lower equity capital market fee income and brokerage income in
• lower income in Corporate due to accounting volatility from Macquarie Capital.
changes in the fair value of economic hedges
• the impact of fair value adjustments across the derivatives
portfolio in CGM.
Net operating lease income Share of net profits/(losses) from associates and joint ventures
µ
FULL YEAR TO FULL YEAR TO
31 Mar 22
$Am
31 Mar 21
$Am
¶ 14%
on prior year
31 Mar 22
$Am
31 Mar 21
$Am
significantly
402 466 240 (3) on prior year
• Reduction in secondary income in Technology, Media and • Increased equity accounted income from MIC and lower equity
Telecoms as well as the partial sale of the UK Meters portfolio accounted losses in Macquarie AirFinance in MAM.
of assets, partially offset by an increase in income from other
areas of the Macquarie Energy, Resources & Sustainability
portfolio, in CGM.
Credit and other impairment charges Net other operating income
FULL YEAR TO FULL YEAR TO
31 Mar 22
$Am
31 Mar 21
$Am
¶ 3%
on prior year
31 Mar 22
$Am
31 Mar 21
$Am
µ 74%
on prior year
(509) (524) 3,448 1,982
• Partial release of COVID-19 overlays in BFS and CGM. Credit • Substantially higher revenue from material asset realisations in
provisioning levels remain prudent with the combined downside the green energy, technology and business services sectors and
macroeconomic scenarios having a higher weighting than the included realisations across all regions in Macquarie Capital.
upside scenario. • Gain on the partial sale of the UK Meters portfolio of
Partially offset by: assets in CGM.
• a small number of underperforming equity investments in Partially offset by:
Macquarie Capital. • the non-recurrence of the gain on sale of Macquarie European
Rail in the prior year in MAM.
8Financial
Result Segment Balance Funding Funds Ten Year
Performance Capital Glossary
Overview Analysis Sheet and Liquidity Management History
Analysis
Operating expenses
Total operating expenses of $A10,785 million for the year ended 31 March 2022 increased 22% from $A8,867 million in the prior year with
increases across all expense categories.
Employment expenses Brokerage, commission and fee expenses
FULL YEAR TO FULL YEAR TO
31 Mar 22
$Am
31 Mar 21
$Am
µ 22%
on prior year
31 Mar 22
$Am
31 Mar 21
$Am
µ 17%
on prior year
6,725 5,517 1,029 879
• Higher performance-related profit share expense and • Higher expenses from the Waddell & Reed acquisition in MAM.
share-based payments mainly as a result of the performance
Partially offset by:
of the Consolidated Entity.
• Higher expenses from the Waddell & Reed acquisition in MAM. • the cessation of grandfathered commission payments to third
party advisors in line with legislation in BFS.
• Higher expenses from wage inflation and higher average
headcount.
Non-salary technology expenses Other operating expenses
FULL YEAR TO FULL YEAR TO
31 Mar 22
$Am
31 Mar 21
$Am
µ 19%
on prior year
31 Mar 22
$Am
31 Mar 21
$Am
µ 25%
on prior year
926 781 2,105 1,690
• Higher investment in technology to support business activity • Higher expenses from the Waddell & Reed acquisition in MAM.
and business growth.
• Higher expenses from the Waddell & Reed acquisition in MAM.
Income tax expense
Income tax expense of $A1,586 million for the year ended 31 March 2022 increased 76% from $A899 million in the prior year, primarily
reflecting higher operating profit before income tax. The effective tax rate for the year ended 31 March 2022 was 25.2%, up from 23.0% in
the prior year.
The higher effective tax rate compared to the prior year was mainly driven by the geographic composition and nature of earnings.
Operating Group Update
Effective 1 April 2022, the Green Investment Group (GIG) has transferred from Macquarie Capital and is operating as part of MAM, bringing
together Macquarie’s specialist capabilities to provide clients with greater access to green investment opportunities.
Macquarie Group Limited 2022 Management Discussion and Analysis
902
Financial
Performance
Analysis
Supporting the transition of
US trucking to zero emission
CGM’s Specialised and Asset Finance division is part of
a consortium that was awarded grant funding by the
California Air Resources Board and the California Energy
Commission’s Clean Transportation Program to deliver
30 XCIENT Class 8 hydrogen fuel cell electric trucks (FCETs)
and the associated refuelling infrastructure in California.
10Financial
Result Segment Balance Funding Funds Ten Year
Performance Capital Glossary
Overview Analysis Sheet and Liquidity Management History
Analysis
The Zero-Emission Drayage Truck and Infrastructure Pilot Project is part
of California Climate Investments, a statewide initiative that puts billions
of Cap‑and‑Trade dollars to work reducing greenhouse gas emissions,
strengthening the economy and improving public health and the
environment — particularly in disadvantaged communities.
Learn more at caclimateinvestments.ca.gov.
Macquarie Group Limited 2022 Management Discussion and Analysis
112.1 Net Interest and Trading Income
HALF YEAR TO FULL YEAR TO
Mar 22 Sep 21 Movement Mar 22 Mar 21 Movement
$Am $Am % $Am $Am %
Net interest income 1,487 1,373 8 2,860 2,195 30
Net trading income 2,337 1,659 41 3,996 3,482 15
Net interest and trading income 3,824 3,032 26 6,856 5,677 21
Net interest income and net trading income are recorded in accordance with Australian Accounting Standards, with net interest income
brought to account using the effective interest method and net trading income predominantly comprising gains and losses relating to
trading activities.
For CGM, which predominantly earns income from trading-related activities, the relative contribution of net interest income and net trading
income from those activities can vary from period to period depending on the underlying trading strategies undertaken by the Consolidated
Entity and its clients.
With respect to businesses that predominantly earn income from lending activities, derivatives that hedge interest rate risk are measured
at fair value through profit or loss (FVTPL). Changes in fair value are presented in net trading income and give rise to income statement
volatility unless designated in a hedge accounting relationship, in which case the carrying value of the hedged item is adjusted for changes
in fair value attributable to the hedged risk to reduce volatility in the income statement. If designated in a cash flow hedge accounting
relationship, the effective portion of the derivative’s fair value gains or losses is deferred in the cash flow hedge reserve as part of Other
Comprehensive Income (OCI), and subsequently recognised in the income statement at the time at which the hedged item affects the income
statement for the hedged risk. For segment reporting, derivatives are accounted for on an accrual basis in the results of the Operating
Groups to the extent that the Corporate segment manages the derivative volatility, either through the application of hedge accounting or
where the derivative volatility may offset the volatility of other positions managed within the Corporate segment.
The presentation of net interest income and net trading income separately can distort the analysis of the underlying activities and drivers.
For example, within Asset Finance (a business within CGM), interest rate swaps are entered into to hedge the interest rate risk associated with
loan assets. The interest income and associated funding costs are recognised in net interest income, however, the related swap is recognised
in net trading income. Accordingly, net interest income and net trading income are presented and discussed below in aggregate for each
Operating Group, which management believes presents a more consistent overview of business performance and allows for a better analysis
of the underlying activities and drivers.
HALF YEAR TO FULL YEAR TO
Mar 22 Sep 21 Movement Mar 22 Mar 21 Movement
$Am $Am % $Am $Am %
MAM (106) (135) (21) (241) (249) (3)
BFS 998 974 2 1,972 1,746 13
CGM
Commodities
Risk management 1,084 949 14 2,033 1,461 39
Lending and financing 96 116 (17) 212 234 (9)
Inventory management and trading 890 189 * 1,079 976 11
Foreign exchange, interest rates and credit 512 376 36 888 748 19
Equities 211 183 15 394 339 16
Asset Finance 61 65 (6) 126 98 29
Macquarie Capital 212 115 84 327 69 *
Corporate (134) 200 * 66 255 (74)
Net interest and trading income 3,824 3,032 26 6,856 5,677 21
12Financial
Result Segment Balance Funding Funds Ten Year
Performance Capital Glossary
Overview Analysis Sheet and Liquidity Management History
Analysis
Net interest and trading income of $A6,856 million for the year (ii) Lending and financing
ended 31 March 2022 increased 21% from $A5,677 million in the
Lending and financing activities include interest income from
prior year.
the provision of loans and working capital finance to clients
across a range of commodity sectors including metals, energy
MAM and agriculture. Commodities lending and financing activities are
primarily secured against underlying assets and typically have
Net interest and trading expense includes funding costs related to
associated hedging to protect against downside risk.
investments, receivables and operating leases.
Lending and financing income of $A212 million for the year ended
Net interest and trading expense of $A241 million for the year
31 March 2022 decreased 9% from $A234 million in the prior year
ended 31 March 2022 decreased 3% from $A249 million in the prior
with reduced contributions in specific sectors.
year, primarily driven by lower funding costs due to a decrease
in investments and lower interest rates, partially offset by the
acquisition of Waddell & Reed. (iii) Inventory management and trading
CGM enters into financial and physical contracts including
exchange traded derivatives, over-the-counter (OTC) derivatives,
BFS storage contracts and transportation agreements as part of
Net interest and trading income in BFS relates to interest income its commodities platform. These arrangements enable CGM
earned from the loan portfolio that primarily comprises home loans, to facilitate client transactions and provide CGM with trading
loans to businesses, car loans and credit cards. BFS also generates opportunities where there is an imbalance between the supply
income from deposits, which are used as a source of funding for the and demand for commodities. Revenue is dependent on a number
Bank Group. of factors including the volume of transactions, the level of risk
assumed and the volatility of price movements across commodity
Net interest and trading income of $A1,972 million for the year
markets and products.
ended 31 March 2022 increased 13% from $A1,746 million in the
prior year mainly due to a 23% growth in the average loan portfolio Storage contracts and transportation agreements, which are
and 19% growth in the average BFS deposit volumes. managed on a fair value basis for financial and risk management
purposes, are required to be accounted for on an accruals basis for
As at 31 March 2022 the loan and deposit portfolios included:
statutory reporting purposes, which may result in some variability
• home loan volumes of $A89.5 billion, up 34% from $A67.0 billion in the timing of reported income.
as at 31 March 2021
• business banking loan volumes of $A11.5 billion, up 13% from Inventory management and trading income of $A1,079 million for
$A10.2 billion as at 31 March 2021 the year ended 31 March 2022 increased 11% from $A976 million in
the prior year. The current year included strong trading gains from
• car loan volumes of $A8.8 billion, down 23% from $A11.5 billion supply and demand imbalances in North American Gas and Power,
as at 31 March 2021, and
partially offset by the unfavourable impact of timing of income
• BFS deposits of $A98.0 billion, up 21% from $A80.7 billion as at recognition on Gas storage and transport contracts.
31 March 2021.
Foreign exchange, interest rates and credit
CGM Net interest and trading income from foreign exchange, interest
Net interest and trading income of $A4,732 million for the year rates and credit related activities are generated from the provision
ended 31 March 2022 increased 23% from $A3,856 million in the of trading and hedging services to a range of corporate and
prior year: institutional clients globally, in addition to making secondary
markets in corporate debt securities, syndicated bank loans and
Commodities
middle market loans and providing specialty lending.
(i) Risk management Net interest and trading income from foreign exchange, interest
Income from risk management is driven by managing clients’ rates and credit related activities of $A888 million for the year
exposure to commodity price volatility which is supported by our ended 31 March 2022 increased 19% from $A748 million in the
strong internal risk management framework. prior year due to increased client activity in global structured
foreign exchange products and growth in securitisation and
Risk management income of $A2,033 million for the year ended
credit products.
31 March 2022 increased 39% from $A1,461 million in the prior year
with contributions across the platform. Increased contributions
were recorded by Gas and Power, Resources, Agriculture, and Global
Oil due to increased client hedging activity and gains associated
with management of those exposures as a result of elevated
levels of volatility and price movements in commodity markets,
partially offset by the impact of fair value adjustments across the
derivatives portfolio.
Macquarie Group Limited 2022 Management Discussion and Analysis
132.1 Net Interest and Trading Income
Continued
Equities Macquarie Capital
Equities net interest and trading income is generated from the Net interest and trading income includes the interest income
issue of derivative products in key locations, the provision of equity earned from debt investments and the funding costs associated
finance solutions to institutional clients and the conduct of risk with both the debt and equity investment portfolios.
management and trading activities.
Net interest and trading income of $A327 million for the year ended
Equities net interest and trading income of $A394 million for the 31 March 2022 increased significantly from $A69 million in the prior
year ended 31 March 2022 increased 16% from $A339 million in year. The increase was primarily due to higher net interest income
the prior year due to an improved performance in equity finance. driven by the growth in the private credit portfolio, which more
In addition, there was a continued strong contribution from than doubled throughout the current year.
trading activities.
Asset Finance Corporate
Net interest and trading income in Asset Finance predominantly Net interest and trading income in the Corporate segment includes
relates to net income from the loan and finance lease portfolios the net result of managing Macquarie’s liquidity and funding
(including shipping finance, equipment and technology financing) requirements, earnings on capital, funding costs associated with
and the funding costs associated with the operating lease portfolios investments held centrally and accounting volatility arising from
(including energy, telecommunication and mining assets). movements in underlying rates relating to economically hedged
positions where hedge accounting is unable to be achieved.
Asset Finance net interest and trading income of $A126 million for
the year ended 31 March 2022 increased 29% from $A98 million in Net interest and trading income of $A66 million for the year ended
the prior year due to net proceeds from end of lease asset sales and 31 March 2022 decreased 74% from $A255 million in the prior year
increased earnings from the structured lending and shipping finance mainly due to accounting volatility from the changes in the fair
portfolios. value of economic hedges.
14Financial
Result Segment Balance Funding Funds Ten Year
Performance Capital Glossary
Overview Analysis Sheet and Liquidity Management History
Analysis
2.2 Fee and Commission Income
HALF YEAR TO FULL YEAR TO
Mar 22 Sep 21 Movement Mar 22 Mar 21 Movement
$Am $Am % $Am $Am %
Base fees 1,422 1,374 3 2,796 2,011 39
Other asset management fees 240 218 10 458 294 56
Base fees and other asset management fees 1,662 1,592 4 3,254 2,305 41
Performance fees 218 177 23 395 660 (40)
Mergers and acquisitions, advisory and underwriting fees 755 618 22 1,373 858 60
Brokerage and other trading-related fee income 420 381 10 801 816 (2)
Other fee and commission income 380 684 (44) 1,064 537 98
Total fee and commission income 3,435 3,452 (2.2 Fee and Commission Income
Continued
Base fees Mergers and acquisitions, advisory and
Base fees of $A2,796 million for the year ended 31 March 2022
increased 39% from $A2,011 million in the prior year.
underwriting fees
Mergers and acquisitions, advisory and underwriting fees of
Base fees, which are typically generated from funds management $A1,373 million for the year ended 31 March 2022 increased 60%
activities, are mainly attributable to MAM. MAM’s base fees of from $A858 million in the prior year and were mainly attributable to
$A2,771 million for the year ended 31 March 2022 increased Macquarie Capital.
40% from $A1,985 million in the prior year, primarily driven
by the acquisition of Waddell & Reed, investments made by The increase was primarily due to higher mergers and acquisitions
Private Markets-managed funds and mandates and Public fee income across all major regions and debt capital markets fee
Investments market movements. This was partially offset by income, partially offset by lower equity capital markets fee income
foreign exchange movements and asset realisations in Private in Macquarie Capital.
Markets-managed funds.
Refer to section 7 for further details of MAM’s Assets under Brokerage and other trading-related
Management (AUM) and Equity under Management (EUM).
fee income
Brokerage and other trading-related fee income primarily includes
Other asset management fees brokerage income from the Equity Derivatives and Trading and
Other asset management fees includes fees earned on the BFS Futures businesses in CGM, the Equities business in Macquarie
Wrap platform, as well as distribution and marketing service Capital and brokerage income from the provision of wealth
fees in MAM. services in BFS.
Other asset management fees of $A458 million for the year ended Brokerage and other trading-related fee income of $A801 million for
31 March 2022 increased 56% from $A294 million in the prior year. the year ended 31 March 2022 was broadly in line with $A816 million
The increase was driven by distribution services fees following the in the prior year.
acquisition of Waddell & Reed.
Other fee and commission income
Performance fees Other fee and commission income includes fees earned on a range
Performance fees of $A395 million for the year ended 31 March of BFS’ products and services including BFS Wrap and Vision
2022 decreased 40% from $A660 million in the prior year. platforms, home loans, car loans, credit cards, business loans and
deposits. MAM includes fees related to MIC disposition, distribution
Performance fees, which are typically generated from services and transactions, transfer agent oversight services, capital
Macquarie-managed funds and assets that have outperformed raisings, brokerage and commission income and income from
pre-defined benchmarks, consisted of performance fees from a True Index products, while CGM includes structured, index and
range of funds including Macquarie Infrastructure Partners (MIP) III, retail products.
Macquarie European Infrastructure Fund (MEIF) 4 and other Private
Markets-managed funds, managed accounts and co-investors. The Other fee and commission income of $A1,064 million for the year
prior year included performance fees from MIP II, MIP III, MEIF4, ended 31 March 2022 increased 98% from $A537 million in the prior
Macquarie Super Core Infrastructure Fund (MSCIF) and other Private year, primarily in MAM, due to a disposition fee from MIC.
Markets-managed funds, managed accounts and co-investors.
16Financial
Result Segment Balance Funding Funds Ten Year
Performance Capital Glossary
Overview Analysis Sheet and Liquidity Management History
Analysis
2.3 Net Operating Lease Income
HALF YEAR TO FULL YEAR TO
Mar 22 Sep 21 Movement Mar 22 Mar 21 Movement
$Am $Am % $Am $Am %
Rental income 395 359 10 754 949 (21)
Depreciation and other operating lease-related charges (179) (173) 3 (352) (483) (27)
Net operating lease income 216 186 16 402 466 (14)
Net operating lease income of $A402 million for the year ended 31 March 2022, decreased 14% from $A466 million in the prior year, primarily
due to a reduction in secondary income in Technology, Media and Telecoms as well as the partial sale of the UK Meters portfolio of assets,
comprising the industrial and commercial portfolio, partially offset by an increase in income from other areas of the Macquarie Energy,
Resources & Sustainability portfolio in CGM.
The total operating lease portfolio was $A3.6 billion as at 31 March 2022, an increase of 29% from $A2.8 billion as at 31 March 2021, driven
by newly originated operating leases in the commodities business. The operating lease assets related to the partial sale of CGM’s UK Meters
portfolio of assets in the current year were recognised as Held for sale as at 31 March 2021.
2.4 Share of Net (Losses)/Profits from Associates and Joint Ventures
HALF YEAR TO FULL YEAR TO
Mar 22 Sep 21 Movement Mar 22 Mar 21 Movement
$Am $Am % $Am $Am %
Share of net (losses)/profits from associates
and joint ventures (2) 242 * 240 (3) *
Share of net profits from associates and joint ventures was $A240 million for the year ended 31 March 2022 compared to losses of
$A3 million in the prior year. The movement was primarily driven by equity accounted income from MIC and lower equity accounted losses
from Macquarie AirFinance in MAM in the current year, partially offset by an increase in equity accounted losses in Macquarie Capital due to a
change in the composition and performance of the investment portfolio.
Macquarie Group Limited 2022 Management Discussion and Analysis
172.5 Credit and Other Impairment Charges
HALF YEAR TO FULL YEAR TO
Mar 22 Sep 21 Movement Mar 22 Mar 21 Movement
$Am $Am % $Am $Am %
Credit impairment (charges)/reversals
Loan assets (39) (64) (39) (103) (323) (68)
Held for sale and other assets (31) (52) (40) (83) (50) 66
Loans to associates and joint ventures (6) (33) (82) (39) (17) 129
Margin money and settlement assets (15) (11) 36 (26) (42) (38)
Financial investments 2 (4) * (2) 5 *
Off balance sheet exposures 13 (12) * 1 (9) *
Gross credit impairment charges (76) (176) (57) (252) (436) (42)
Recovery of amounts previously written off 2 – * 2 2 –
Net credit impairment charges (74) (176) (58) (250) (434) (42)
Other impairment (charges)/reversals
Interests in associates and joint ventures (175) (5) * (180) 65 *
Intangible and other non-financial assets (30) (49) (39) (79) (155) (49)
Net other impairment charges (205) (54) 280 (259) (90) 188
Total credit and other impairment charges (279) (230) 21 (509) (524) (3)
HALF YEAR TO FULL YEAR TO
Mar 22 Sep 21 Movement Mar 22 Mar 21 Movement
$Am $Am % $Am $Am %
MAM (4) 116 * 112 85 32
BFS 53 (31) * 22 (115) *
CGM (7) (58) (88) (65) (237) (73)
Macquarie Capital (364) (209) 74 (573) (229) 150
Corporate 43 (48) * (5) (28) (82)
Total credit and other impairment charges (279) (230) 21 (509) (524) (3)
Total credit and other impairment charges of $A509 million for the year ended 31 March 2022 decreased 3% from $A524 million in the prior
year. This included $A250 million of net credit impairment charges, which decreased 42% from $A434 million in the prior year, driven by the
partial release of COVID-19 overlays. Credit provisioning levels remain prudent with the combined downside macroeconomic scenarios having
a higher weighting than the upside scenario.
Net credit impairment charges include losses arising from defaulted positions and expected credit losses calculated on a forward-looking
basis using modelled outcomes as well as overlays reflecting management judgement for modelling, regional and industry specific risks.
Net other impairment charges include impairments on a small number of underperforming equity investments in Macquarie Capital, partially
offset by the reversal of an impairment previously recognised on MAM’s investment in MIC.
18Financial
Result Segment Balance Funding Funds Ten Year
Performance Capital Glossary
Overview Analysis Sheet and Liquidity Management History
Analysis
MAM Macquarie Capital
Credit and other impairment reversals of $A112 million for the Credit and other impairment charges of $A573 million for the year
year ended 31 March 2022, increased 32% from $A85 million in the ended 31 March 2022, compared to charges of $A229 million in
prior year. the prior year, primarily due to a small number of underperforming
equity investments and growth of the private credit portfolio.
The current and prior year included reversals of the impairment
previously recognised on MAM’s investment in MIC.
Corporate
BFS Credit and other impairment charges of $A5 million for the year
ended 31 March 2022, decreased 82% from $A28 million in the prior
Credit and other impairment reversals of $A22 million for the year
year which included the impairment of intangibles partially offset by
ended 31 March 2022, compared to a charge of $A115 million in
the partial release of credit provisions.
the prior year driven by the partial release of COVID-19 overlays
and sale of the Macquarie dealer portfolio to Allied Credit, partially For further information on the Consolidated Entity’s determination
offset by growth in the remaining loan portfolio. Credit provisioning of its expected credit losses, please refer to Note 13 Expected credit
levels remain prudent with the combined downside macroeconomic losses in the Financial Report.
scenarios having a higher weighting than the upside scenario.
CGM
Credit and other impairment charges of $A65 million for the year
ended 31 March 2022, decreased 73% from $A237 million in the
prior year driven by the partial release of COVID-19 overlays.
Credit provisioning levels remain prudent with the combined
downside macroeconomic scenarios having a higher weighting
than the upside scenario.
Macquarie Group Limited 2022 Management Discussion and Analysis
192.6 Net Other Operating Income
HALF YEAR TO FULL YEAR TO
Mar 22 Sep 21 Movement Mar 22 Mar 21 Movement
$Am $Am % $Am $Am %
Investment income
Net gain on disposal of businesses and subsidiaries(1) 1,995 794 151 2,789 239 *
Net gain on financial investments 126 122 3 248 220 13
Net gain on interests in associates and joint ventures 146 44 232 190 1,063 (82)
Net gain on non-financial assets 30 34 (12) 64 492 (87)
Net gain on change of control, joint control
and/or significant influence – – – – 9 (100)
Total investment income 2,297 994 131 3,291 2,023 63
Subsidiaries held for investment purposes (2)
Net Operating Revenue(3) 160 287 (44) 447 354 26
Expenses (4)
(208) (265) (22) (473) (504) (6)
Net (loss)/profit from subsidiaries held for
investment purposes (48) 22 * (26) (150) (83)
Other income 77 106 (27) 183 109 68
Total net other operating income 2,326 1,122 107 3,448 1,982 74
Total net other operating income of $A3,448 million for the year ended 31 March 2022 increased 74% from $A1,982 million in the prior
year. This increase was mainly driven by material asset realisations in Macquarie Capital and the gain on the partial sale of the UK Meters
portfolio of assets, comprising the industrial and commercial portfolio in CGM, while the prior year included the sale of Macquarie
European Rail in MAM.
Investment income
Investment income of $A3,291 million for the year ended 31 March 2022 increased 63% from $A2,023 million in the prior year. The increase
was primarily driven by substantially higher revenue from material asset realisations in the green energy, technology and business services
sectors in Macquarie Capital and the gain on the partial sale of the UK Meters portfolio of assets in CGM. This was partially offset by
the non-recurrence of gains on sale of Macquarie European Rail and other investments as well as lower gains on revaluation of property
investments in MAM.
Subsidiaries held for investment purposes
Net loss from subsidiaries held for investment purposes of $A26 million for the year ended 31 March 2022 decreased 83% from a loss of
$A150 million in the prior year. The movement primarily reflected gains on sale of green energy projects and a change in the composition of
the portfolio in Macquarie Capital.
Other income
Other income of $A183 million for the year ended 31 March 2022 increased 68% from $A109 million in the prior year. The increase included
transition services revenue following the sale of Waddell & Reed’s wealth management platform to LPL Financial Holdings Inc.
(1) Includes $A274 million (2021: nil) attributable to non-controlling interests.
(2) Subsidiaries held for investment purposes are consolidated entities that are held with the ultimate intention to sell as part of Macquarie’s investment activities.
(3) Includes revenue of $A1,176 million (2021: $A968 million) after deduction of $A729 million (2021: $A614 million) related to cost of goods sold.
(4) Includes employment expenses, depreciation, amortisation expenses and other operating expenses.
20Financial
Result Segment Balance Funding Funds Ten Year
Performance Capital Glossary
Overview Analysis Sheet and Liquidity Management History
Analysis
2.7 Operating Expenses
HALF YEAR TO FULL YEAR TO
Mar 22 Sep 21 Movement Mar 22 Mar 21 Movement
$Am $Am % $Am $Am %
Employment expenses
Salary and related costs including commissions,
superannuation and performance-related profit share (2,999) (2,628) 14 (5,627) (4,522) 24
Share-based payments (340) (319) 7 (659) (582) 13
Provision for long service leave and annual leave (24) (54) (56) (78) (86) (9)
Total compensation expenses (3,363) (3,001) 12 (6,364) (5,190) 23
Other employment expenses including on-costs, staff
procurement and staff training (198) (163) 21 (361) (327) 10
Total employment expenses (3,561) (3,164) 13 (6,725) (5,517) 22
Brokerage, commission and fee expenses (531) (498) 7 (1,029) (879) 17
Non-salary technology expenses (509) (417) 22 (926) (781) 19
Other operating expenses
Occupancy expenses (175) (182) (4) (357) (382) (7)
Professional fees (335) (241) 39 (576) (495) 16
Indirect and other taxes (85) (85) – (170) (154) 10
Advertising and promotional expenses (82) (96) (15) (178) (100) 78
Amortisation of intangibles assets (64) (70) (9) (134) (63) 113
Audit fees (38) (26) 46 (64) (55) 16
Other (336) (290) 16 (626) (441) 42
Total other operating expenses (1,115) (990) 13 (2,105) (1,690) 25
Total operating expenses (5,716) (5,069) 13 (10,785) (8,867) 22
Total operating expenses of $A10,785 million for the year ended 31 March 2022 increased 22% from $A8,867 million in the prior year.
The increase in operating expenses was mainly as a result of the one-off acquisition and ongoing costs related to Waddell & Reed, which had a
material impact across all operating expense categories. In addition, the current year included higher employment expenses driven mainly by
higher performance-related profit share expense and share-based payments as a result of the performance of the Consolidated Entity, wage
inflation and higher average headcount.
Macquarie Group Limited 2022 Management Discussion and Analysis
212.8 Headcount
AS AT MOVEMENT
Sep 21 Mar 21
Mar 22 Sep 21 Mar 21 % %
Headcount by Operating Group(1)
MAM 2,399 2,354 1,921 2 25
BFS 3,359 3,152 2,986 7 12
CGM 2,179 2,120 2,133 3 2
Macquarie Capital 1,843 1,831 1,821 1 1
Total headcount – Operating Groups 9,780 9,457 8,861 3 10
Total headcount – Corporate 8,353 7,752 7,598 8 10
Total headcount 18,133 17,209 16,459 5 10
Headcount by region
Australia(2) 8,332 7,652 7,283 9 14
International:
Americas 3,205 3,161 2,681 1 20
Asia 3,972 3,939 4,063 1 (2)
Europe, Middle East and Africa 2,624 2,457 2,432 7 8
Total headcount – International 9,801 9,557 9,176 3 7
Total headcount 18,133 17,209 16,459 5 10
International headcount ratio (%) 54 56 56
Total headcount increased 10% to 18,133 as at 31 March 2022 from 16,459 as at 31 March 2021, mainly due to the acquisition of Waddell &
Reed in MAM, increased headcount in the Central Service Groups to support MGL’s Operating Groups as well as increased headcount in BFS to
support business growth and regulatory requirements.
(1) Headcount numbers in this document includes staff employed in certain operationally segregated subsidiaries (OSS).
(2) Includes New Zealand.
22Financial
Result Segment Balance Funding Funds Ten Year
Performance Capital Glossary
Overview Analysis Sheet and Liquidity Management History
Analysis
2.9 Income Tax Expense
FULL YEAR TO
Mar 22 Mar 21
$Am $Am
Operating profit before income tax 6,539 3,907
Prima facie tax @ 30% 1,962 1,172
Income tax permanent differences (376) (273)
Income tax expense 1,586 899
Effective tax rate (1)
25.2% 23.0%
Income tax expense of $A1,586 million for the year ended 31 March 2022 increased 76% from $A899 million in the prior year, primarily
reflecting the higher operating profit before income tax. The effective tax rate for the year ended 31 March 2022 was 25.2%, up from 23.0%
in the prior year.
The higher effective tax rate compared to the prior year was mainly driven by the geographic composition and nature of earnings.
(1) The effective tax rate is calculated on Operating profit before income tax and after non-controlling interests. Non-controlling interests reduced operating profit before income tax by
$A247 million for the full year ended 31 March 2022 (31 March 2021: increased operating profit before income tax by $A7 million).
Macquarie Group Limited 2022 Management Discussion and Analysis
2303
Segment
Analysis
Vocus, Australia
Vocus owns and operates Australia’s second largest
inter‑capital city fibre network. A Macquarie-led consortium
acquired the business in June 2021 and is supporting
investment to expand its network and capacity to support
the communications needs of cities and rural areas.
24Financial
Result Segment Balance Funding Funds Ten Year
Performance Capital Glossary
Overview Analysis Sheet and Liquidity Management History
Analysis
Macquarie Group Limited 2022 Management Discussion and Analysis
253.1 Basis of Preparation
Operating Segments The Corporate segment, which is not considered an Operating
Group, comprises head office and Central Service Groups, including
AASB 8 Operating Segments requires the ‘management approach’ Group Treasury, and holds certain legacy and strategic investments,
to disclosing information about the Consolidated Entity’s reportable assets and businesses that are not allocated to any of the
segments. The financial information is reported on the same basis Operating Groups.
as used internally by Senior Management for evaluating Operating
Segment performance and for deciding how to allocate resources Items of income and expense within the Corporate segment include
to Operating Segments. Such information may be produced the net result of managing Macquarie’s liquidity and funding
using different measures to that used in preparing the statutory requirements, earnings on capital and the residual accounting
income statement. volatility relating to economically hedged positions where
hedge accounting is applied, as well as accounting volatility for
For internal reporting, performance measurement and risk other economically hedged positions where hedge accounting is
management purposes, the Consolidated Entity is divided into not applicable.
Operating Groups and a Corporate segment (reportable segments).
Other items of income and expenses within the Corporate segment
The financial information disclosed relates to the Consolidated include earnings from investments, changes in central overlays to
Entity’s ordinary activities. impairments or valuation of assets, unallocated head office costs
These segments have been set up based on the different core and costs of Central Service Groups, the Consolidated Entity’s
products and services offered. The Operating Groups comprise: performance-related profit share and share-based payments
expense, income tax expense and certain distributions attributable
• MAM provides investment solutions to clients across a range of to certain non-controlling interests.
capabilities in Private Markets and Public Investments, including
infrastructure, green investments, agriculture and natural Below is a selection of key policies applied in determining the
assets, real estate, private credit, asset finance, equities, fixed Operating Segment results.
income and multi-asset solutions
• BFS provides a diverse range of personal banking, wealth
management, and business banking products and services to Internal funding arrangements
retail clients, advisers, brokers and business clients Group Treasury has the responsibility for managing funding for the
• CGM is a global business offering capital and financing, risk Consolidated Entity, and Operating Groups obtain their funding
management, market access, physical execution and logistics from Group Treasury. The interest rates charged by Group Treasury
solutions to its diverse client base across Commodities, Financial are determined by the currency and term of the funding. Break
Markets and Asset Finance costs may be charged to Operating Groups for the early repayment
• Macquarie Capital has global capability in advisory and capital of term funding.
raising services, investing alongside partners and clients across Generally, Operating Groups may only source funding directly from
the capital structure, providing clients with specialist expertise, external sources where the funding is secured by the Operating
advice and flexible capital solutions across a range of sectors. Group’s assets. In such cases the Operating Group bears the funding
It also has global capability in development and investment costs directly and Group Treasury may levy additional charges
in infrastructure and energy projects and companies, with a where appropriate.
focus on transport, digital and social infrastructure. Macquarie
Capital’s Equities brokerage business provides clients with Deposits are a funding source for the Bank Group. The value of
access to equity research, sales, execution capabilities and deposits that the Bank Group generates is recognised within Net
corporate access. interest and trading income for segment reporting purposes.
Effective 1 April 2022, the Green Investment Group (GIG)
has transferred from Macquarie Capital and is operating Transactions between Operating
as part of MAM, bringing together Macquarie’s specialist
capabilities to provide clients with greater access to green Segments
investment opportunities. Operating Segments that enter into arrangements with other
Operating Segments must do so on commercial terms or as agreed
by the Consolidated Entity’s Chief Executive Officer or Chief
Financial Officer.
Internal transactions are recognised in each of the relevant
categories of income and expense and eliminated on consolidation
as appropriate.
26Financial
Result Segment Balance Funding Funds Ten Year
Performance Capital Glossary
Overview Analysis Sheet and Liquidity Management History
Analysis
Accounting for derivatives that Performance-related profit share and
economically hedge interest rate risk share-based payments expense
With respect to businesses that predominantly earn income from Performance-related profit share and share-based payments
lending activities, derivatives that hedge interest rate risk are expense relating to the Macquarie Group Employee Retained Equity
measured at fair value through profit or loss (FVTPL). Changes in fair Plan (MEREP) are recognised in the Corporate segment and are not
value are presented in net trading income and gives rise to income allocated to Operating Groups.
statement volatility unless designated in a hedge accounting
relationship, in which case the carrying value of the hedged item
is adjusted for changes in fair value attributable to the hedged Income tax
risk to reduce volatility in the income statement. If designated in Income tax expense and benefits are recognised in the Corporate
a cash flow hedge accounting relationship, the effective portion segment and are not allocated to the Operating Groups. However,
of the derivative’s fair value gains or losses is deferred in the cash to recognise an Operating Group’s contribution to permanent
flow hedge reserve as part of Other comprehensive income (OCI), income tax differences, the internal management revenue/charge
and subsequently recognised in the income statement at the category is used.
time at which the hedged item affects the income statement for
This internal management revenue/charge category, which is
the hedged risk. For segment reporting purposes, derivatives are
primarily used for permanent income tax differences generated by
accounted for on an accrual basis in the results of the Operating
the Operating Groups, are offset by an equal and opposite amount
Groups to the extent that the Corporate segment manages the
recognised in the Corporate segment such that they are eliminated
derivative volatility, either through the application of hedge
on consolidation.
accounting or where the derivative volatility may offset the
volatility of other positions managed within the Corporate segment.
Presentation of segment income
Central Service Groups statements
The Central Service Groups provide a range of functions supporting The income statements on the following pages for each of the
MGL’s Operating Groups, ensuring they have the appropriate reported segments are in some cases summarised by grouping
workplace support and systems to operate effectively and the non-material balances together. Where appropriate, all material or
necessary resources to meet their regulatory, compliance, financial key balances have been reported separately to provide users with
reporting, legal and risk management requirements. information relevant to the understanding of the Consolidated
Entity’s financial performance. The financial information disclosed
Central Service Groups recover their costs from Operating Groups
relates to the Consolidated Entity’s ordinary activities.
generally on either a time and effort allocation basis or a fee
for service basis. Central Service Groups include the Corporate
Operations Group (COG), Financial Management Group (FMG), Risk
Management Group (RMG), Legal and Governance Group (LGG) and
Central Executive.
Macquarie Group Limited 2022 Management Discussion and Analysis
27You can also read