Long Term Trend Analysis of Upstream and Middle-Stream River in Langat Basin, UKM
←
→
Page content transcription
If your browser does not render page correctly, please read the page content below
Sains Malaysiana 50(3)(2021): 629-644
http://dx.doi.org/10.17576/jsm-2021-5003-06

 Long Term Trend Analysis of Upstream and Middle-Stream River in Langat Basin,
 Selangor, Malaysia
 (Analisis Tren Jangka Panjang Huluan dan Aliran Tengah Sungai di Lembangan Langat, Selangor, Malaysia)

 S ITI H AWA M OHD Y USOFF, F IRDAUS M OHAMAD H AMZAH*, O THMAN J AAFAR & H AZRINA T AJUDIN

 ABSTRACT
The present study investigates the trend in long term monthly streamflow of Sungai Lui (upstream) and Sungai Kajang
(middle-stream) of the Sungai Langat Basin located in Selangor, Malaysia. The Mann-Kendall (MK) and Innovative
Trend Method (ITM) tests were utilized to assess the trends at the two stations. The trend free pre-whitening (TFPW) and
variance correction (VC) tests were used to assess the effects of serial correlation on the established trend, and Sen’s slope
estimator was used to assess the magnitude of streamflow. Based on Sen’s Slope estimator results, the trend magnitude
for Lui station is very small compared to the Kajang station. The Kajang station shows the highest increase in trend
magnitude for November. The results of TFPW and VC trend tests showed that the most significant increasing trend of
months occurred at Kajang station, while the less increasing significant trend of months occurred at Lui station. It can
be concluded that similar trend results were obtained when the modified Mann-Kendall and ITM were applied to the
same data for Sungai Lui and Sungai Kajang. The study found that there is a significant difference in terms of trend and
magnitud between upstream and middle-stream.
Keywords: Innovative trend method; Mann-Kendall; Sen’s slope; trend free pre-whitening; variance correction

 ABSTRAK
Kajian dilakukan terhadap tren aliran bulanan jangka panjang bagi Sungai Lui (aliran hulu) dan Sungai Kajang
(aliran tengah) di Lembangan Sungai Langat yang terletak di Selangor, Malaysia. Ujian Mann-Kendall (MK) dan Kaedah
Inovatif Tren (ITM) digunakan untuk menilai tren aliran di kedua-dua stesen tersebut. Ujian pra-pemutihan bebas tren
(TFPW) dan pembetulan varians (VC) digunakan untuk menilai kesan korelasi bersiri pada tren dan penganggar cerun
Sen digunakan untuk menilai magnitud aliran sungai. Berdasarkan hasil penganggar cerun Sen, magnitud tren untuk
stesen Lui sangat kecil berbanding dengan stesen Kajang. Stesen Kajang menunjukkan peningkatan tren magnitud
tertinggi untuk bulan November. Hasil ujian tren TFPW dan VC menunjukkan bahawa peningkatan tren bulanan yang
paling ketara berlaku di stesen Kajang, sementara peningkatan tren bulanan yang kurang ketara berlaku di stesen Lui.
Ia dapat disimpulkan bahawa hasil keputusan tren yang sama diperoleh apabila kaedah modifikasi Mann-Kendall dan
ITM diterapkan pada data yang sama untuk Sungai Lui dan Sungai Kajang. Kajian ini mendapati bahawa terdapat
perbezaan yang signifikan daripada segi tren dan magnitud aliran di antara aliran hulu dan aliran tengah.
Kata kunci: Cerun Sen; kaedah innovatif tren; Mann-Kendall; pembetulan varians; ujian tren pra-pemutihan

 I NTRODUCTION hydrological cycle (Rim 2017). Also, watersheds under
Many studies of varying scales have been conducted at similar climate and soils conditions, topography and land
many different locations to determine streamflow trend and use could be the primary factors determining the streamflow
other climatic variables. Increasing variation in streamflow response to precipitation (Wang et al. 2018). Previous
due to the changing climate has altered the hydrological studies have found that pastures or agricultural lands could
cycle. These changes may be gradual (trend) or abrupt have higher streamflow yields and amplitude, while forests
(shift). Geographical factors (i.e. freshwater area, elevation, generally have lower water yield compared with pastures
urbanization, and proximity to coast) and climatic factors (Cristina et al. 2015). These hydrological changes may
(i.e. air temperature, wind speed, relative humidity, and lead to the under-designed or over-designed of projects
solar radiation) are among the factors that influence the (Sagarika et al. 2014).
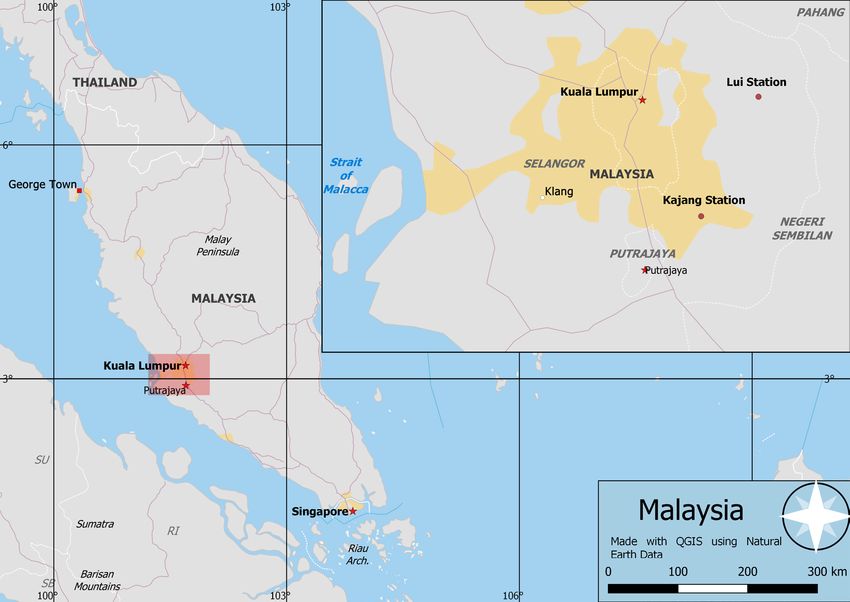
630

 The majority of previous hydrological studies used climatic or hydrological parameters have been conducted
non-parametric techniques, especially the Mann-Kendall using different methods. Trend tests such as Mann-Kendall
trend test and Sen’s slope estimator statistical tools. These and Sen’s slope estimator have been widely used in the
tests are robust against outliers, distribution free and are analysis of streamflow (Ebrahimian et al. 2018; Jan et al.
not sensitive to abrupt breaks in the time series (Chen et 2018; Rao et al. 2011), rainfall (Palizdan et al. 2015, 2014;
al. 2016; Hamzah et al. 2017; Rahman et al. 2017; Sa et Sa et al. 2017), temperature (Amirabadizadeh et al. 2015)
al. 2017; Zhao et al. 2015). The magnitude (slope) of trend and water quality (Samsudin et al. 2017). Therefore, the
can be computed by using the slope estimator proposed by main purpose of this study was to present a trend analysis
Sen (1968). Sen’s slope estimator has been widely used of the streamflow of Sungai Langat Basin in Selangor,
in hydro-meteorological time series (da Silva et al. 2015; Malaysia. The trend analysis is very important for water
Mustapha 2013; Thenmozhi & Kottiswaran 2016). resources planning, design and management in that area.
 On the other hand, the serial correlation needs to be
performed before performing the Mann-Kendall trend M ETHODS
test. The effect of serial correlation has to be taken into
account since the Mann-Kendall trend test assumes that STUDY AREA AND DATA SET
the sample data are serially independent (Azam et al. 2018;
 The map in Figure 1 shows the location of Sungai Langat
Diop et al. 2017). Note that α (the significance level) is
 located in the state of Selangor, Malaysia. The Sungai
the tolerable probability that the Mann-Kendall trend test
 Langat basin has a total catchment area of approximately
will falsely reject the null hypothesis. Falsely rejecting
 1815 km2 and lies within longitude 101°17′E to 101°55′E
the true null hypothesis is called a Type I error. The
 and latitudes 2°40′N to 3°17′N. The Sungai Langat basin
probability of Type I error is decreased when the data are
 is one of the most important basins which supply water to
independent. The presence of a positive serial dependence
 two-thirds of the state of Selangor. Sungai Langat flows
would increase the probability of rejecting the no-trend
 from the Titiwangsa Range in the Northeast of Hulu Langat
hypothesis (Bayazit & Önöz 2009), and the trend may be
 District and drains into the Straits of Malacca. There are
incorrectly estimated (Chattopadhyay & Edwards 2016).
 four gauging stations along Sungai Langat, namely Lui
To overcome this problem, Yue and Wang (2002) and
 (station no. 3118445), Kajang (station no. 2917401),
Yue et al. (2002) applied the Trend Free Pre-Whitening
 Semenyih (station no. 2918401), and Dengkil (station no.
method to the data series, where the serial correlation was
 2816441) stations (respectively. The important parameters
firstly removed and the trend test was then performed on
 selected for the study were river flowrate, precipitation
the uncorrelated residuals (Hajani et al. 2017; Piyoosh
 distribution, and the baseflow (Hamzah et al. 2019; Yang
& Ghosh 2017). Furthermore, Hamed and Rao (1998)
 et al. 2011).
introduced the modified Mann-Kendall trend test through
 The map in Figure 1 shows the location of Sungai
the variance correction approach to account for the effect
 Lui station and Sungai Kajang station. Table 1 shows
of serial correlation (Salman et al. 2017). Recently, the
 that there are two streamflow gauging stations along
innovative trend method (ITM) proposed by Sen (2012) has
 with Sungai Langat basin. Sungai Lui station (station no.
been successfully applied in the hydrological time series.
 3118445) at Kg Sungai Lui is an upstream river with a
This new method does not impose any restriction and can
 mean elevation of 76.8 m. While Sungai Langat at Kajang
be utilized whether the time series is serially correlated,
 (Sungai Kajang) (station no. 2917401) is a middle-stream
non-normally distributed, or has a short record length. It
 river with a mean elevation of 22.9 m. Sungai Lui and
can also be grouped into low, medium, and high, which
 Kajang basin have different geographical characteristics
facilitates the identification of the pattern of trend (Ay &
 and land use. Table 2 which was obtained from Memarian
Kisi 2015; Kisi et al. 2018; Sen 2014; Terzioglu et al. 2019).
 and Balasundram (2016), shows that Sungai Kajang basin
 In Malaysia, the study on streamflow or rainfall trend
 was more urbanised and has a built-up area of 5649.90 ha
is becoming increasingly important in an effort to evaluate
 compared to Sungai Lui, which has a built-up are of only
the hydrological pattern for future flood assessment since
 111.09 ha. Lui is a more densely forested areas (359.75 ha)
flood is the most common natural disaster in Malaysia.
 while Kajang has less forested areas (112.04 ha). Table 3
The misuse of natural resources in Malaysia, such as
 shows that, during period between 1984 and 2006, 34%
uncontrolled discharge of pollution, energy development
 of rubber plantations in the Kajang sub-basin have been
projects, development of livestock production, and
 transformed into urban areas and another 11% has been
massive land reclamation, may have contributed to the
 converted into other agricultural production. In the Lui sub-
occurrences of flood events, stream degradation, and
 basin, 21% of rubber plantations have been transformed
erosion (Sulaiman et al. 2015). Numerous studies on
631

into agricultural production and 5% was transformed into is a common occurrence during the inter-monsoon period.
urban areas. One percent of the forest area in the Lui sub- Malaysia receives a heavy rainfall of between 2000 and
basin has been transformed into rubber plantations and 5% 3000 mm per year. The basin receives rainfall throughout
was transformed into urban area. In the Kajang sub-basin, the year; the mean annual rainfall of about 2470 mm and
4% of the forest area has been transformed into rubber the highest amount of rainfall typically occur between
plantations and 3.5% was transformed into urban area. March and November. The temperature is high and uniform
 The hydrological characteristics of Sungai Langat are throughout the year, with a mean annual temperature of
greatly influenced by two heavy rainy seasons during the 27 ℃. Sungai Langat Basin receives a high amount of
South-West (May - September) and North-East (November precipitation which can cause extreme streamflow in the
- March) monsoons. The climate of the basin is most area. All streamflow data were provided by the Department
affected by the South-West Monsoon that blows across of Drainage and Irrigation (DID), Malaysia.
the Straits of Malacca. Meanwhile, convectional rainfall

 TABLE 1. Flow gauging stations in Sungai Langat Basin

 No. Site Station Catchment area Latitude Longitude Mean Sample Period of data
 number (km2) elevation size
 (m) (years)
 1. Sungai Lui 3118445 68.1 03°10′25″N 101°52′20″E 76.8 52 1965-2016

 2. Sungai Kajang 2917401 389.4 02°59′40″N 101°47′10″E 22.9 39 1978-2016

 TABLE 2. Change in land use pattern between 1984 and 2006 in the study sub-basins (Memarian & Balasundram 2016)

 Difference (2006-1984) in hectares
 Land use Lui Kajang

 Agriculture 436.39 1545.32

 Bare land 6.3 370.60

 Forest 359.75 112.04

 Grassland 5.0 -471.70

 Marshland/swamp 46.42 148.93

 Mining 16.67 395.27

 Oil palm 3.44 21.81

 Rubber -809.43 -7817.72

 Urban/ Built-up areas 111.09 5649.90

 Water body 0.00 45.55
632

 TABLE 3. Percentage of land use change matrix for important transitions between 1984 and 2006
 for Lui and Kajang sub-basins (Memarian & Balasundram 2016)

 1984 2006
 Lui
 Forest Rubber Agriculture Urban/ industrial area
 Forest 1 1 1

 Rubber 21 5

 Scrub/idle
 47 11 33 4
 grassland
 Kajang
 Forest 4 3.5

 Rubber 11 34

 Agriculture 17 26
 Scrub/ idle
 38 17 10 31
 grassland

 FIGURE 1. Map of the Sungai Langat basin located in Selangor, Malaysia
633

 MANN-KENDALL TEST proposed a trend free pre-whitening (TFPW) of the time
The trend for monthly streamflow was determined using series before conducting the trend test. The main steps to
a non-parametric approach, the Mann-Kendall trend test in TFPW are as follows:
(Kendall 1957; Mann 1945). The null hypothesis, Ho, for Step 1 The lag-1 auto-correlation coefficient is estimated
the Mann-Kendall trend test is no monotonic trend in the and removed from the detrended series by using (7).
series. While, the alternative hypothesis, H1, is there is an
increasing or decreasing trend in streamflow over time at Yi = Xi-bt (7)
a given α significance level (Gavrilov et al. 2016; Önöz
& Bayazit 2003). The following formula is used in the where Yi is the pre-whitening time series data being
Mann-Kendall trend test. examined; and Xi is the original time series data.
 =
 − ( ) Step 2 Estimate median slope, b, using the Sen approach,
 √ ( )
 − ( ) Equation (13), and remove the slope of the trend from the
 = (1)
 √ ( ) original series.
 Step 3 The estimated slope is superimposed onto the last
 series, and is referred to as the blended series.
 = ∑ −1
 =1 ∑ = +1 ( − ) (2)
 = ∑ −1
 =1 ∑ = +1 (
 − ) VARIANCE CORRECTION APPROACH
where n is the number of data points; xj and xi are the
data value in the time series; i and j are the total data set; Hamed and Rao (1998) proposed using the variance
and sgn(xj - xi ) is the sign function which is calculated correction of the Mann-Kendall test statistic to reduce
as follows: the effect of serial independence. The variance has to be
 +1, ( − ) > 0 modified by using the following equation:
 ( − ) = { 0, ( − ) = 0
 −1, ( − ) < 0 (3) ( )∗ = ( ).
 (8)
 ∗

 where Var (S)* is the modified variance; Var (S) is the
The variance is calculated using the following formula: variance of Mann-Kendall before modification, n is
 sample size, and n* is effective sample size.
 ( ) = 0 ( ) = 0 (4)
 ∗= −1 (9) (9)
 1+2 ∑ =1 (1− ).

 ∗= (9)
 where r is the significant ∑ −1
 lag-k
 1+2 serial
 (1− ). correlation
 ( ) = [ ( − 1)(2 + 5) − ∑=
 (
 [ ( − 1)(2 + 5) ]/18
 ∑ (5) ( k
 ]/18
 =1
 ( ) =1 − 1)(2 + 5) − − 1)(2 + 5)
 =1
 coefficient

 given by the following equations:
 1 1 1
where tk is the total bonding point k. The standard statistical ∑ − [ −( ∑ )][ + −( ∑ )]
 − =1 =1 =1
 2 (10
test z is calculated as follows: 1 1 −
 ∑∑ =1[
 11
 −( ∑∑
 [ −( )][ 1
 =1 )] + −( ∑ =1 )]
 − =1 =1
 2
 (10)(10
 1
 [ −( ∑ )] 1
 ∑ =1 =1
 −1
 , > 0
 √ ( )
 = 0, = 0 (6)
 −1
 −1
 , < 0 > 0
 √ ( )∗
 {√ ( ) = 0 = 0 (11)
 +1
 The standard statistical Mann-Kendall z is a standard √ ( )∗
 < 0
 {
normal distribution with a mean μ = 0 and a standard
deviation σ = 1. A positive z value indicates an increasing
trend in the streamflow time series data while a negative SEN’S SLOPE ESTIMATOR
value indicates a decreasing trend. H0 is rejected if the Sen’s slope estimator was developed by Sen (1968) and
value of |z| is higher than the significance value of zα/2 is a non-parametric procedure for estimating the slope of
and thus it can be concluded that there is a significant a trend. The linear model for can be expressed as
trend. A significance value, α, of 0.05 is selected in this
study, which give a critical value of 1.96 in the standard f (t) = Qt + β (12)
normal table (Rahman et al. 2017).
 where Q is slope; β is a constant; and t is time. To derive
 TREND FREE PRE-WHITENING METHOD the estimate of Q, the slope of all data pairs is calculated
 using (13).
To reduce the effect of serial correlation, Yue et al. (2002)
634
− Compare each group with the 1:1 straight-line and
=
−
, = 1,2, … , (13) make the following decisions: If the sub-group or data
points are close or fall within ±5% of the 1:1 line or at the
where xj and xk are the data values at times j and k, ( j > k), maximum ±10 % error then there is no trend in the time
respectively. If there are n values xj in the time series then series. If the sub-group or data points are fall over the 1:1
the Sen slope estimator is the median of n(n-1)/2 pairwise line, then there is an increasing trend in the group. If the
slopes; hence the Sen slope estimator is calculated using sub-group or data points are fall below the 1:1 line, then
(14): there is a decreasing trend in the group.
+1 ,
2 (14)
= { /2+ ( +2)/2 R ESULTS AND D ISCUSSION
2
,
STATISTICAL CHARACTERISTICS OF STREAMFLOW
INNOVATIVE TREND METHOD This section discusses the results of analysis for the two
gauging stations in Sungai Langat basin. Lui station
The innovative trend analysis methodology principles
represents the upper stream and has a mean elevation of
were proposed by Sen (2014, 2012) for identifying the
76.8 m from the datum, while Kajang station represents
partial trend components in ‘low’, ‘medium’ and ‘high’
the lower stream and has a mean elevation of 22.9 m
data values. The graph that demonstrate the possible partial
from the datum. The plot of monthly average streamflow
trends (Oztopal & Sen 2017) is obtained as follows. Divide
is presented in Figure 2. The figure shows that the lowest
the main time series into two equal parts. For example,
average monthly streamflow occurred in February, July,
the time series has 100 observations, then the first half
and August while the high streamflow occurred in April,
sub-series is the first 50 observations and the second
October, November, and December, with the highest
half sub-series consists of the next 50 observations. Sort
streamflow recorded in November. This is because the
each sub-series into ascending order. The first half of
climate in Peninsular Malaysia is influenced by two
sub-series is plotted on the x-axis, while the second half
monsoon seasons and two inter-monsoon periods. A
of the sub-series is plotted on the y-axis of the Cartesian
previous study has shown that long-term changes in
coordinate system. Draw a 45° or 1:1 straight line on the
annual streamflow were influenced by the variation in
same Cartesian coordinate system; this line theoretically
precipitation (Zhang et al. 2008). A study by Mayowa
indicates that there is no trend in a given series. Identify
et al. (2015) and Palizdan et al. (2015) has shown that
the sub-group in the scatter diagram, which are the ‘low’,
high intensity rainfalls occur during the March-April and
‘medium’ and ‘high’ value groups.
October-November inter-monsoon period.
FIGURE 2. Monthly mean streamflow at the Lui and Kajang gauging stations635 FIGURE 3. The streamflow time series for Sungai Lui (1965-2016) and Sungai Kajang (1978-2016) Figure 3 shows the streamflow time series for 4 presents the description of monthly streamflow for both Sungai Lui for the period from 1965 to 2016. The graph stations. Sungai Lui has a mean streamflow of 1.699 m3/s shows that the streamflow fluctuates slightly with the and standard deviation of 1.423 m3/s. The small difference highest streamflow reading of 12.64 m3/s recorded in between the values of the standard deviation and the mean 1971. The plot for Sungai Kajang is for the period from implies that the spread of data is small. In contrast, Sungai 1978 to 2016. The graph shows a marked fluctuation Kajang has a large standard deviation of 7.879 m3/s in in streamflow with the highest monthly streamflow of comparison to the mean value of 5.308 m3/s; this indicates 65.39 m3/s recorded in 2006, followed by the second that the data are more spread out and the occurrence of highest monthly streamflow of 58.81 m3/s in 1982. Table more extreme streamflow. TABLE 4. Description of Lui and Kajang streamflow data Standard No. Station Minimum Maximum 1st Quartile Median 3rd Quartile Mean deviation 1 Lui 0.190 12.640 1.228 1.699 2.553 2.070 1.423 2 Kajang 0.940 65.390 5.308 7.680 12.060 9.960 7.879 AUTOCORRELATION FUNCTION function (ACF) plot for the monthly time scale streamflow Before processing the data for trend test analysis, it is series for Lui and Kajang stations located in the Sungai of crucial importance to establish the presence of a serial Langat basin, with varies sample sizes which is Sungai correlation. Since the Mann-Kendall test is designed for Lui has 52 years of record and Sungai Kajang 39 years serial independent series, it is very critical to test for of record. The autocorrelation is significant at the 5% level autocorrelation to prevent Type I error from occurring for the Sungai Lui and Sungai Kajang. Based on Figure during the analysis. Figure 4 shows the autocorrelation 5, it can be concluded that, statistically, some series are
636

autocorrelated at 5% level of significance at certain lags. The any streamflow autocorrelation. Since there is a significant
blue dotted lines are the boundary for 95% confidence serial correlations in the monthly streamflow time series,
interval. For example, the autocorrelations for Lui and the effect of the serial correlations has to be eliminated
Kajang stations are significant at 5% at lags 1, 2 and 3. by using the trend free pre-whitening technique proposed
Figure 5 shows the ACF plot from January to December for by Yue et al. (2002) and the variance correction approach
Lui station. The monthly streamflow exhibited a significant proposed by Hamed and Rao (1998). The Mann-Kendall
autocorrelation at 5% at lag 1 for May and December, but without autocorrelation was also tested for all months for
the autocorrelation for other months are not significant. the Lui and Kajang stations. The purpose of the tests is to
Figure 6 shows the ACF plot for Kajang station from compare the differences in the final results. The result of
January to December. The autocorrelation is significant ACF for each month is presented in Table 5 for Lui station
at lags 1 to 3 for most of the months, with the exception and Table 6 for Kajang station.
of August, September, and December which did not show

 FIGURE 4. Autocorrelation function (ACF) plot of the monthly streamflow series of Lui (1965-2016)
 and Kajang (1978-2016) stations in Sungai Langat basin with the 95% confidence interval indicated
 with the dotted lines
637

FIGURE 5. Autocorrelation function (ACF) plot from January to December for Lui station
638

 FIGURE 6. Autocorrelation function (ACF) plot from January to December for Kajang station

 MANN-KENDALL TREND TEST annual series streamflow while the variance correction
A comparative study between the Mann-Kendall trend approaches did not show any significant trend for any
test, trend free pre-whitening and variance correction month or annual streamflow series. The results for the
approach shows that the trends are influenced by the streamflow at Kajang station presented in Table 4 shows
selected gauging station, annual or monthly data series, that there is an increasing trend for the annual streamflow.
sample size and consideration of autocorrelation structure. The result for the variance correction approach shows that
This is shown in Tables 3 and 4. The result of Mann-Kendall the trend is significantly increasing at 5% level for the
trend test which did not take autocorrelation into account months of January, April, August, October, November,
after taking into account serial independence (trend free December and the annually series streamflow. The results
pre-whitening and variance correction approach) for the for the Mann-Kendall and trend free pre-whitening
monthly streamflow time series are presented in Tables method show that two other months, March and May,
3 and 4. The Mann-Kendall trend test was conducted to showed a significant increasing trend. The consideration
check the null hypothesis that there no trend (no change of only 1-lag autocorrelation (trend free pre-whitening) is
in the mean of the time series), whereas the alternative not sufficient to remove all significant serial correlation
hypothesis is to test the existence of trend, whether the in the data series compared to complete autocorrelation
trend is decrease or increase in the mean of the time series. (variance correction) which gives a different result for
Table 3 shows the result for Mann-Kendall test (p-value = the significance of a trend. Performing the Mann-Kendall
0.041) for Lui station, where the annually streamflow series trend test without considering autocorrelation resulted in
shows statistically significant increasing trend at 5% level. an overestimation of a significantly decreasing/ increasing
The result for trend free pre-whitening method show the trend, and it should be avoided.
significant increasing trend in the months of January and
639

 TABLE 5. Result for pre-whitening, trend free pre-whitening and variance correction and Sen’s slope at 95% confidence level
 (α = 0.05) for the monthly streamflow at Lui station

 Mann-Kendall Trend free pre-whitening Variance correction Sen’s slope
 Month
 Z-value P-value Z-value P-value Z-value P-value Magnitude
 Jan 0.171 0.077 2.493 0.013* 1.355 0.175 0.0180
 Feb 0.084 0.385 1.640 0.101 1.917 0.053 0.0072
 Mar 0.064 0.515 1.405 0.160 0.579 0.562 0.0075
 Apr 0.097 0.318 1.472 0.141 1.252 0.210 0.0125
 May 0.061 0.532 1.120 0.262 0.508 0.612 0.0057
 Jun 0.002 0.994 0.552 0.581 0.011 0.991 0
 Jul 0.064 0.511 1.305 0.192 0.598 0.549 0.0043
 Aug 0.113 0.245 1.573 0.116 1.162 0.245 0.0083
 Sept 0.018 0.859 0.552 0.581 0.179 0.858 0.0018

 Oct 0.037 0.709 0.552 0.581 0.374 0.709 0.0031

 Nov 0.069 0.475 0.869 0.384 0.715 0.475 0.0091

 Dec 0.011 0.916 0.452 0.651 0.136 0.892 0.0021

 Annual 0.055 0.041* 3.201 0.002* 0.863 0.388 0.0005

*Represents the trend is significant at 0.05 level

 TABLE 6. Result for the pre-whitenning, trend free pre-whitening and variance correction and Sen’s slope at 95% confidence
 level (α = 0.05) for monthly streamflow at Kajang station

 Mann-Kendall Trend free pre-whitening Variance correction Sen’s slope
 Month
 Z-value P-value Z-value P-value Z-value P-value Magnitude
 Jan 0.32 0.004* 3.168 0.002* 2.855 0.004* 0.178
 Feb 0.208 0.064 1.96 0.050 1.960 0.050 0.110
 Mar 0.269 0.017* 2.238 0.025* 1.739 0.821 0.129
 Apr 0.355 0.002* 3.445 0.001* 3.169 0.002* 0.240
 May 0.274 0.014* 3.017 0.003* 1.968 0.050 0.184

 Jun 0.170 0.121 1.911 0.056 1.199 0.231 0.077
 Jul 0.123 0.276 1.735 0.083 1.089 0.276 0.063

 Aug 0.338 0.003* 2.917 0.004* 3.013 0.003* 0.158

 Sept 0.061 0.595 0.050 0.095 0.532 0.595 0.026

 Oct 0.351 0.002* 2.716 0.007* 3.133 0.002* 0.208

 Nov 0.185 0.099 1.735 0.083 2.416 0.016* 0.230

 Dec 0.282 0.012* 2.187 0.028* 2.516 0.012* 0.180
 Annual 0.259
640

 SEN’S SLOPE ANALYSIS highest streamflow is also for the month of November. The
The Sen’s slopes for the monthly streamflow at the months of June, July and September exhibited a small
Lui and Kajang stations are shown in Figure 7. On a increasing of trend magnitude with values of 0.077, 0.063
monthly scale, both stations shown in increasing trend and 0.026 m3/s, respectively. Ebrahimian et al. (2018)
for all months. For Lui station, the trend magnitude for carried out a similar study of the Sen’s slope in the Sungai
each month varies from 0.009 to 0.018 m3/s; this trend Langat Basin by using a different time period and found
magnitude is very small compared to that for Kajang that the streamflow magnitude for the period between
station. Kajang station shows the highest increase in 1980 and 2010 is slightly higher compared to that in the
trend magnitude (0.23 m3/s) for November. This result current study.
is equivalent to findings presented in Figure 2 where the

 FIGURE 7. Trend magnitude for the monthly streamflow time series at Lui
 and Kajang stations

 INNOVATIVE TREND ANALYSIS METHOD streamflow (< 4 m3/s) did not show a significant trend since
The innovative trend method (ITM) was applied to the the data points fall on the 1:1 line. The medium streamflow
monthly streamflows of Sungai Lui and Sungai Kajang. (between 4 and 8 m3/s) shows a slightly increasing trend,
This non-parametric method was proposed by Sen (2012) while the high streamflow (> 8 m3/s) show a slightly
to detect the existence of trend in the time series. The decreasing trend. Generally, the trend for Lui station
result for ITM is presented in Figure 8, which shows the ranges from weak to no trend since most of the points are
trend graphs of the monthly streamflow at Lui and Kajang concentrated close to the 1:1 line. For Kajang station, the
stations. The monthly streamflow data are divided into low, medium and high groups show increasing trend since
three groups: low, medium and high. In Lui station, the low most of the data deviated significantly from the 1:1 line.
641

 FIGURE 8. Innovative trend analysis of the data for Lui station (left) and
 Kajang station (right)

 Sungai Langat is one of the longest rivers in than that, the agricultural development also can contribute
Selangor, where the river runs from the north-east to to streamflow changes (Levy et al. 2018).Since Malaysia’s
south-west, which is from Sungai Lui Village to Dengkil. climate is being hot and humid throughout the year, also
Sungai Langat has been experienced frequent flood and being exposed by monsoon seasons, it can contribute to
flash flood due to insufficient channel capacity. The heavy streamflow changes. The Kajang sub-basin area has been
downpour and obstructed water flow at Sungai Langat transformed into an urban area and also converted into
are the major cause of flooding. The biggest flood was agricultural development. Whereas the Lui sub-basin has
recorded in September 1982, with the flooded area of less percentage of land used changes. Loss of forests can
about 3.0 km2 and to a depth of 4.33 m, and the damage at lead to increased water run-off (Greenpeace Research
the flooded area was quite severe (Mohammed et al. 2011). Laboratories 2013). The deforestation can decrease
Sungai Langat Basin also experienced rapid development the evapotranspiration process, which could increase
in agriculture, urbanization, and industrialization. The localized run-off and raise river levels. These impacts could
changes of undeveloped to developed area may contribute contribute towards flooding, especially in the wet season.
the changes of discharge and direct runoff volume into
Sungai Langat (Juahir et al. 2010).
 C ONCLUSION
 The trend analyses in this study are used to evaluate
the relationship between the trend of streamflow and land This study used the historical streamflow data from two
used at different sub-basin. Five different methods were gauging stations in the Sungai Langat Basin to analyse
used to access the significance of trends which are Mann- the streamflow trend at both stations. The data were taken
Kendall trend test, TFPW, Variance correction, Sen’s slope, from the daily streamflow record and was converted into
and Innovative trend analysis. The Kajang station show monthly data.
increasing streamflow compares to Lui station. Study The two flow stations involved in this study are
done by Juahir et al. (2010) also found that no significant Sungai Lui and Sungai Kajang; the records from these
trend is observed for Lui station. According to Booij et stations span a period of more than 30 years. The result for
al. (2019), land used activities such as deforestation and the modified Mann-Kendall trend test after considering
wetter climate can increase the annual streamflow. Other serial independence effect shows that the mean for the
642

monthly time series data for Sungai Lui has a significantly Chen, Y., Guan, Y., Shao, G. & Zhang, D. 2016. Investigating
increasing trend only for January when using trend free trends in streamflow and precipitation in Huangfuchuan
pre-whitening (TFPW) method, while the result for the basin with wavelet analysis and the Mann-Kendall test.
variance correction method show that there is no significant Water 8(3): 77.
 Cristina, L., Dias, P., Macedo, M.N., Heil, M., Coe, M.T. &
trend of each months. The streamflow magnitude for
 Neill, C. 2015. Regional studies effects of land cover change
Sungai Lui established using the Sen’s slope estimator on evapotranspiration and streamflow of small catchments
is very small and ranged between 0.009 and 0.018 m3/s. in the Upper Xingu River basin, Central Brazil. Journal of
The result for the variance correction method showed that Hydrology: Regional Studies 4(Part B): 108-122.
Sungai Kajang has a significantly increasing trend for da Silva, R.M., Santos, C.A.G., Moreira, M., Corte-Real, J.,
January, April, August, October, November, and December Silva, V.C.L. & Medeiros, I.C. 2015. Rainfall and river
while according the Sen’s slope estimator the month of flow trends using Mann-Kendall and Sen’s slope estimator
November showed the highest increasing trend magnitude statistical tests in the Cobres River basin. Natural Hazards
of 0.23 m3/s. The results for innovative trend method (ITM) 77(2): 1205-1221.
 Diop, L., Yaseen, Z.M., Bodian, A. & Djaman, K. 2017. Trend
for Sungai Kajang showed an increasing trend for the
 analysis of streamflow with different time scales: A case
low, medium and high value groups, while the trend for study of the upper Senegal River. ISH Journal of Hydraulic
Sungai Lui ranged from weak to no trend. Engineering 5010: 1-10.
 The results for the Mann-Kendall and innovative Ebrahimian, M., Nuruddin, A.A., Amin, M., Soom, M.,
trend methods are similar for both Sungai Lui and Sood, A.M. & Neng, L.J. 2018. Trend analysis of major
Sungai Kajang. The significantly increasing trend in hydroclimatic variables in the Langat River basin, Malaysia.
the streamflow of Sungai Kajang was closely related to Singapore Journal of Tropical Geography 39(2): 192-214.
elevation, variation in landscape metrics, and the change Gavrilov, M.B., Tošić, I., Marković, S.B., Unkašević, M.
in land use. The streamflow trend for Sungai Lui is & Petrović, P. 2016. Analysis of annual and seasonal
 temperature trends using the Mann-Kendall test in Vojvodina,
essentially insignificant, thus indicating that there is not
 Serbia. Quarterly Journal of the Hungarian Meteorological
enough evidence to indicate a significant change in the Service 120(2): 183-198.
hydrological series. Greenpeace Research Laboratories. 2013. An Impending
 Storm Impacts of Deforestation on Weather Patterns and
 ACKNOWLEDGEMENTS Agriculture. Amsterdam: Greenpeace International.
 Hajani, E., Rahman, A. & Ishak, E. 2017. Trends in extreme
The authors would like to thank the Earth Observation rainfall in the State of New Trends in extreme rainfall in the
Centre, Universiti Kebangsaan Malaysia and the State of New South Wales, Australia. Hydrological Sciences
Department of Irrigation and Drainage (DID), Ministry Journal 62(13): 2160-2174.
of Natural Resources and Environment, Malaysia for Hamed, K.H. & Ramachandra, R. 1998. A modified Mann-
providing the data for this research. The authors wish to Kendall trend test for autocorrelated data. Journal of
express their gratitude to the Government grant GUP- Hydrology 204(1-4): 182-196.
2020-013 for funding this research. Hamzah, F.M., Yusoff, S.H.M. & Jaafar, O. 2019. L-moment-
 based frequency analysis of high-flow at Sungai Langat,
 Kajang, Selangor, Malaysia. Sains Malaysiana 48(7): 1357-
 REFERENCES 1366.
Amirabadizadeh, M., Huang, Y.F. & Lee, T.S. 2015. Recent Hamzah, F.M., Saimi, F.M. & Jaafar, O. 2017. Identifying the
 trends in temperature and precipitation in the Langat River monotonic trend in climate change parameter in Kluang and
 Basin, Malaysia. Advances in Meteorology 2015: 579437. Senai. Sains Malaysiana 46(10): 1735-1741.
Ay, M. & Kisi, O. 2015. Investigation of trend analysis of Jan, N.A.M., Shabri, A., Hounkpe, J. & Badyalina, B. 2018.
 monthly total precipitation by an innovative method. Modelling non-stationary extreme streamflow in Peninsular
 Theoretical and Applied Climatology 120(3-4): 617-629. Malaysia. International Journal of Water 12(2): 116-140.
Azam, M., Maeng, S.J., Kim, H.S., Lee, S.W. & Lee, J.E. 2018. Juahir, H., Zain, S.M., Aris, A.Z., Yusof, M.K., Armi, M., Samah,
 Spatial and temporal trend analysis of precipitation and A. & Mokhtar, M. 2010. Hydrological trend analysis due to
 drought in South Korea. Water 10(6): 765. land use changes at Langat River basin. Environment Asia
Bayazit, M. & Önöz, B. 2009. To prewhiten or not to 3(Special Issue): 20-31.
 prewhiten in trend analysis? Hyrological Sciences 52(4): Kendall, M.G. 1957. Rank Correlation Methods. 4th ed. London:
 611-624. Charles Griffin.
Booij, M.J., Schipper, T.C. & Marhaento, H. 2019. Attributing Kisi, O., Santos, C.A.G., Silva, R.M. & Zounemat-Kermani, M.
 changes in streamflow to land use and climate change for 2018. Trend analysis of monthly streamflows using Şen’s
 472 catchments in Australia and the United States. Water innovative trend method. Geofizika 35: 53-68.
 11(5): 1059. Levy, M.C., Lopes, A.V., Cohn, A., Larsen, L.G. & Thompson,
Chattopadhyay, S. & Edwards, D.R. 2016. Long-term trend S.E. 2018. Land use change increases streamflow across the
 analysis of precipitation and air temperature for Kentucky, arc of deforestation in Brazil. Geophysical Research Letters
 United States. Climate 4(1): 10. 45(8): 3520-3530.
643

Mayowa, O.O., Pour, S.H. & Shahid, S. 2015. Trends in rainfall M. 2017. Application of Mann-Kendall in analyzing
 and rainfall-related extremes in the east coast of peninsular water quality data trend at Perlis, Malaysia. International
 Malaysia. Journal of Earth System Science 124(8): 1609- Journal on Advanced Science, Engineering and Information
 1622. Technologi 7(1): 78.
Memarian, H. & Balasundram, S.K. 2016. Hydrological Sen, P.K. 1968. Estimates of the regression coefficient based
 trend analysis integrated with landscape analysis at the on Kendall’s Tau. Journal of the American Statistical
 watershed scale (case study: Langat basin, Malaysia). Association 63(324): 1379-1389.
 In Landscape Ecology - The Influences of Land Use and Sen, Z. 2014. Trend identification simulation and application.
 Anthropogenic Impacts of Landscape Creation. London: Journal of Hydrologic Engineering 19(3): 635-642.
 IntechOpen. pp. 61-84. Sen, Z. 2012. Innovative trend analysis methodology. Journal
Mohammed, T.A., Al-Hassoun, S. & Ghazali, A.H. 2011. of Hydrologic Engineering 17(9): 1042-1046.
 Prediction of flood levels along a stretch of the Langat River Sulaiman, N.H., Kamarudin, M K.A., Mustafa, A.D., Amran,
 with insufficient hydrological data. Pertanika Journal of M.A., Azaman, F., Abidin, I.Z. & Hairoma, N. 2015.
 Science and Technology 19(2): 237-248. Analisis corak sungai Pahang menggunakan kaedah bukan
Mustapha, A. 2013. Detecting surface water quality trends parametrik: Ujian corak Mann Kendall. Malaysian Journal
 using Mann-Kendall tests and Sen’s slope estimates. of Analytical Sciences 19(6): 1327-1334.
 International Journal of Advanced and Innovative Research Terzioglu, Z.O., Kankal, M., Yuksek, O., Nemli, M.O. & Akcay,
 2: 108-114. F. 2019. Analysis of the precipitation intensity values of
Önöz, B. & Bayazit, M. 2003. The power of statistical tests various durations in Trabzon Province of Turkey by Sen’s
 for trend detection. Turkish Journal of Engineering and innovative trend method. Sigma Journal of Engineering
 Environmental Sciences 27(4): 247-251. and Natural Sciences 37(1): 241-250.
Oztopal, A. & Sen, Z. 2017. Innovative trend methodology Thenmozhi, M. & Kottiswaran, A.V. 2016. Analysis of rainfall
 applications to precipitation records in Turkey. Water trend using Mann-Kendall test and the Sen’s Slope
 Resources Management 31(3): 727-737. estimator in Udumalpet of Tirupur district in Tamil Nadu.
Palizdan, N., Falamarzi, Y., Huang, Y.F., Lee, T.S. & Ghazali, International Journal of Agricultural 6(2): 131-138.
 A.H. 2015. Temporal precipitation trend analysis at the Wang, C., Shang, S., Han, Y., Sauvage, S., Sanchez-Perez, J.M.,
 Langat River basin, Selangor, Malaysia. Journal of Earth Kuramochi, K. & Hatano, R. 2018. Integrated Effects of land
 System Science 124(8): 1623-1638. use and topography on streamflow response to precipitation
Palizdan, N., Falamarzi, Y., Huang, Y.F., Lee, T.S. & Ghazali, in an agriculture-forest dominated northern watershed.
 A.H. 2014. Regional precipitation trend analysis at the Water 10(633): 633.
 Langat River. Theoretical and Applied Climatology 117(3- Yang, H.W., Jaafar, O., El.-Shafie, A. & Sharifah Mastura, S.A.
 4): 589-606. 2011. Analysis of hydrological processes of Langat River
Piyoosh, A.K. & Ghosh, S.K. 2017. Effect of autocorrelation on sub basins at Lui and Dengkil. International Journal of the
 temporal trends in rainfall in a valley region at the foothills Physical Sciences 6(32): 7390-7409.
 of Indian Himalayas. Stochastic Environmental Research Yue, S., Pilon, P., Phinney, B. & Cavadias, G. 2002. The
 and Risk Assessment 31(8): 2075-2096. influence of autocorrelation on the ability to detect trend in
Rahman, M.A., Yunsheng, L. & Sultana, N. 2017. Analysis hydrological series. Hydrological Processes 16(9): 1807-
 and prediction of rainfall trends over Bangladesh using 1829.
 Mann-Kendall, Spearman’s rho tests and ARIMA model. Yue, S. & Wang, C.Y. 2002. Applicability of prewhitening to
 Meteorology and Atmospheric Physics 129(4): 409-424. eliminate the influence of serial correlation on the Mann-
Rao, A.R., Azli, M. & Pae, L.J. 2011. Identification of trends Kendall test. Water Resources Research 38(6): 41-47.
 in Malaysian monthly runoff under the scaling hypothesis. Zhang, S., Lu, X.X., Higgitt, D.L., Chen, C.T.A., Han, J. & Sun,
 Hydrological Sciences Journal 56(6): 917-929. H. 2008. Recent changes of water discharge and sediment
Rim, C. 2017. Implications of geographical factors and trends load in the Zhujiang (Pearl River) basin, China. Global and
 of climatic factors on aridity/humidity trends. Journal of Planetary Change 60(3-4): 365-380.
 Scientific Research & Reports 17(6): 1-11. Zhao, J., Huang, Q., Chang, J., Liu, D., Huang, S. & Shi, X. 2015.
Sa, Z., Ismail, T., Sung, E., Xiao, C. & Wang, J. 2017. Trends Analysis of temporal and spatial trends of hydro-climatic
 analysis of rainfall and rainfall extremes in Sarawak, variables in the Wei River basin. Environmental Research
 Malaysia using modified Mann-Kendall test. Meteorology 139: 55-64.
 and Atmospheric Physics 131(3): 263-277.
Sagarika, S., Kalra, A. & Ahmad, S. 2014. Evaluating the effect Siti Hawa Mohd Yusoff, Firdaus Mohamad Hamzah*, Othman
 of persistence on long-term trends and analyzing step changes Jaafar & Hazrina Tajudin
 in streamflows of the continental United States. Journal of Department of Civil and Structural Engineering
 Hydrology 517: 36-53. Faculty of Engineering and Built Environment
Salman, S.A., Shahid, S., Ismail, T., Chung, E. & Al-abadi, A.M. Universiti Kebangsaan Malaysia
 2017. Long-term trends in daily temperature extremes in Iraq. 43600 UKM Bangi, Selangor Darul Ehsan
 Atmospheric Research 198: 97-107. Malaysia
Samsudin, M.S., Khalit, S.I., Juahir, H., Fahmi, M. & Nasir,
644

Siti Hawa Mohd Yusoff *Corresponding author; email: fir@ukm.edu.my
Department of Science and Biotechnology
Faculty of Engineering and Life Sciences Received: 27 May 2020
Universiti Selangor Accepted: 8 August 2020
45600 Bestari Jaya, Selangor Darul Ehsan
Malaysia
You can also read