FIND ME ON UT DALLAS GOOGLE SCHOLAR YOUTUBE RESEARCHGATE LINKEDIN - HIGH ZAGROS MOUNTAINS
←
→
Page content transcription
If your browser does not render page correctly, please read the page content below
Experimental Tectonics
I am interested in the role of detachment horizons in the style of fold-thrust belt deformation. The example you see
here is an analog model of the Zagros fold-thrust belt with two detachment horizons. Left figure: the red horizon is
Precambrian Hormuz Salt, and the Yellow horizon is the Oligo-Miocene Gachsaran Formation. Notice deformation styles
below and above the Gachsaran and manifestation of topography above the tip of the Hormuz Salt.
Geometry of foreland basins

The geometry and sedimentary
record of the foreland basins are
exciting topics because they offer
a complete dynamic history of
continental-continental collision
zones and a promising host for
major hydrocarbon reservoirs.
The map you see here is the
bottom of the foreland basin
deposits (or top of the Asmari
Formation) which is assembled
using hundreds of seismic lines,
structural sections, and borehole
data. The Northeastern part is
exposed to the surface and
partially eroded, the rest with a
negative value of counter lines
shows the depth in meters.
                                     Learn more here
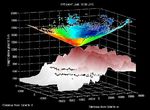
Zagros Three-dimensional flexural modeling is a tool that can be used to learn about the elastic thickness and mechanical behavior of a plate. If the elastic thickness is a large number, the basin is wider compared with a basin with a lower elastic thickness value. The upper panel is a depth map of the entire Zagros foreland across Iran, Iraq, and Syria. The lower panel is a result of a flexural model. The average RMSE is 250 meters for the model. Considering the maximum depth of the basin is 6 km, the average error is less than 5%. Learn more here
Alaska

  One more example for Alaska;
  the base of the foreland basin
  is shown in the upper panel
  and the result of the three-
  dimensional flexural modeling
  in the lower panel. The RMSE
  is less than 2%.

  MS student thesis;
  Learn more here
Other studied areas

    I also worked on other basins
    from different countries for
    projects related to basin
    evolution and 3D reservoir
    modeling before 2013.
Regional exhumation – Eurasia-Arabia collision Exhumation history of a continental crust and plateaus in a collisional setting adjacent to foreland basins reveals the other side of the coin and goes hand to hand with basin dynamics to sheds light on tectonics and paleoclimate conditions. The figures on the left show the cooling history of the metamorphic belt of the Zagros in four different stations and the figure on the right shows the evolution of the Iranian plateau which evolved mostly during subduction rather than continental-continental collision. If you want to use the data and graphs, please contact me beforehand.
Collaboration with Mechanical Engineering Department
Wind Tunnel & Atmospheric dynamics
I am interested to see how the mountain belts, in another word, topography, interact with the atmosphere and affect the
climate and wind energy production. The image to the left shows the configuration of a lesser record which contains the
density of particles in air and velocity. The figure to the right is the plan view from the record showing the effect of a wind
turbine in reducing the speed of air. Approaching flow to the lesser machine is shown with hot colors (positive values) and
departing flow with cold colors (negative values). The colors show the wind speed on the m/s scale.
1. Machine Learning in Geosciences
   2. Simple and Complex Systems
 I am developing my skills in machine learning techniques to analyze
 any earth science database. I also came to cross with the topic of
 complex systems. I found it fascinating; it opens doors for out-of-
 box thinking. Most of the Earth’s systems are complex, but we treat
 them as simple systems. However, looking at data from a complex
 systems perspective offers new interpretations that sometimes
 reject results from a simple model. In complex systems, outliers
 have a more significant weight because they are the system’s
 signature, while in a simple system, they are ignored. Complex
 systems are co-evolving multilayer networks. They change with time
 and are path-dependent. Here are some characteristics of complex
 systems:
 •   Emergence and power laws
 •   Self-organized criticality
 •   Collapse and boom phases
 •   Phase transitions
 •   Edge of chaos
 •   Path-dependent processes
You can also read


