ET2050 The SASI Model - Klaus Spiekermann and Michael Wegener ET2050 Project Group Meeting, Barcelona, 19-21 October 2011
←
→
Page content transcription
If your browser does not render page correctly, please read the page content below
ET2050
               The SASI Model

        Klaus Spiekermann and Michael Wegener

ET2050 Project Group Meeting, Barcelona, 19-21 October 2011
The SASI Model 2
The SASI model

    There are three methods to model the impacts of
    policies on regional economic development:
    • Multiplier effects of infrastructure invest-
      ments (Aschauer, 1993)
    • Regional production functions incorporating
      infrastructure as production factor
                                                      ASI
      (Jochimsen, 1966; Biehl, 1986, 1991)          S

    • Interregional trade flows as a function of
      interregional transport costs (Peschel, 1981;
      Bröcker, 1995) and input-output linkages
      (Echenique, 1990) and economies of scale
      (Krugman, Venables,1995)

3
The SASI model
The SASI model is a recursive-dynamic simulation
model of socio-economic development of regions in
Europe under assumptions about
• European economic development and external
net migration
• European/national regional subsidies (EFRE,
CAP) and infrastructure policies (TEN-T)
The SASI model differs from other regional economic
models by modelling not only production (the
demand side of regional labour markets) but also
population (the supply side of labour markets).
4Regional production function
In state-of-the-art models of regional development
based on production functions the classic production
factors land, labour and capital are replaced by
location factors, such as:
• Economic structure
• Productivity
• Accessibility
• Labour supply
• Services
• Settlement structure
• Research and development
• Education
• Quality of life
5Regional production function
Extended production function:
Land Accessibility
α β γ δ
Production Qi = Li Ri K i Ai ... Others
Labour Capital
where Ai is potential accessibility:
Destinations Travel cost between
in region j regions i and j
Ai = ∑ W j exp ( − β c ij )
Accessibility
of region i
j
6SASI
model Transport
policy
Production Migration
Accessibility
function function
GDP Income Population
Employment Unemploy- Labour
ment force
7Regions
SASI
model
8TEN-T priority projects
TEN and TINA
projects
Multimodal
     accessibility
     1981
     1986
     1996
     1991
     2001
     2006
     2011
     2016
     2021
     2026
     2031

11
The AlpenCors Project:
a Regional Application
12The AlpenCorS project (2004-2005)
The Interreg III B programme "Alpine Space"
(2000-2006) aimed at developing a concept for
economic and spatial development in the pan-
European Corridor V between France, Italy,
Slovenia and Austria.
The project AlpenCorS ("Alpen Corridor South")
focused on the central segment of the corridors
south of the Alps. The SASI model was to assess
the effects of the intersection with Corridor I,
the Brenner Corridor.
13GDP per capita (EU27+2 = 100)
Scenario 000
2021
Reference Scenario
Strasbourg •
Wien •
München •
• Zürich
• Bolzano
• Trento • Ljubljana
• Lyon
• Milano • Venezia
• Torino
14Accessibility road/rail/air travel
Scenario 000
AS1 v. 000
2021
Reference
Brenner tunnel
Scenario
effect
Strasbourg ••
Strasbourg
Wien ••
Wien
München ••
München
•• Zürich
Zürich
•• Bolzano
Bolzano
•• Trento
Trento •• Ljubljana
Ljubljana
• Lyon
•• Milano
Milano •• Venezia
Venezia
•• Torino
Torino
15GDP per capita
Accessibility (EU27+2
road freight= 100)
Scenario AS1 v. 000
2021
Brenner tunnel effect
Strasbourg •
Wien •
München •
• Zürich
• Bolzano
• Trento • Ljubljana
• Lyon
• Milano • Venezia
• Torino
16The STEPs Project:
a European Application
17The STEPs project (2004-2006)
The EU 6th RTD Framework project STEPs
(Scenarios for the Transport System and Energy
Supply and their Potential Effects) developed and
assessed possible scenarios for the EU transport
system and energy supply of the future.
In the project five urban/regional models were
applied to forecast the long-term economic, social
and environmental impacts of different scenarios of
fuel price increases and different combinations of
infrastructure, technology and demand
regulation policies.
18STEPs Scenarios
The scenarios combined three rates of energy price
increases with three sets of policies:
2030 2030 2030
Fuel
1.60 €* price3.33
increase
€* 6.80 €*
+1% p.a. +4% p.a. +7% p.a.
Do-nothing A-1 B-1 C-1
Business as usual A0 B0 C0
Infrastructure & technology A1 B1 C1
2030 2030 2030
Demand regulation A23.35 €* B26.95 €* C2 23.25 €*
All policies A3 B3 C3
* € of 2008 per litre A-1 Reference Scenario
19European policy scenarios
A1-C1 Infrastructure and technology
- Petrol/Diesel per km (down to -4 % p.a.)
- Alternative vehicles/fuels (up to 33 %)
- European rail speed (up to +2 % p.a.)
- Regional rail speed (up to +1.7 % p.a.)
- Rail freight speed (up to +2 % p.a.)
A2-C2 Demand regulation
- Fuel tax (up to +5 % p.a.)
- Kerosene tax (up to 200 % of petrol tax)
- Road pricing (up to +10 % p.a.)
- Public transport fares (down to -1.7 % p.a.)
- Car/lorry cost per km (up to +3 % p.a.)
- Rail freight cost (down to -1.5 % p.a.)
A3-C3 All policies
20Accessibility road/rail/air (million) 21
Scenario A-1
A-1
Accessibility
road/rail/air travel
(million)
in year 2031
180 - 200
160 - 180
140 - 160
120 - 140
100 - 120
80 - 100
60- 80
40 - 60
20 - 40
0 - 20
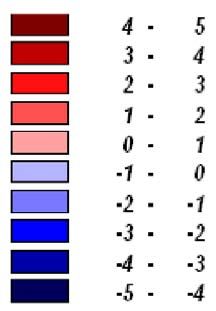
22Scenario A1
Accessibility
road/rail/air travel
Difference from
ScenarioA-1
2031 (%)
40 - 50
30 - 40
20 - 30
10 - 20
0- 10
-10 - 0
-20 - -10
-30 - -20
-40 - -30
-50 - -40
23Scenario B1
Accessibility
road/rail/air travel
Difference from
ScenarioA-1
2031 (%)
40 - 50
30 - 40
20 - 30
10 - 20
0- 10
-10 - 0
-20 - -10
-30 - -20
-40 - -30
-50 - -40
24Scenario C1
Accessibility
road/rail/air travel
Difference from
ScenarioA-1
2031 (%)
40 - 50
30 - 40
20 - 30
10 - 20
0- 10
-10 - 0
-20 - -10
-30 - -20
-40 - -30
-50 - -40
25Scenario A-1
GDP per capita
2031 (€ of 2005)
54 - 60
48 - 54
42 - 48
36 - 42
30 - 36
24 - 30
18- 24
12 - 18
6- 12
0- 6
26Scenario A1
GDP per capita
Difference from
Scenario A-1
2031 (%)
8- 10
6- 8
4- 6
2- 4
0- 2
-2 - 0
-4 - -2
-6 - -4
-8 - -6
-10 - -8
27Scenario B1
GDP per capita
Difference from
Scenario A-1
2031 (%)
8- 10
6- 8
4- 6
2- 4
0- 2
-2 - 0
-4 - -2
-6 - -4
-8 - -6
-10 - -8
28Scenario C1
GDP per capita
Difference from
Scenario A-1
2031 (%)
8- 10
6- 8
4- 6
2- 4
0- 2
-2 - 0
-4 - -2
-6 - -4
-8 - -6
-10 - -8
29The SASI Model in ET2050 30
Ongoing model developments

     • Extension of forecasting horizon from 2030 to
       2050
     • Conversion of the region system to the 2006
       NUTS-3 classification
     • Higher spatial resolution in Croatia and other
       Western Balkan countries
     • Simple model of long-distance passenger and
       freight transport
     • Calculation of environmental indicators as
       energy consumption and CO2 emissions of
       transport

31
Questions answered
How will European and national
• subsidies (EFRE, CAP)
• infrastructure investments (TEN-T)
• rising energy costs
affect
• regional economic development,
• regional population/migration,
• interregional travel and goods flows,
• energy consumption/CO2 emissions,
• territorial cohesion and polycentricity?
32Baseline Scenario
The Baseline Scenario for 2030 and 2050 will be
based on BAU assumptions about
• European economic development and EU net
migration,
• European/national regional subsidies and
infrastructure policies
and will produce forecasts of:
• regional economic development,
• regional population/migration,
• interregional travel and goods flows,
• energy consumption/CO2 emissions,
• territorial cohesion and polycentricity
33Scenario "Europe of Cities"
The exploratory scenario "Europe of Cities" will
differ from the baseline scenario by assumptions
about European/national regional subsidies and
infrastructure policies that support the concen-
tration of economic activities and population in the
largest metropolitan areas and will forecast:
• European economic development,
• regional economic development,
• regional population/migration,
• interregional travel and goods flows,
• energy consumption/CO2 emissions,
• territorial cohesion and polycentricity
34Scenario "Europe of Regions"
The exploratory scenario "Europe of Regions" will
differ from the baseline scenario by assumptions
about European/national regional subsidies and
infrastructure policies that support the concen-
tration of economic activities and population in the
small towns and rural regions and will forecast:
• European economic development,
• regional economic development,
• regional population/migration,
• interregional travel and goods flows,
• energy consumption/CO2 emissions,
• territorial cohesion and polycentricity
35Scenario "Europe of Flows"
The exploratory scenario "Europe of Flows" will
differ from the baseline scenario by assumptions
about European/national regional subsidies and
infrastructure policies that support the concen-
tration of economic activities and population in the
major transport corridors and will forecast:
• European economic development,
• regional economic development,
• regional population/migration,
• interregional travel and goods flows,
• energy consumption/CO2 emissions,
• territorial cohesion and polycentricity
36Results (1)
• Population indicators: Population by age, sex,
nationality, labour force participation, education,
net migration and net commuting by NUTS-3 region
per year
• Economic indicators: GDP by industry, by worker,
by capita, employment by industry and
unemploy-ment by NUTS-3 region per year
• Accessibility indicators: Accessibility by mode
(travel/goods) by NUTS-3 region per year
37Results (2)
• Transport indicators: Travel and goods flows
between NUTS-3 regions by mode per year.
• Environmental indictors: Energy consumption
and CO2 emissions of transport between NUTS-3
region per year.
• Cohesion indicators: Cohesion and polycentricity
indicators of accessibility and GDP per capita of
NUTS-3 regions per year
38Typical graphical output
• Time-series diagrams
- by country or macro region
- by scenario
• Maps
- indicators by NUTS-3 region by year
- indicator differences between scenarios by
NUTS-3 region per year
• 3D surfaces
- indicators by NUTS-3 region per year
- differences between scenarios by NUTS-3
region per year
39More information
Wegener, M., Bökemann, D. (1998): SASI Model: Model
Structure. Berichte aus dem Institut für Raumplanung 40.
Dortmund: Institute of Spatial Planning, University of
Dortmund. http://www.raumplanung.uni-dortmund.de/irpud/
fileadmin/irpud/content/documents/publications/ber40.pdf.
Wegener, M. (2008): SASI Model Description. Working
Paper 08/01. Dortmund: Spiekermann & Wegener Stadt-
und Regionalforschung. http://www.spiekermann-wegener.
de/mod/pdf/AP_0801.pdf.
Fiorello, D., Huismans, G., López, E., Marques, C., Steen-
berghen, T., Wegener, M., Zografos, G. (2006): Transport
Strategies under the Scarcity of Energy Supply. Final
Report of the EU project STEPs – Scenarios for the Transport
and Energy Supply and their Potential Effects, edited by A.
Monzon and A. Nuijten. Den Haag: Buck Consultants
International. http://www.steps-eu.com/reports.htm.
40You can also read