COVID-19 NSW Outbreak - 12 July 2021 - Burnet Institute
←
→
Page content transcription
If your browser does not render page correctly, please read the page content below
COVID-19 NSW Outbreak
                  12 July 2021

                                                                     For further information please contact:
           Dr Nick Scott, Head, Modelling Working Group, Burnet Institute. email: nick.scott@burnet.edu.au
       Professor Margaret Hellard, Deputy Director, Burnet Institute. email: margaret.hellard@burnet.edu.au
  Dr Romesh Abeysuriya, Senior Research Officer, Burnet Institute. email: romesh.abeysuriya@burnet.edu.au
Objectives of Analysis
To estimate whether the ‘Stage 3’ and ‘Stage 4’ restriction levels used in the Victorian
second wave would be sufficient to control the current Delta outbreak in NSW

•   We used our calibrated COVASIM Model to simulate a similarly sized Delta outbreak occurring in Victoria
    •     For each sampled simulation, an infection was seeded and density limits were introduced following the first diagnosis
    •     We only retained simulations that were within 20 per cent of a 7-day average of 30 diagnoses per day, 21 days after the
          first case was detected (simulations that ‘fizzled out’ - i.e. outbreaks did not occur or were contained by testing,
          contact tracing - were excluded, as were simulations with outbreaks that grew too rapidly)

•   Three scenarios were compared:
    1.    Density limits only: no further escalation of restrictions (i.e. what if a lockdown was not introduced)
    2.    Stage 3: restrictions equivalent to the Victorian Stage 3 + masks (22 Jul 2020) are introduced
    3.    Stage 4: restrictions equivalent to the Victorian Stage 4 (5 Aug 2020) are introduced

                                                                                           For additional model details see: Scott N et al. MJA 2020, 214(2):79-83.
                                                                                 Abeysuriya RG et al. medRxiv 2020, https://doi.org/10.1101/2020.12.21.20248595.
Other Key Model Inputs
  •      The Delta variant was approximated to be twice as infectious than Victorian second wave variant (wild type)
  •      Disease characteristics were assumed equal to wild type strains (e.g. distributions for incubation period,
         pre-symptomatic period)
  •      Vaccination was assumed to provide an overall:
          •       80 per cent protection against infection*
          •       87 per cent protection against hospitalisation*
          •       92 per cent protection against death*

  •      Simulations were performed using the existing Victorian calibration of the COVASIM Model^:
          •       The model has been calibrated to data from the Victorian second wave and the Victorian population profile.
          •       It includes upgraded contact tracing (contacts-of-contacts) and age-based vaccine coverage based on national
                  second dose coverage as of 1 July 2021.
          •       This was used in preference to attempting a NSW calibration, because parameters for the impact of the
                  Stage 3 + masks and Stage 4 policy packages are known, whereas the impact of NSW restrictions
                  are currently unknown.

  *UK Government Coronavirus Information: https://assets.publishing.service.gov.uk/government/uploads/system/uploads/attachment_data/file/993510/S1287_SPI-M-O_Summary_Roadmap_step_4.pdf.
                                                                             ^Scott N et al. MJA 2020, 214(2):79-83. ^Abeysuriya RG et al. medRxiv 2020, https://doi.org/10.1101/2020.12.21.20248595.
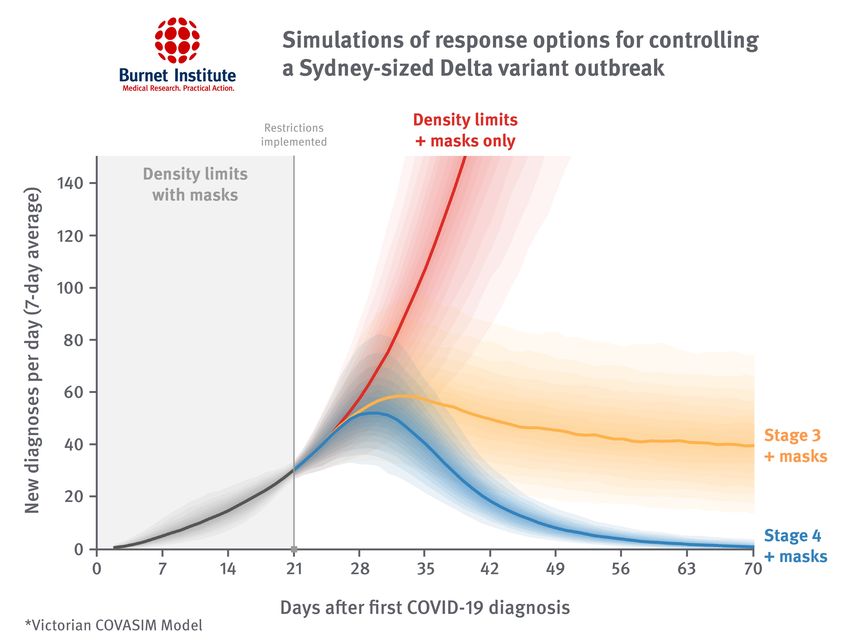
Results: The stage 3 ‘lockdown’ averted disaster, but still more is needed

Victorian COVASIM Model
simulation of the impact
of restrictions applied to a
theoretical Delta outbreak
in Victoria, that has
reached a 7-day average
of 30 diagnoses per day.

These case numbers are
similar to the current NSW
Delta outbreak numbers.

Community Control Policies in NSW and VIC
Community Control Policies in NSW and VIC

Original NSW restrictions
were not as stringent as
VIC Stage 3 + masks

NSW’s updated
restrictions are approx.
VIC Stage 3 + Masks

There is room to do more.
No-Lockdown Counterfactual
•   We also modelled a counterfactual scenario to examine the potential consequences of not using
    lockdowns to contain the outbreak
•   The model was initialized with 50 initial infections in the community, and we assumed no additional
    cases would be introduced (e.g., due to hotel quarantine breaches)
•   We modelled a static policy configuration with three combinations of restrictions shown below

        Policy                    Voluntary masks   Work from home                Density limits
        Outdoor gatherings        Unrestricted      Unrestricted
No-Lockdown Counterfactual: Vaccination
• We optimistically estimated vaccine efficacy based on the Pfizer vaccine
Vaccine impact Infection Symptoms Hospitalisation ICU Death
Overall protection 80% 85% 87% 89% 92%
• We modelled an ongoing vaccination at 300,000 doses/week, prioritised by age, starting with
10 per cent initial coverage to approximate the current level of vaccine coverage
• The peak vaccine coverage was:
• 95 per cent for age 65+
• 70 per cent for the general population, including childrenResults: Giving up on the lockdown would be catastrophic
• Even if density restrictions are maintained for an entire year, without additional restrictions the model
projects around 12x as many deaths as influenza deaths in 2017 – one of the worst years on record
• Consistent with other settings around the world, if the aggressive suppression strategy is ended now,
a subsequent long lockdown would almost certainly be unavoidable
• If restrictions are only reintroduced once ICU capacity is reached, a harder lockdown would be necessary
to bring cases down, because contact tracing will be more difficultConclusions
• With only density limits and masks cases of Delta would continue to grow exponentially.
• NSW’s original stay-at-home orders (introduced 26 June 2021), combined with contact tracing, are likely to have averted a
significant number of infections, hospitalisations and deaths. However it is difficult to currently measure the impact if any
of these restrictions.
• However these restrictions were not effective enough to control the outbreak.
• NSW’s updated restrictions (introduced 9 July 2021) are approximately equivalent to Victoria’s Stage 3 + masks restrictions.
• Stage 3 + masks restrictions were found to prevent daily case numbers from increasing further, but are unlikely to be
sufficient to eliminate community transmission in an acceptable amount of time.
• Victoria’s Stage 4 restrictions are likely to contain a Delta variant outbreak:
• It would take around 6 weeks for Stage 4 restrictions to return diagnoses to a 7-day average ofLimitations
• We modelled an outbreak of comparable size in Victoria as to what is currently occurring in NSW to assess the possible growth
rate of the outbreak under specific policy settings previously used by Victoria. While there are many similarities between
Australian states, they are not identical, and the model findings should be interpreted accordingly in assessing implications
for NSW.
• We did not model the incremental introduction of restrictions in NSW, and therefore the scenarios we use to estimate the
growth rate of the outbreak should not be interpreted as forecasts for the future outbreak trajectory in NSW. In particular,
the required duration of restrictions is sensitive to this approximation.
• There is emerging evidence that disease prognoses with Delta variant infections may be worse than the original variant, and
therefore hospitalisations and deaths may be higher than we have estimated.
• Vaccine assumptions were based on data from the Pfizer vaccine against the Delta variant. Given the use of AstraZeneca,
hospitalisations and deaths may be higher than we have estimated.
• This model currently only attributes basic properties to individuals, specifically age, household structure and participation in
different contact networks. The model does not account for any other demographic and health characteristics such as
socioeconomic status, comorbidities (e.g. non-communicable diseases) and risk factors (e.g. smoking) and so cannot account
for differences in transmission risks, testing, quarantine adherence or disease outcomes for different population subgroups.
• The model does not include a geospatial component and so cannot capture geographic clustering of infections
or interventions.Contributors: • Romesh Abeysuriya • Stelliana Goutzamanis • Margaret Hellard • Nick Scott
Appendix
Model assumptions for contact tracing following a case detection
The model uses daily time steps and the testing/contact
                                                                                                    Assumed          Assumed         Assumed
tracing system was approximated as follows:                                                          contact       effectiveness   effectiveness
                                                                           Network
•   Day 0: Test is taken by index case (who quarantines).                                            tracing       of quarantine    of isolation
                                                                                                   probability      on network      on network
•   Day 1 (24 hours following test): Positive test results
    returned, index case is notified and isolates. Household               Household                  1.00             0.00            0.80
    contacts immediately notified.                                         Aged care                  0.95             0.80            0.80
                                                                           Schools                    0.95             0.95            0.99
•   Day 2 (48 hours following test being taken): Contact tracing           Low risk work              0.95             0.95            0.99
    completed, with the probability of detecting contacts                  High risk work             0.95             0.95            0.99
    depending on setting (e.g., workplaces vs public transport             Church                     0.95             0.95            0.99
    contacts). Identified contacts are tested and enter                    Community sport            0.95             1.00            1.00
    quarantine for 14 days regardless of test results, along with          Childcare                  0.95             0.95            1.00
    their entire households. Contacts are additionally tested on           Community                  0.40             0.95            0.99
    day 11 of quarantine.                                                  Social                     0.95             0.80            0.95
                                                                           Entertainment              0.95             1.00            1.00
•   Day 3 (72 hours following test): Test results for primary              Cafes/Restaurants          0.80             1.00            1.00
    contacts become available. Any primary contacts who return             Pub/bar                    0.80             1.00            1.00
    a positive initial test have their contacts traced within the          Transport                  0.40             0.95            0.99
    next 24 hours.                                                         Public parks               0.40             1.00            1.00

                         *See Scott et al. Med J Aust 2021;214(2):79-83 for definitions of contacts in the model
You can also read