Comparison of synthesized and acquired high b-value diffusion-weighted MRI for detection of prostate cancer
←
→
Page content transcription
If your browser does not render page correctly, please read the page content below
medRxiv preprint doi: https://doi.org/10.1101/2023.02.17.23286100; this version posted February 18, 2023. The copyright holder for this preprint
 (which was not certified by peer review) is the author/funder, who has granted medRxiv a license to display the preprint in perpetuity.
 All rights reserved. No reuse allowed without permission.

 Comparison of synthesized and acquired high b-value diffusion-
 weighted MRI for detection of prostate cancer
 Karoline Kallis (PhD) 2, Christopher C. Conlin (PhD) 1, Allison Y. Zhong 2, Troy S. Hussain2, Aritrick
 Chatterjee (PhD)6, 7, Gregory S. Karczmar (PhD)6, 7, Rebecca Rakow-Penner (MD, PhD) 1, Anders Dale
 (PhD) 1, 3, 4, Tyler Seibert (MD, PhD)1, 2, 5

 1
 Department of Radiology, UC San Diego Health, La Jolla, CA, USA
 2
 Department of Radiation Medicine and Applied Sciences, UC San Diego Health, La Jolla, CA, USA
 3
 Department of Neurosciences, UC San Diego Health, La Jolla, CA, USA
 4
 Halıcıoğlu Data Science Institute, UC San Diego, La Jolla, CA, USA
 5
 Department of Bioengineering, UC San Diego Jacobs School of Engineering, La Jolla, CA, USA
 6
 Department of Radiology, University of Chicago, Chicago, IL, USA
 7
 Sanford J. Grossmann Center of Excellence in Prostate Imaging and Image Guided Therapy, University
 of Chicago, Chicago, IL, USA

 Grant Support
 This work was supported, in part, by the National Institutes of Health (NIH/NIBIB K08EB026503,
 NIH UL1TR000100), the American Society for Radiation Oncology, and the Prostate Cancer
 Foundation.
 Disclosures
 AMD is a Founder of and holds equity in CorTechs Labs, Inc, and serves on its Scientific
 Advisory Board. He is a member of the Scientific Advisory Board of Human Longevity,
 Inc. and receives funding through research agreements with General Electric Healthcare.
 RRP is a consultant for Human Longevity, Inc. She also receives funding through
 research grants from GE Healthcare and Imagine Scientific to UC San Diego; she has an
 equity interest in CorTechs Labs, Inc. and serves on its Scientific Advisory Board. She
 also has equity interest in CureMetrix. TMS reports honoraria from Multimodal Imaging
 Services Corporation, Varian Medical Systems, and WebMD; he has an equity interest in
 CorTechs Labs, Inc. and serves on its Scientific Advisory Board. These companies might
 potentially benefit from the research results. The terms of the above arrangements have
 been reviewed and approved by the University of California San Diego in accordance with
 its conflict-of-interest policies. Drs. Chatterjee and Karczmar report equity in QMIS LLC,
 outside the submitted work.

 *Corresponding Author
 Tyler Seibert, PhD
 Assistant Professor
 Department of Radiation Medicine & Applied Sciences
 UC San Diego Health
 3855 Health Sciences Drive
 La Jolla, CA 92093-0843
 (858) 246-0500

 tseibert@health.ucsd.edu

 NOTE: This preprint reports new research that has not been certified by peer review and should not be used to guide clinical practice.
medRxiv preprint doi: https://doi.org/10.1101/2023.02.17.23286100; this version posted February 18, 2023. The copyright holder for this preprint
 (which was not certified by peer review) is the author/funder, who has granted medRxiv a license to display the preprint in perpetuity.
 All rights reserved. No reuse allowed without permission.

 Background:
 High b-value diffusion-weighted images (DWI) are used for detection of clinically significant
 prostate cancer (csPCa). To decrease scan time and improve signal-to-noise ratio, high b-value
 (>1000 s/mm2) images are often synthesized instead of acquired.
 Purpose:
 Qualitatively and quantitatively compare synthesized DWI (sDWI) to acquired (aDWI) for detection
 of csPCa.
 Study Type:
 Retrospective
 Subjects:
 151 consecutive patients who underwent prostate MRI and biopsy.
 Sequence:
 Axial DWI with b=0, 500, 1000, and 2000 s/mm2 using a 3T clinical scanner using a 32-channel
 phased-array body coil
 Assessment:
 We synthesized DWI for b=2000 s/mm2 via extrapolation based on monoexponential decay, using
 b=0 and b=500 s/mm2 (sDWI500) and b=0, b=500, and b=1000 s/mm2 (sDWI1000). Differences
 between sDWI and aDWI were evaluated within regions of interest (ROIs). The maximum DWI
 value within each ROI was evaluated for prediction of csPCa. Classification accuracy was also
 compared to Restriction Spectrum Imaging restriction score (RSIrs), a previously validated
 biomarker based on multi-exponential DWI.
 Statistical Tests:
 Discrimination of csPCa was evaluated via area under the receiver operating characteristic curve
 (AUC). Statistical significance was assessed using bootstrap difference (two-sided α=0.05).
 Results:
 Within the prostate, mean ± standard deviation of percent mean differences between sDWI and
 aDWI signal were -46±35% for sDWI1000 and -67±24% for sDWI500. AUC for aDWI, sDWI500,
 sDWI1000, and RSIrs within the prostate 0.62[95% confidence interval: 0.53, 0.71], 0.63[0.54,
 0.72], 0.65[0.56, 0.73] and 0.78[0.71, 0.86], respectively. When considering the whole field of
 view, classification accuracy and qualitative image quality decreased notably for sDWI compared
 to aDWI and RSIrs.
 Data Conclusion:
 sDWI is qualitatively comparable to aDWI within the prostate. However, hyperintense artifacts are
 introduced with sDWI in the surrounding pelvic tissue that interfere with quantitative cancer
 detection and might mask metastases. In the prostate, RSIrs yields superior quantitative csPCa
 detection than sDWI or aDWI.

 Keywords:
 Diffusion-weighted imaging, prostate cancer, synthetic high b-values, Restricted Spectrum
 Imaging
medRxiv preprint doi: https://doi.org/10.1101/2023.02.17.23286100; this version posted February 18, 2023. The copyright holder for this preprint
 (which was not certified by peer review) is the author/funder, who has granted medRxiv a license to display the preprint in perpetuity.
 All rights reserved. No reuse allowed without permission.

 Abbreviation
 DWI diffusion-weighted imaging
 csPCa clinically significant prostate cancer
 FOV field of view
 RSIrs restriction spectrum imaging restriction score
 CNR contrast-to-noise ratio
 sDWI synthesized diffusion-weighted image
 aDWI aquired diffusion-weighted image
 ROI region of interest
 ROC receiver operating characteristic
 AUC area under the curve
 FPR90 false positive rate at 90% sensitivity
 SNR signal to noise ratio

 Introduction

 Diffusion-weighted imaging (DWI) is a critical component of multiparametric MRI for the

 detection and characterization of clinically significant prostate cancer (csPCa)1. The degree of

 diffusion-weighting in DWI is indicated by the b-value, with higher b-values corresponding to

 images with less signal where water in tissues diffuses more rapidly2. High b-values are used for

 their greater tumor conspicuity and detection of even small lesions3. The Prostate Imaging –

 Reporting and Data System (PI-RADS v2.1) recommends the acquisition of high b-values (1400-

 2000 s/mm2) for lesion detection, without precisely defining an optimal value for csPCa4. While

 clinically valuable, high b-values require more scan time and suffer from low signal-to-noise ratio

 (SNR) and increased susceptibility to artifacts due to microscopic motion or small fluctuations in

 local magnetic field. One common solution, permitted by PI-RADS, is to synthesize high b-value

 images by extrapolating signal from acquired low b-value images using a mono-exponential

 model1,5. However, mono-exponential models do not adequately represent restricted diffusion in

 complex tissues6,7, possibly calling into question the accuracy of synthesized images.

 More advanced DWI models have been developed to better account for tissue

 microstructure, including intravoxel incoherent motion imaging8,9, diffusion kurtosis imaging10,11,

 Vascular, Extracellular, and Restricted Diffusion for Cytometry in Tumor (VERDICT)12–14, hybrid
medRxiv preprint doi: https://doi.org/10.1101/2023.02.17.23286100; this version posted February 18, 2023. The copyright holder for this preprint
 (which was not certified by peer review) is the author/funder, who has granted medRxiv a license to display the preprint in perpetuity.
 All rights reserved. No reuse allowed without permission.

 multidimensional MRI (HM-MRI)15–18, and Restriction Spectrum imaging (RSI)12,19. In RSI, the

 diffusion signal is modeled as a weighted sum of different compartments representing different

 tissue types19,20. The RSI restriction score (RSIrs) is based on the model coefficient for the most

 restricted diffusion compartment and has been shown to be a useful biomarker for the detection

 of csPCa20–22.

 Studies have yielded contradicting results on whether synthesized b-values are clinically

 interchangeable with acquired DWI (aDWI) images. Liu et al.23 compared various models,

 including the standard mono-exponential, for the detection of csPCa and concluded that non-

 linear fitting with various b-values is superior to simpler models. In contrast, other studies reported

 better image quality for synthetic DWI (sDWI) with a similar tumor detection rate in comparison to

 acquired DWI5,24–27.

 In this study, we qualitatively and quantitatively analyzed the differences between acquired

 and synthesized high b-value images for detection of csPCa. Further, we compared the detection

 rate of csPCa between DWI and RSIrs.

 Materials and Methods
 Patient Cohort
 This retrospective study was approved by the institutional review board (IRB 805394). 151

 men were included in the study who underwent MRI examination between November 2017 and

 December 2020. These were consecutive patients scanned with the same protocol and for whom

 results of a prostate biopsy (performed within 180 days of the MRI) were available. Patient

 characteristics are summarized in Table 2.

 For all patients, suspicious lesions were contoured per PI-RADS v2.1 by board-certified

 radiologists using MIM software (MIM Software, Inc; Cleveland, OH). Whole-gland prostate

 segmentation was performed using OnQ Prostate software (Cortechs Labs, San Diego, CA,

 USA). Clinically significant prostate cancer (csPCa) was defined as grade group ≥ 2. On biopsy,
medRxiv preprint doi: https://doi.org/10.1101/2023.02.17.23286100; this version posted February 18, 2023. The copyright holder for this preprint
 (which was not certified by peer review) is the author/funder, who has granted medRxiv a license to display the preprint in perpetuity.
 All rights reserved. No reuse allowed without permission.

 86 of the 151 patients were found to have csPCa, while 65 had only benign tissue or grade group

 1 cancer. In patients who underwent prostatectomy, grade group was determined per final

 pathology report.

 MRI Acquisition
 All MRI acquisitions were performed on a 3T clinical GE scanner (Discovery MR750, GE

 Healthcare, Waukesha, WI, USA) using a 32-channel phased-array body coil surrounding the

 pelvis. Acquisition parameters are summarized in Table 1. A single axial DWI volume was

 acquired for each patient. T2-weighted reference images were acquired for all patients with field

 of view (FOV) identical to the DWI volume. RSI calculations were performed as described in prior

 studies 20–22.

 Post-processing of the image data was performed using in-house software in MATLAB

 (version R2017a, MathWorks, Natick, MA, USA). DWI images were corrected for B0

 inhomogeneity distortions, gradient nonlinearity, and eddy currents 28–30. Multiple acquired DWI

 samples at specific b-values were averaged together and normalized by median signal intensity

 of urine in the bladder at b = 0 s/mm2.

 Synthetic b-value Computation
 Synthetic high b-value DWI (sDWI) was calculated using the conventional, mono-

 exponential formula (see below) and using b-values up to 500 s/mm2 (sDWI500) or b-values up to

 1000 s/mm2 (sDWI1000).

 ( ) = 0 −

 S(b) is DWI signal for a given b-value, b. S0 is the signal with no diffusion weighting. ADC is the

 apparent diffusion coefficient. sDWI was calculated for b=2000 s/mm2 to match the acquired high

 b-value DWI (aDWI). To explore the application of sDWI and aDWI for detection of significant
medRxiv preprint doi: https://doi.org/10.1101/2023.02.17.23286100; this version posted February 18, 2023. The copyright holder for this preprint
 (which was not certified by peer review) is the author/funder, who has granted medRxiv a license to display the preprint in perpetuity.
 All rights reserved. No reuse allowed without permission.

 cancer lesions outside of the prostate, sDWI and RSIrs were additionally calculated for one

 representative patient with csPCa and bone metastasis.

 Data Analysis
 All data analysis was performed using in-house MATLAB scripts (version R2021a,

 MathWorks, Natick, MA, USA). Quantitative differences between sDWI and aDWI were estimated

 by a voxel-wise comparison of the images. Relative deviations were calculated for three different

 regions of interest (ROIs): prostate, prostate plus a margin of 5 mm, and the whole field of view

 (FOV) using the following formula:

 1 −
 ∆ = �

 =0

 where Ss is the synthetic signal intensity, Sa the acquired signal and N the number of voxels in the

 considered images. Mean and standard deviation of ΔS over all patients are reported. A negative

 value indicates that the acquired signal intensity is higher than the synthesized signal intensity.

 Further, violin plots were generated for the 50th, 95th, and 98th percentile of signal intensity within

 several ROIs: prostate; prostate plus margin (5 mm, 30 mm, or 70 mm); and the whole FOV. For

 the whole FOV, values higher than 3000 signal intensity units (SIU) were capped and set to 3000

 SIU. Violin plots present the median value in combination with the kernel density distribution 31.

 Lesion conspicuity was evaluated using the contrast-to-noise ratio (CNR) between lesion

 and surrounding prostate tissue. CNR is defined as the following:

 ( − )
 =
 � 2 + 2

 where μ is the mean signal of the ROI under consideration and σ the standard deviation. CNR

 was evaluated for all patients and patients diagnosed with csPCa. A higher CNR indicates a better
medRxiv preprint doi: https://doi.org/10.1101/2023.02.17.23286100; this version posted February 18, 2023. The copyright holder for this preprint
 (which was not certified by peer review) is the author/funder, who has granted medRxiv a license to display the preprint in perpetuity.
 All rights reserved. No reuse allowed without permission.

 tumor conspicuity32. Significant differences between CNRs of different images and patient cohorts

 were tested using two sample t-test with a confidence level of 0.01.

 Prediction of whether csPCa was found on biopsy was also evaluated for aDWI, sDWI,

 and RSIrs. RSIrs is a quantitative cancer biomarker based on a multi-exponential DWI model and

 has been previously shown to be more accurate than conventional DWI20–22. Computation of

 RSIrs for this dataset was performed previously and is described in detail in previous

 publications21,22,33 . Briefly, the coefficient for the slowest diffusion compartment (corresponding

 to intracellular restricted diffusion) was normalized by the median signal within the prostate on

 b=0 s/mm2 images. The maximum aDWI, sDWI, or RSIrs value within each considered ROI was

 used as the predictor variable, as done in previous work22. This is analogous to the maximum

 standard uptake value (SUV) in quantitative Positron Emission Tomography (PET) imaging.

 Receiver-operating characteristic (ROC) curves were calculated, and the area under the curve

 (AUC) reported for aDWI, sDWI, and RSIrs. The false positive rate at 90% sensitivity (FPR90)

 was also reported for each metric. AUC and FPR90 were compared using bootstrap (N=10,000)

 95% confidence intervals and p-values.

 Results
 Figure 1 shows the difference between acquired and synthesized b-values for a

 representative patient using the mean signal intensity within the prostate. Within the prostate,

 mean ± standard deviation of percent differences between sDWI and aDWI were -46±35% for

 sDWI1000 and -67±24% for sDWI500. A negative error indicates sDWI had lower values than aDWI.

 Comparing sDWI1000 to sDWI500, a difference of -41±4% was estimated (see Table 3). sDWI500

 had overall larger errors than sDWI1000. Signal intensity of aDWI was lower than sDWI in the

 prostate and in the prostate plus 5 mm margin, as indicated by a negative mean difference and

 lower median for the 50th, 95th and 98th percentiles. The 50th percentile of aDWI is higher than

 sDWI for all considered ROIs. For the 95th and 98th percentiles, however, sDWI is larger for
medRxiv preprint doi: https://doi.org/10.1101/2023.02.17.23286100; this version posted February 18, 2023. The copyright holder for this preprint
 (which was not certified by peer review) is the author/funder, who has granted medRxiv a license to display the preprint in perpetuity.
 All rights reserved. No reuse allowed without permission.

 margins of ≥30 mm beyond the prostate. The standard deviation of sDWI is larger than that of

 aDWI for all ROIs and all considered percentiles. Comparison of the 50th, 95th and 98th percentiles

 for five ROIs is shown in Figure 3. Mean and standard deviation of CNR over all patients was

 0.95±0.87, 0.84±0.80, 0.65±0.66 and 0.97±0.79 for aDWI, sDWI1000, sDWI500 and RSIrs,

 respectively. A lower CNR indicates a lower tumor conspicuity. CNR considering only patients

 with csPCa changed to 1.00±0.84, 0.86±0.78, 0.65±0.65 and 0.99±0.76 for aDWI, sDWI1000,

 sDWI500 and RSIrs respectively. CNR for aDWI and RSIrs proved to be significantly different to

 sDWI (p
medRxiv preprint doi: https://doi.org/10.1101/2023.02.17.23286100; this version posted February 18, 2023. The copyright holder for this preprint
 (which was not certified by peer review) is the author/funder, who has granted medRxiv a license to display the preprint in perpetuity.
 All rights reserved. No reuse allowed without permission.

 preserved. Both sDWI and aDWI had a similar quantitative performance in detecting csPCa with

 an AUC ranging between 0.56-0.65. However, sDWI introduced larger errors in the surrounding

 pelvic tissue even in a reduced FOV acquisition. Overall RSIrs outperformed sDWI and aDWI for

 quantitative prediction of biopsy-proven csPCa for all considered ROIs.

 Severe artifacts were observed on sDWI in the pelvic tissue outside of the prostate, in

 particular for sDWI500, which makes the detection of metastasis outside of the prostate region

 difficult, Figure 5. There are many ways to potentially improve the calculation of synthesized

 images including bi-exponential or multi-exponential modeling23. For example, RSIrs is based on

 a multi-exponential model and may synthesize images without introducing artifacts. Image

 artifacts may be explained by poor signal quality, magnitude smaller than one in a subset of

 voxels, or noise/distortion correction post image acquisition leading to voxels with very low signal

 intensity. In particular, mono-exponential models fail to correctly represent voxels with low signal

 intensity due to exponential fitting. Smoother images could be created by censoring those voxels

 by interpolating from surrounding voxels, smoothing low b-value images prior to calculation, or by

 thresholding low intensity voxels. For quantitative imaging, the details of such decisions would

 need to be clearly described and accounted for, and potentially could lead to more false

 positive/negative detections. Such enhanced images would not represent the measured truth and

 would include some unreliable voxels, which must be taken into consideration when interpreting

 the images. A “nicer looking” image does not necessarily mean that the image quality or reliability

 is better.

 Prior studies reported sDWI to have higher subjective quality and tumor conspicuity5,27.

 This may reflect the particular imaging sequences and, platforms used, or the particular image

 enhancement effects. It is also important to note that these prior results were mostly subjective

 judgements and not quantitative assessments of accuracy. In the presented study we have

 proven that tumor conspicuity is quantitatively greater with aDWI (CNR = 0.95) in comparison to

 sDWI (CNR = 0.65-0.84). Another option to improve sDWI is to use a multi-compartment DWI
medRxiv preprint doi: https://doi.org/10.1101/2023.02.17.23286100; this version posted February 18, 2023. The copyright holder for this preprint
 (which was not certified by peer review) is the author/funder, who has granted medRxiv a license to display the preprint in perpetuity.
 All rights reserved. No reuse allowed without permission.

 model, e.g., RSIrs, for a more stable and accurate signal extrapolation. For example, RSIrs

 outperformed both sDWI and aDWI in the present study. Other promising multi-compartment

 models have proved to be superior to conventional multiparametric MRI, like a biomarker derived

 from VERDICT that outperformed ADC in the detection of csPCa14. Hybrid multidimensional MRI

 acquisitions also showed promising results for classifying csPCa with a reported AUC of 0.9434.

 One limiting factor of our study was that we only considered a retrospective dataset form

 a single scanner and a single institution. Further, only the conventional mono-exponential model

 was tested in the presented study. A precise comparison of all possible methods for synthesizing

 DWI is beyond the scope of this manuscript. RSIrs is one quantitative biomarker based on a multi-

 compartment model. The acquisition protocol in the datasets here was not optimized for models

 like hybrid multi-dimensional MRI or VERDICT.

 Conclusion

 Within the prostate, sDWI is a systematically inaccurate representation of aDWI, but the

 techniques are quantitatively comparable in terms of detecting csPCa. In the surrounding pelvic

 tissue, high signal intensity artifacts are introduced with sDWI. These artifacts decrease the

 csPCa detection rate in surrounding tissues and might mask potential metastases within the

 pelvis. RSIrs is superior to either sDWI or aDWI for quantitative csPCa detection. Despite the

 quantitative inaccuracies, sDWI may still be adequate for current subject clinical interpretation

 within the prostate.
medRxiv preprint doi: https://doi.org/10.1101/2023.02.17.23286100; this version posted February 18, 2023. The copyright holder for this preprint
 (which was not certified by peer review) is the author/funder, who has granted medRxiv a license to display the preprint in perpetuity.
 All rights reserved. No reuse allowed without permission.

 References

 1. Turkbey B, Rosenkrantz AB, Haider MA, et al. Prostate Imaging Reporting and Data
 System Version 2.1: 2019 Update of Prostate Imaging Reporting and Data System Version
 2. Eur Urol. 2019;76(3):340-351. doi:10.1016/j.eururo.2019.02.033

 2. Tang L, Zhou XJ. Diffusion MRI of Cancer: from Low to High b-Values. J Magn Reson
 Imaging JMRI. 2019;49(1):23-40. doi:10.1002/jmri.26293

 3. Park MJ, Kim YK, Choi S youn, Rhim H, Lee WJ, Choi D. Preoperative detection of small
 pancreatic carcinoma: value of adding diffusion-weighted imaging to conventional MR
 imaging for improving confidence level. Radiology. 2014;273(2):433-443.
 doi:10.1148/radiol.14132563

 4. Weinreb JC, Barentsz JO, Choyke PL, et al. PI-RADS Prostate Imaging - Reporting and
 Data System: 2015, Version 2. Eur Urol. 2016;69(1):16-40.
 doi:10.1016/j.eururo.2015.08.052

 5. Jendoubi S, Wagner M, Montagne S, et al. MRI for prostate cancer: can computed high b-
 value DWI replace native acquisitions? Eur Radiol. 2019;29(10):5197-5204.
 doi:10.1007/s00330-019-06085-z

 6. Shinmoto H, Oshio K, Tanimoto A, et al. Biexponential apparent diffusion coefficients in
 prostate cancer. Magn Reson Imaging. 2009;27(3):355-359. doi:10.1016/j.mri.2008.07.008

 7. Karunamuni RA, Kuperman J, Seibert TM, et al. Relationship between kurtosis and bi-
 exponential characterization of high b-value diffusion-weighted imaging: application to
 prostate cancer. Acta Radiol Stockh Swed 1987. 2018;59(12):1523-1529.
 doi:10.1177/0284185118770889

 8. Riches SF, Hawtin K, Charles-Edwards EM, de Souza NM. Diffusion-weighted imaging of
 the prostate and rectal wall: comparison of biexponential and monoexponential modelled
 diffusion and associated perfusion coefficients. NMR Biomed. 2009;22(3):318-325.
 doi:10.1002/nbm.1328

 9. Le Bihan D, Breton E, Lallemand D, Aubin ML, Vignaud J, Laval-Jeantet M. Separation of
 diffusion and perfusion in intravoxel incoherent motion MR imaging. Radiology.
 1988;168(2):497-505. doi:10.1148/radiology.168.2.3393671

 10. Rosenkrantz AB, Sigmund EE, Johnson G, et al. Prostate Cancer: Feasibility and
 Preliminary Experience of a Diffusional Kurtosis Model for Detection and Assessment of
 Aggressiveness of Peripheral Zone Cancer. Radiology. 2012;264(1):126-135.
 doi:10.1148/radiol.12112290

 11. Si Y, Liu RB. Diagnostic Performance of Monoexponential DWI Versus Diffusion Kurtosis
 Imaging in Prostate Cancer: A Systematic Review and Meta-Analysis. AJR Am J
 Roentgenol. 2018;211(2):358-368. doi:10.2214/AJR.17.18934

 12. Panagiotaki E, Chan RW, Dikaios N, et al. Microstructural characterization of normal and
 malignant human prostate tissue with vascular, extracellular, and restricted diffusion for
medRxiv preprint doi: https://doi.org/10.1101/2023.02.17.23286100; this version posted February 18, 2023. The copyright holder for this preprint
 (which was not certified by peer review) is the author/funder, who has granted medRxiv a license to display the preprint in perpetuity.
 All rights reserved. No reuse allowed without permission.

 cytometry in tumours magnetic resonance imaging. Invest Radiol. 2015;50(4):218-227.
 doi:10.1097/RLI.0000000000000115

 13. Johnston EW, Bonet-Carne E, Ferizi U, et al. VERDICT MRI for Prostate Cancer:
 Intracellular Volume Fraction versus Apparent Diffusion Coefficient.
 Radiology. 2019;291(2):391-397. doi:10.1148/radiol.2019181749

 14. Singh S, Rogers H, Kanber B, et al. Avoiding Unnecessary Biopsy after Multiparametric
 Prostate MRI with VERDICT Analysis: The INNOVATE Study. Radiology. Published online
 August 2, 2022:212536. doi:10.1148/radiol.212536

 15. Chatterjee A, Watson G, Myint E, Sved P, McEntee M, Bourne R. Changes in Epithelium,
 Stroma, and Lumen Space Correlate More Strongly with Gleason Pattern and Are Stronger
 Predictors of Prostate ADC Changes than Cellularity Metrics. Radiology. 2015;277(3):751-
 762. doi:10.1148/radiol.2015142414

 16. Sadinski M, Karczmar G, Peng Y, et al. Pilot Study of the Use of Hybrid Multidimensional
 T2-Weighted Imaging-DWI for the Diagnosis of Prostate Cancer and Evaluation of Gleason
 Score. AJR Am J Roentgenol. 2016;207(3):592-598. doi:10.2214/AJR.15.15626

 17. Chatterjee A, Bourne RM, Wang S, et al. Diagnosis of Prostate Cancer with Noninvasive
 Estimation of Prostate Tissue Composition by Using Hybrid Multidimensional MR Imaging:
 A Feasibility Study. Radiology. 2018;287(3):864-873. doi:10.1148/radiol.2018171130

 18. Lee GH, Chatterjee A, Karademir I, et al. Comparing Radiologist Performance in
 Diagnosing Clinically Significant Prostate Cancer with Multiparametric versus Hybrid
 Multidimensional MRI. Radiology. Published online July 26, 2022:211895.
 doi:10.1148/radiol.211895

 19. Brunsing RL, Schenker-Ahmed NM, White NS, et al. Restriction spectrum imaging: An
 evolving imaging biomarker in prostate MRI. J Magn Reson Imaging. 2017;45(2):323-336.
 doi:10.1002/jmri.25419

 20. Conlin CC, Feng CH, Rodriguez-Soto AE, et al. Improved Characterization of Diffusion in
 Normal and Cancerous Prostate Tissue Through Optimization of Multicompartmental
 Signal Models. J Magn Reson Imaging. 2021;53(2):628-639. doi:10.1002/jmri.27393

 21. Feng CH, Conlin CC, Batra K, et al. Voxel-level Classification of Prostate Cancer on
 Magnetic Resonance Imaging: Improving Accuracy Using Four-Compartment Restriction
 Spectrum Imaging. J Magn Reson Imaging. 2021;54(3):975-984. doi:10.1002/jmri.27623

 22. Zhong AY, Digma LA, Hussain T, et al. Automated Patient-level Prostate Cancer Detection
 with Quantitative Diffusion Magnetic Resonance Imaging. Eur Urol Open Sci. 2023;47:20-
 28. doi:10.1016/j.euros.2022.11.009

 23. Liu G, Lu Y, Dai Y, et al. Comparison of mono-exponential, bi-exponential, kurtosis, and
 fractional-order calculus models of diffusion-weighted imaging in characterizing prostate
 lesions in transition zone. Abdom Radiol. 2021;46(6):2740-2750. doi:10.1007/s00261-020-
 02903-x
medRxiv preprint doi: https://doi.org/10.1101/2023.02.17.23286100; this version posted February 18, 2023. The copyright holder for this preprint
 (which was not certified by peer review) is the author/funder, who has granted medRxiv a license to display the preprint in perpetuity.
 All rights reserved. No reuse allowed without permission.

 24. Maas MC, Fütterer JJ, Scheenen TWJ. Quantitative evaluation of computed high B value
 diffusion-weighted magnetic resonance imaging of the prostate. Invest Radiol.
 2013;48(11):779-786. doi:10.1097/RLI.0b013e31829705bb

 25. Sahoo P, Rockne RC, Jung A, Gupta PK, Rathore RKS, Gupta RK. Synthetic Apparent
 Diffusion Coefficient for High b-Value Diffusion-Weighted MRI in Prostate. Prostate
 Cancer. 2020;2020:5091218. doi:10.1155/2020/5091218

 26. Blackledge MD, Leach MO, Collins DJ, Koh DM. Computed Diffusion-weighted MR
 Imaging May Improve Tumor Detection. Radiology. 2011;261(2):573-581.
 doi:10.1148/radiol.11101919

 27. Bittencourt LK, Attenberger UI, Lima D, et al. Feasibility study of computed vs measured
 high b-value (1400 s/mm2) diffusion-weighted MR images of the prostate. World J Radiol.
 2014;6(6):374-380. doi:10.4329/wjr.v6.i6.374

 28. White NS, McDonald C, McDonald CR, et al. Diffusion-weighted imaging in cancer:
 physical foundations and applications of restriction spectrum imaging. Cancer Res.
 2014;74(17):4638-4652. doi:10.1158/0008-5472.CAN-13-3534

 29. Holland D, Kuperman JM, Dale AM. Efficient correction of inhomogeneous static magnetic
 field-induced distortion in Echo Planar Imaging. NeuroImage. 2010;50(1):175-183.
 doi:10.1016/j.neuroimage.2009.11.044

 30. Zhuang J, Hrabe J, Kangarlu A, et al. Correction of eddy-current distortions in diffusion
 tensor images using the known directions and strengths of diffusion gradients. J Magn
 Reson Imaging. 2006;24(5):1188-1193. doi:10.1002/jmri.20727

 31. Hintze JL, Nelson RD. Violin Plots: A Box Plot-Density Trace Synergism. Am Stat.
 1998;52(2):181-184. doi:10.1080/00031305.1998.10480559

 32. DelPriore MR, Biswas D, Hippe DS, et al. Breast Cancer Conspicuity on Computed Versus
 Acquired High b-Value Diffusion-Weighted MRI. Acad Radiol. 2021;28(8):1108-1117.
 doi:10.1016/j.acra.2020.03.011

 33. Conlin CC, Feng CH, Rodriguez-Soto AE, et al. Improved Characterization of Diffusion in
 Normal and Cancerous Prostate Tissue Through Optimization of Multicompartmental
 Signal Models. J Magn Reson Imaging JMRI. 2021;53(2):628-639. doi:10.1002/jmri.27393

 34. Chatterjee Aritick. Validation of Prostate Tissue Composition by Using Hybrid
 Multidimensional MRI: Correlation with Histologic Findings. doi:10.1148/radiol.2021204459
medRxiv preprint doi: https://doi.org/10.1101/2023.02.17.23286100; this version posted February 18, 2023. The copyright holder for this preprint
 (which was not certified by peer review) is the author/funder, who has granted medRxiv a license to display the preprint in perpetuity.
 All rights reserved. No reuse allowed without permission.

 Table 1 Acquisition parameters for clinical multi-parametric MRI; DWI = diffusion-weighted
 imaging; T2W = T2 weighted MRI

 Series DWI T2W
 FOV [mm] 240*120 320*320
 Matrix (resampled dimensions) 96*48 (128*64) 320*320 (512*512)
 Number of Slices 16 32
 Slice thickness [mm] 6 3
 TR [ms] 4500 6080
 TE [ms] 68 102
 b-values [s/mm2] (number of samples) 0 (2), 500 (6), 1000 (6), 2000 (12) N/A
medRxiv preprint doi: https://doi.org/10.1101/2023.02.17.23286100; this version posted February 18, 2023. The copyright holder for this preprint
 (which was not certified by peer review) is the author/funder, who has granted medRxiv a license to display the preprint in perpetuity.
 All rights reserved. No reuse allowed without permission.

 Table 2 Patient Characteristics range Q1-Q3= Range between lower first quartile to upper third
 quartile; csPCa = clinically significant prostate cancer. MRI = magnet resonance imaging; PSA =
 prostate-specific antigen

 Parameter Specification Value

 Number of patients Total 151
 Age [a] Median (range Q1-Q3) 66 (59-72)
 Time from MRI to biopsy [d] Median (range Q1-Q3) 16 (1-35)
 PSA at time of MRI [ng/ml] Median (range Q1-Q3) 7.3 (5.3-10.4)
 Prostate volume [ml] Median (range Q1-Q3) 45 (34-61)
 PSA density [ng/ml2] Median (range Q1-Q3) 0.16 (0.11-0.25)
 Systematic 7
 Targeted 17
 Best available pathology
 Systematic and Targeted 85
 Prostatectomy 42
 TRUS Guided 139
 Targeted Biopsy Transperineal 9
 NaN 3
 I 0
 II 5 (3)
 PI-RADS Score (csPCa) III 27 (4)
 IV 55 (25)
 V 64 (54)
 Benign 25
 1 40
 2 38
 Gleason Grade Group
 3 20
 4 16
 5 12
 Negative Biopsy 25
 T1c 94
 Clinical Tumor stage T2a 13
 T2b 11
 T2c 8
medRxiv preprint doi: https://doi.org/10.1101/2023.02.17.23286100; this version posted February 18, 2023. The copyright holder for this preprint
 (which was not certified by peer review) is the author/funder, who has granted medRxiv a license to display the preprint in perpetuity.
 All rights reserved. No reuse allowed without permission.

 Table 3 Summary of median differences between synthesized (sDWI) and acquired (aDWI)
 diffusion-weighted imaging. Comparison between sDWI and aDWI is presented relative to aDW.
 FOV= field of view

 Median Difference ± Interquartile range
 ROI Datasets
 Total (N = 151) csPCA (N = 86) Benign (N = 65)

 sDWI1000 vs. aDWI -55±27% -52±29% -59±22%
 Prostate
 sDWI500 vs. aDWI -72±15% -69±18% -74±13%
 Prostate+5 mm sDWI1000 vs. aDWI -55±26% -53±29% -58±21%
 margin sDWI500 vs. aDWI -72±18% -69±19% -74±13%
 Prostate+30 mm sDWI1000 vs. aDWI -48±35% -46±41% -50±28%
 margin sDWI500 vs. aDWI -58±34% -54±45% -61±23%
 Prostate+70 mm sDWI1000 vs. aDWI 1.9e19±4.1e19% 1.8e19±3.8e19% 2.0e19±6.4e19%
 margin sDWI500 vs. aDWI 1.5e47±1.7e48% 1.4e47±1.2e48% 1.5e47±3.0e48%
 sDWI1000 vs. aDWI 1.1e19±2.3e19% 1.1e19±2.2e19% 1.6e19±2.5e19%
 Whole FOV
 sDWI500 vs. aDWI 3.4e48±8.9e50% 2.0e48±7.1e50% 1.3e49±9.2e50%
medRxiv preprint doi: https://doi.org/10.1101/2023.02.17.23286100; this version posted February 18, 2023. The copyright holder for this preprint
 (which was not certified by peer review) is the author/funder, who has granted medRxiv a license to display the preprint in perpetuity.
 All rights reserved. No reuse allowed without permission.

 Table 4 Classification accuracy for the detection of cancer is shown for the prostate, prostate plus
 a 5 mm margin and the whole field of view (FOV). For statistical comparison bootstrapping
 (N=10,000) was performed and the 95% confidence intervals (CI) of AUC and the mean false
 positive rate at 90% sensitivity (FPR90) reported. ROI = Region of interest; AUC = area under the
 curve; RSIrs = biomarker based on restriction spectrum imaging; aDWI = acquired diffusion
 b=2000 s/mm2 MRI; sDWI1000 = synthesized image using acquired b-values up to 1000s/mm2;
 sDWI500 = synthesized image using acquired b-values up to 500 s/mm2; * significantly different
 with p < 0.05 in comparison to each of the other metrics

 RoI Dataset AUC 95th CI FPR90
 RSIrs 0.78* 0.71-0.86 0.50*
 aDWI 0.62 0.53-0.71 0.82
 Prostate
 sDWI1000 0.65 0.56-0.73 0.76
 sDWI500 0.63 0.54-0.72 0.76
 RSIrs 0.77* 0.68-0.84 0.53*
 Prostate +
 aDWI 0.61 0.51-0.69 0.87
 5 mm
 sDWI1000 0.60 0.51-0.69 0.84
 margin
 sDWI500 0.56 0.47-0.65 0.84
 RSIrs 0.72* 0.64-0.80 0.62*
 Prostate +
 aDWI 0.58 0.49-0.67 0.89
 30 mm
 sDWI1000 0.52 0.43-0.61 0.83
 margin
 sDWI500 0.51 0.42-0.61 0.86
 RSIrs 0.72* 0.64-0.81 0.61*
 Prostate +
 aDWI 0.60 0.50-0.69 0.88
 70 mm
 sDWI1000 0.46 0.36-0.55 0.87
 margin
 sDWI500 0.45 0.36-0.55 0.89
 RSIrs 0.70* 0.61-0.78 0.62*
 aDWI 0.59* 0.49-0.68 0.90
 Whole FOV
 sDWI1000 0.45 0.36-0.54 0.91
 sDWI500 0.47 0.38-0.56 0.90
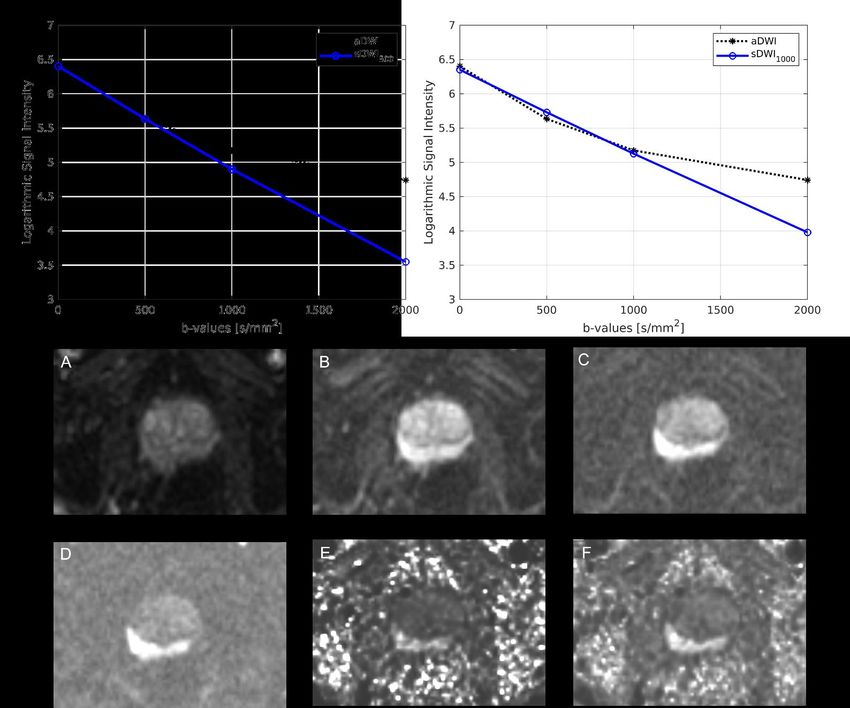
medRxiv preprint doi: https://doi.org/10.1101/2023.02.17.23286100; this version posted February 18, 2023. The copyright holder for this preprint
 (which was not certified by peer review) is the author/funder, who has granted medRxiv a license to display the preprint in perpetuity.
 All rights reserved. No reuse allowed without permission.

 Figure 1. Comparison of acquired images to those synthesized with mono-exponential models
 using either b-values up to 500 s/mm2 (sDWI500) or b-values up to 1000 s/mm2 (sDWI1000)
 presented for one representative patient. Mean value within the prostate are compared. sDWI
 is not an accurate representation of aDWI at b=2000. Figures A-F show the different diffusion
 images for one patient. A-D present the acquired images for b=0 s/mm2 (A), b=500 s/mm2 (B),
 b=1000 s/mm2 (C) and b=2000 s/mm2 (D). E and F show the synthesized b=2000 s/mm2 images.
 E shows sDWI500 and F sDWI1000. aDWI = acquired diffusion-weighted image for b=2000 s/mm2
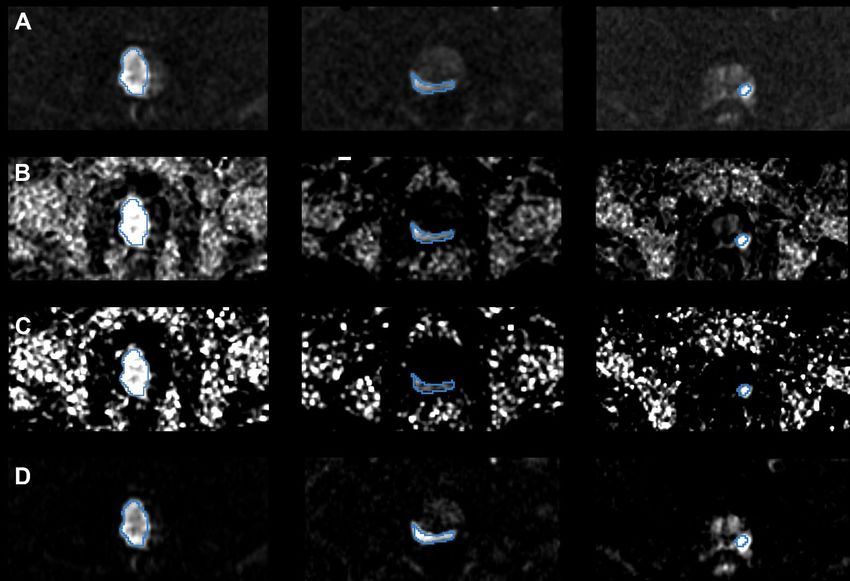
medRxiv preprint doi: https://doi.org/10.1101/2023.02.17.23286100; this version posted February 18, 2023. The copyright holder for this preprint
 (which was not certified by peer review) is the author/funder, who has granted medRxiv a license to display the preprint in perpetuity.
 All rights reserved. No reuse allowed without permission.

 a

 Figure 2. Representative images from three patients (corresponding to three columns). (A)
 acquired diffusion-weighted image (aDWI) for b=2000 s/mm2, (B) synthesized DWI using acquired
 b-values up to b=1000 s/mm2 (sDWI1000), (C) synthesized DWI using acquired values up to
 b=500 s/mm2 (sDWI500), and (D) restriction spectrum imaging restriction score (RSIrs). The
 radiologist-defined cancer lesion for each patient is indicated in blue. All presented patients had
 a PI-RADS score of 5. The same window level was chosen for all presented images.
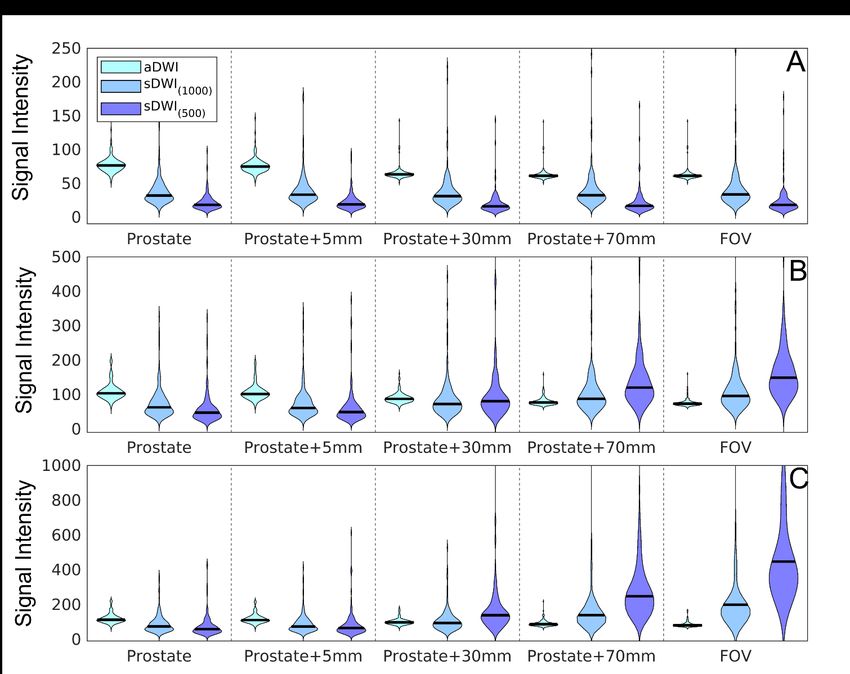
medRxiv preprint doi: https://doi.org/10.1101/2023.02.17.23286100; this version posted February 18, 2023. The copyright holder for this preprint
 (which was not certified by peer review) is the author/funder, who has granted medRxiv a license to display the preprint in perpetuity.
 All rights reserved. No reuse allowed without permission.

 Figure 3. Violin plots summarizing the signal intensity across 151 patients for (A) 50th percentile,
 (B) 95th percentile, (C) and 98th percentiles of various DWI metrics calculated for each patient.
 The percentiles are estimated over different regions of interest: the prostate; the prostate with
 varying margin (5 mm, 30 mm, or 70 mm); and the whole field of view. aDWI = acquired diffusion-
 weighted image with b=2000 s/mm2; sDWI = synthesized DWI for b=2000 s/mm2 using either
 acquired b-values up to 1000 s/mm2 (sDWI1000) or up to 500 s/mm2 (sDWI500).
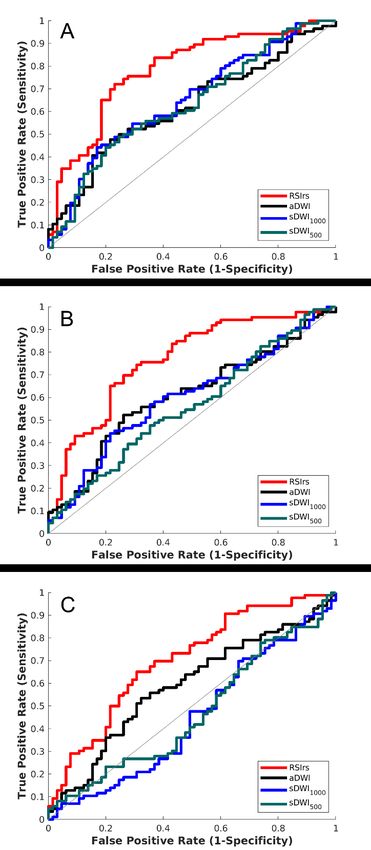
medRxiv preprint doi: https://doi.org/10.1101/2023.02.17.23286100; this version posted February 18, 2023. The copyright holder for this preprint
 (which was not certified by peer review) is the author/funder, who has granted medRxiv a license to display the preprint in perpetuity.
 All rights reserved. No reuse allowed without permission.

 Figure 4. ROC curves for DWI metrics within three ROIs (A) the prostate, (B) the prostate with
 5 mm margin, and (C) the whole field of view. The DWI metrics compared for classification
 accuracy are RSIrs , acquired diffusion-weighted images (aDWI), synthesized DWI using b-values
 up to 1000 s/mm2 (sDWI1000), and synthesized DWI using b-values up to 500 s/mm2 (sDWI500).
 Clinically significant prostate cancer was defined as a Gleason score ≥2 .
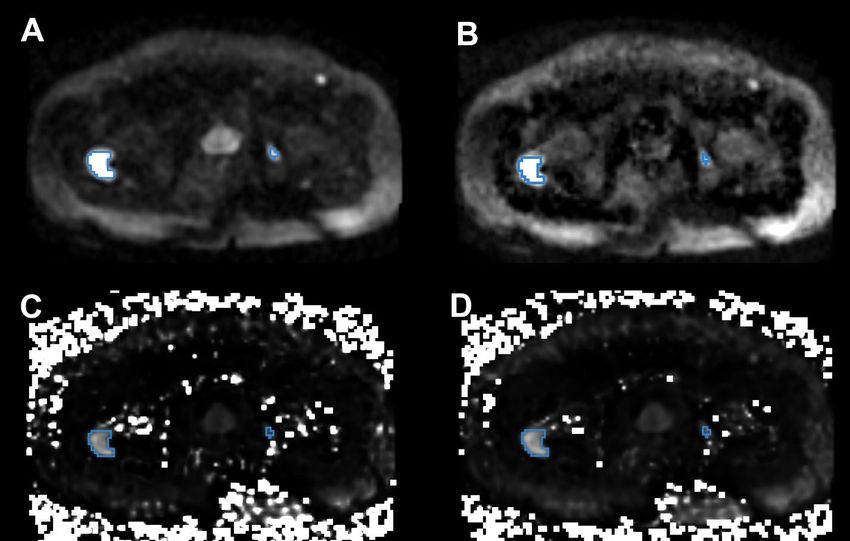
medRxiv preprint doi: https://doi.org/10.1101/2023.02.17.23286100; this version posted February 18, 2023. The copyright holder for this preprint
 (which was not certified by peer review) is the author/funder, who has granted medRxiv a license to display the preprint in perpetuity.
 All rights reserved. No reuse allowed without permission.

 Figure 5. An example of pelvic DWI in a patient with prostate cancer bone metastases. The blue
 contours mark the cancer lesions. (A) acquired DWI with b=2000 s/mm2; (B) RSIrs based on
 restriction spectrum imaging; (C) synthesized DWI using acquired b-values up to 500 s/mm2; and
 (D) synthesized DWI using acquired b-values up to 1000 s/mm2. Tumor lesions are easily
 detectible in A and B, but there is more high-intensity artifact on sDWI, and the smaller bone
 metastasis is not as easily identifiable in C and D.
You can also read


